私たちのファンページに参加してください
- ビュー:
- 18681
- 評価:
- パブリッシュ済み:
- アップデート済み:
-
 取引の機会を逃しています。
- 無料取引アプリ
- 8千を超えるシグナルをコピー
- 金融ニュースで金融マーケットを探索
-
 このコードに基づいたロボットまたはインジケーターが必要なら、フリーランスでご注文ください
フリーランスに移動
このコードに基づいたロボットまたはインジケーターが必要なら、フリーランスでご注文ください
フリーランスに移動
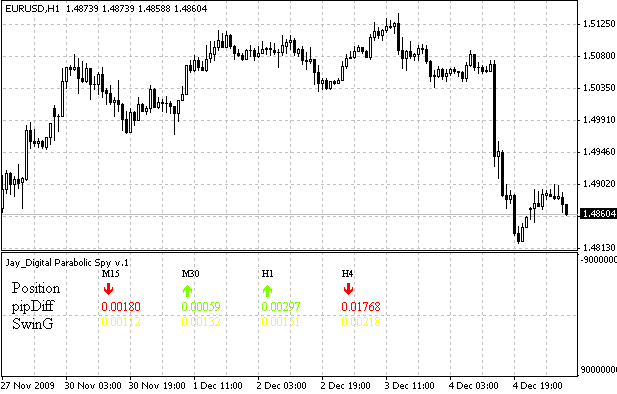
Jay Digital Parabolic Spy is a multi timeframe indicator based on the parabolic sar.
It displays timeframes from 15 minutes to 4 hours.
If the parabolic sar is below the price (indicating a buy position), then a green arrow pointing up will be displayed otherwise, a red arrow pointing down will be displayed.
The indicator shows 3 values: Position, pipDifference and SwinG.
The position indicates which direction the parabolic sar is currently in. It will display a green arrow for buy and a red arrow for sell.
Pipifference tells us howfar in pips the price is from the parabolic sar or in other words, how many pips in the oposite direction the parabolic sar will have to move before there is a reversal of the signal.
SwinG is simply the entire length of the candle measured in pips.
Please note that all the values are for the current candles on their respective timeframes.
Image:
 Elliott Waves Indicator
The indicator helps to use the Elliott waves, as described in the book "Trade Chaos" by Bill Williams.
 ArrayVirtualOrders
Library for virtual trading.
 Break-even price level (without loss level)
The script shows the price level, where total profit for all of the opened positions will be non-negative (without loss level, or break-even price level).
Jays Candle Display
Jays candle display is a multi candle displaying indicator. It displays the swing and body of candles on different timeframes from one minute up to one day.