私たちのファンページに参加してください
- 発行者:
- Dwaine Hinds
- ビュー:
- 21336
- 評価:
- パブリッシュ済み:
- アップデート済み:
-
このコードに基づいたロボットまたはインジケーターが必要なら、フリーランスでご注文ください フリーランスに移動
This is essentially a tool to estimate the general trajectory of a line drawn from a collection of data points. The estimated line is derived by first performing regression on the series of values and then calculating the slope of this resulting regression line. The data set selection can be a simple moving average, exponential moving average, close prices, high/low prices and they are automatically collected from the meta trader chart . You only need to select one type of data you want to collect. It support multiple currencies.
iTSlope(asymbol,timeframe,regperiod,adataset,rmp,rtc,slope,line_nickname,enable_text,ashift);
//This is the main function to use in your EA. Just input your own parameters.
//Manual traders can use this or use the indicator directly.
As usual, this supports multiple currencies at the same time and I am including the "BreakPoint" tool here but it is not needed by the indicator itself.
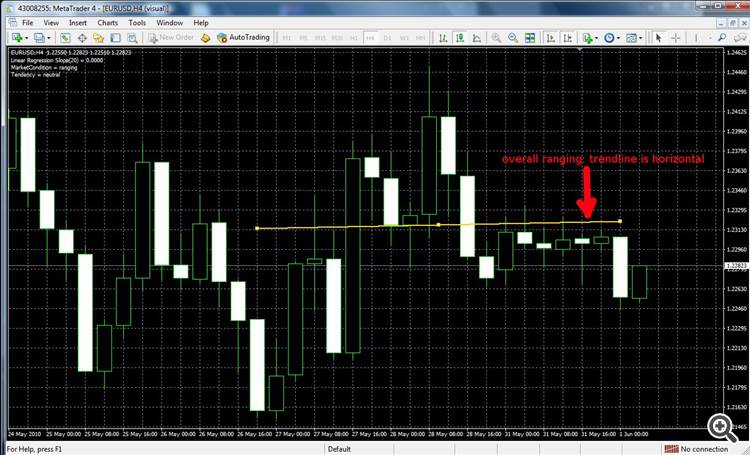
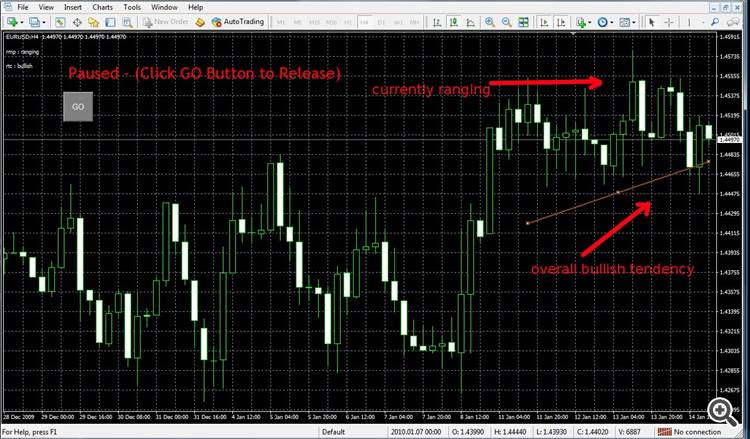
This is what the trend-line look like in a ranging market:
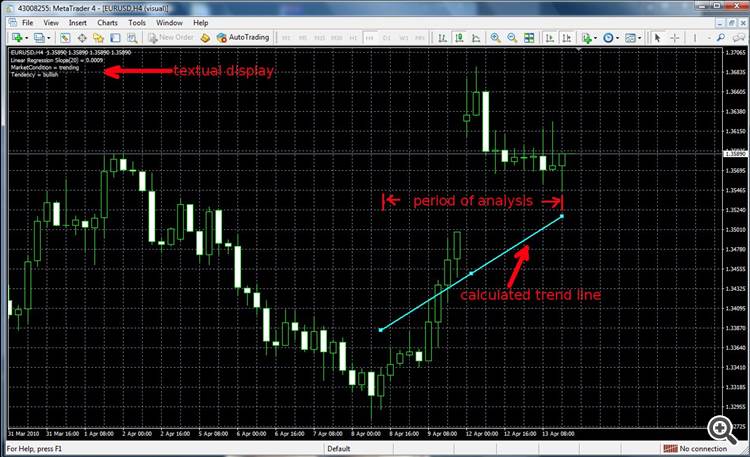
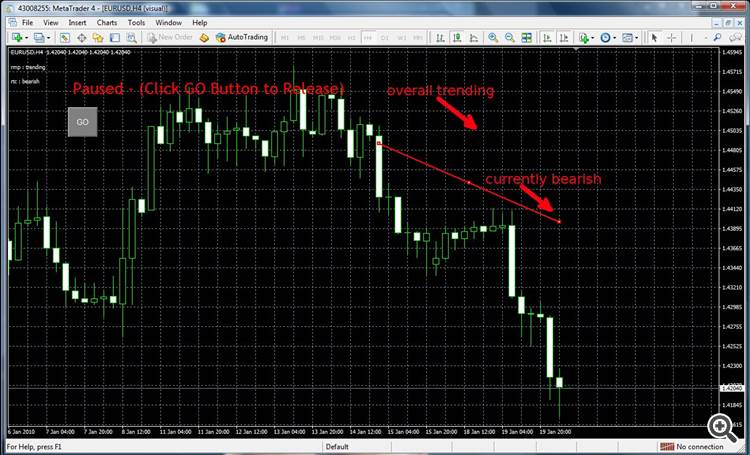
Now this is what the trend-line looks like on a trending market:
Here is a demo expert advisor:
//+------------------------------------------------------------------+
//|                                                         demo.mq4 |
//|                         Copyright 2020, Everybody Software Corp. |
//|                                             https://anywhere.com |
//+------------------------------------------------------------------+
#property copyright "Copyright 2020, Everybody Software Corp."
#property link      "https://anywhere.com"
#property version   "1.00"
#property strict
#include <TheilSen_Indicator.mqh>
#include <BreakPoint.mqh>//<--- not required
//+------------------------------------------------------------------+
//| Expert initialization function                                   |
//+------------------------------------------------------------------+
int OnInit()
  {
   return(INIT_SUCCEEDED);
  }

//+------------------------------------------------------------------+
//| Expert deinitialization function                                 |
//+------------------------------------------------------------------+
void OnDeinit(const int reason)
  {
  }

//+------------------------------------------------------------------+
//| Expert tick function                                             |
//+------------------------------------------------------------------+
void OnTick()
  {
   //---------these variables are created empty but they will contain data after iTSlop() is used below.------//
   double slope=0;//the slope of the regression line.

   ENUM_TIMEFRAMES timeframe=0;//this is the timeframe for the symbol. 0 means current chart timeframe.

   int
   regperiod=20,//the regression period. how many bars do you want to perform regression on.
   ashift=1;//the shift of the bar where you want the regression line to be drawn over.

   string
   asymbol="",//this is the symbol/currency pair you want to perform the calculations on. "" means current symbol.
   adataset="ema_close",//the type of data you want to perform regression on.
   line_nickname="anything_goes_here",
   rmp,//the calculated "market phase" which is a specific description of the market
   rtc;//the calculated "market tendency" which is a general description of the market.

   bool enable_text=true;//when set = true, textual data is displayed on the current chart.

   iTSlope(asymbol,timeframe,regperiod,adataset,rmp,rtc,slope,line_nickname,enable_text,ashift);//single currency
   //if(rmp == "trending")BreakPoint("","","",true,"rmp",rmp,"rtc",rtc,"asymbol",asymbol);
  }
//+------------------------------------------------------------------+
Special thanks whroeder and others who helped clarify the concept.
 DXYvsEXY for MT4
Indicator DXYvsEXY is the USDX vs EURX with Awesome Oscillator Indicator for MT4.
 VR Watch List and Linker Lite
Synchronous change of a trading instrument in all charts
 CCI H MTF Colored
Fully customizable: Period, TimeFrame, Color, and Price. Above 0: Chartreuse Below 0: Red Above 100: Marron Below -100: Dark Green
 ATR adaptive SMA
ATR adaptive SMA (Simple Moving Average)


