私たちのファンページに参加してください
- ビュー:
- 48321
- 評価:
- パブリッシュ済み:
- アップデート済み:
-
このコードに基づいたロボットまたはインジケーターが必要なら、フリーランスでご注文ください フリーランスに移動
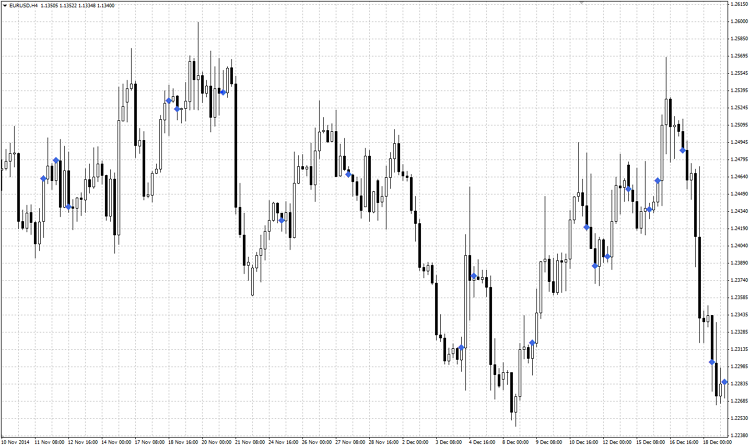
This indicator places a marker on a chart based on a divergence between trade volumes and bar sizes, i.e. if bar size has been decreasing/increasing for N continuous bars and volume has been doing the opposite, a marker will be placed.
Usually, the markers are placed near the peaks before a reverse or in the middle of a technical correction during a trend. This indicator can be used to identify potential entry or exit points, depending on the configuration of input parameters. VDM does not provide complete information about potential trades if used without other indicators.
Higher input variables values mean less frequent signals. I am currently experimenting on how the false signals can be filtered. Also, a complementary indicator, which shows the direction in which the positions should be opened, is currently in development. Feel free to post your suggestions about improving this indicator.
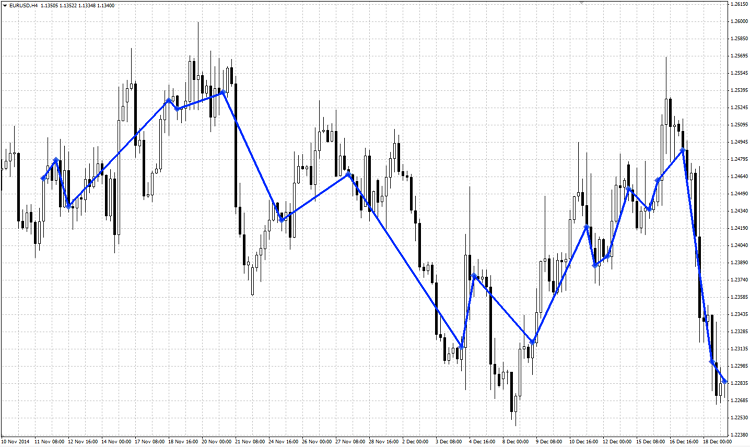
UPDATE 27.05.2015: I have added the lines between markers, as requested. By default, they will be the same color as the markers.
Input variables:
- Whether or not zero bar should be counted.
- Convergence or divergence switch (convergence creates markers if both volume and bar sizes are moving in the same direction; divergence - in the opposite).
- How long the volume has to increase/decrease to trigger the marker (in bars).
- How long the bar size has to increase/decrease to trigger the marker (in bars).
This is how it looks like:

This is to demonstrate the potential profits:

Recommendations:
- The purpose of this indicator is to maximise profits by opening/closing trades at optimal entry/exit points.
- The optimal values for input variables are somewhere between 1-3 bars. Values above 4 are pointless because it never happens on a market.
- Works best during flat price movements.
- IMPORTANT! Do not use this indicator on its own to open any trades because it doesn't show the direction of price movement.
 RoNz Higher Timeframe High and Low
This indicator shows High and Low points for certain timeframe.
 Making ScreenShot
The script allows you to get a certain section of the chart image specified by the user.
 VSA Syndicate Trader v1.04
Syndicate Trader is coded from the basic VSA (Volume Spread Analysis) study by Wyckoff.
 ProfitLine
Graphical calculation of profit/loss from lot, or vice versa.