私たちのファンページに参加してください
- ビュー:
- 29823
- 評価:
- パブリッシュ済み:
- アップデート済み:
-
このコードに基づいたロボットまたはインジケーターが必要なら、フリーランスでご注文ください フリーランスに移動
Description:
The concept comes from Market Flow Analysis Method (MFAM) mentioned on http://www.eminisuccessformula.com by Todd Mitchell (I have no relationship with this website nor Todd Mitchell)
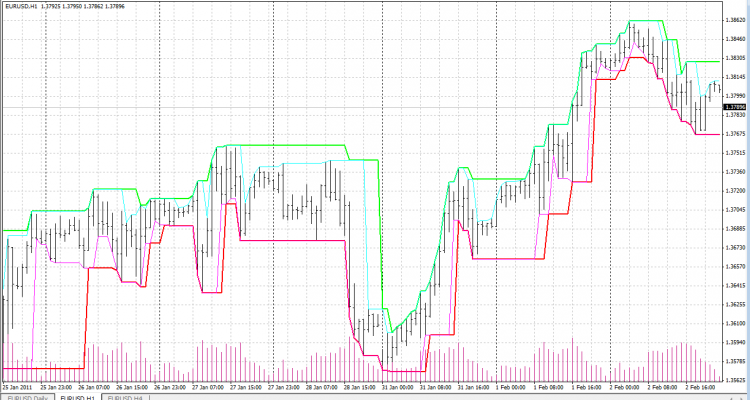
The program keeps track of Highest Highs (& Lowest Lows) and also whether there a trend change seems to be taking place.
The bold Red & Green indicate the Highest High & Lowest Low. The fainter cyan & magenta lines track Active High & Low, which may become Highest/Lowest if a Price Break occurs.
The theory is that you go long when price breaks through the Highest High, or short when it breaks drops below Lowest Low. This is signaled when the green line jumps up, or the red line down.
A PDF explaining this is concept also available at https://s3.amazonaws.com/eminisuccessformula/Truth+About+Trends.pdf
Whilst developing it, I initially just tracked 'periods since Highest High' etc into a separate chart. With a one-line source change (indicator chart) & one parameter, this can be recreated.
There is also another parameter to limit how long a Highest High etc can be active for (This was added with the intention of removing the usage of 4 buffers, but has not been done).
Image:
 Doda-Bollinger Bands
Modified version of famous Bollinger Bands.
 pSAR bug 5
Opens and closes orders using parabolic SAR signals
 Urban Towers
The indicator shows the arrows point of entry into the position according to the Urban Towers Scalping Strategy.
 EMAplusWPR
Expert advisor that trade in the trend of EMA and buy/sell signals get from Williams %R
