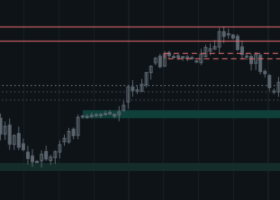
Premium/Discount (PD) is an ICT concept for reading where price sits inside its current swing range. Find the most recent meaningful swing high and low, split that range in half, and you get the Equilibrium (EQ) line. Price below EQ is trading at a Discount (a cheaper, buy-side-favored zone); price above EQ is trading at a Premium (a pricier, sell-side-favored zone).
The problem is the same one every discretionary trader runs into: figuring out which symbols are currently in Discount vs. Premium — and on which timeframe — takes manual chart-by-chart checking. PD All Currency Scanner 448 Dashboard automates that check across up to 448 combinations (symbols × timeframes) on a single screen.
What is Premium/Discount

Real Examples
Fact-review note: these are single-day price-action walkthroughs from the IFVG edition, not PD-specific examples, and not a guarantee of win rate or repeatability. Do not use "this works every time" style claims.
What Changes When You Can Watch More Symbols
Checking Premium/Discount bias one chart at a time means you only ever see the setups you happened to look at. Scanning up to 448 combinations at once means you can compare bias across your entire watchlist before deciding where to focus — narrowing down to symbols already aligned with your directional read, instead of checking each one by hand.
Because up to 448 combinations are consolidated on a single screen, you no longer need to keep multiple charts open just to keep an eye on things. Clicking a timeframe label opens that exact symbol/timeframe chart instantly.
What's Inside ─ Reading the Dashboard by Color

Feature Summary
- Monitors up to 448 combinations (symbols × timeframes) at once, using the same AllSearch.mqh scanning architecture as the IFVG edition
- Flags each symbol/timeframe as Discount or Premium based on its position inside the most recent valid swing range
- Swing range is derived from fractals, filtered by ATR so only meaningful swings count
- Click any timeframe label to instantly open that exact symbol/timeframe chart (shared dashboard behavior)
How It Works
For each symbol/timeframe, the indicator looks backward (up to PD_MaxBars bars) to find the nearest fractal swing point at or beyond the current price — this becomes the "anchor." It then keeps searching further back for the first opposite-side fractal whose distance from the anchor is at least ATR × PD_ATRMult . That pair of points defines the current swing's high and low.
The Equilibrium is the midpoint of that high/low range: EQ = (High + Low) / 2 . If the current close is at or below EQ, the symbol/timeframe is flagged as Discount (buy-side bias). If it's above EQ, it's flagged as Premium (sell-side bias).
Input Parameters

| Parameter | Default | Description |
|---|---|---|
| PD_ATRPeriod | 14 | ATR period used to size the minimum valid swing |
| PD_ATRMult | 1.5 | Multiplier applied to ATR — the anchor and the opposite fractal must differ by at least this much for the swing to count |
| PD_MaxBars | 500 | Maximum number of bars searched backward when looking for the swing range |
Coverage
| Item | Detail |
|---|---|
| Baseline layout | Up to 448 combinations (symbols × timeframes), same architecture as the IFVG edition |
| Supported symbols | Any symbol shown in MT4's Market Watch — forex, gold, etc. (TODO: confirm for this specific tool) |
| Platform | MetaTrader 4 |
Trading Workflow

- Check the dashboard: see which symbols/timeframes are currently flagged Discount or Premium
- Open the chart: click the timeframe label to confirm where price sits inside the swing range visually
- Combine with your own rules: use the bias as context, not as a standalone entry signal, and wait for your own confirmation
Who This Is For
- Traders who already use Premium/Discount for bias and entry timing but want it checked across their whole watchlist, not one chart at a time
- Traders who want to narrow down which symbols to focus on before diving into individual charts
Usage Notes
- The swing range is derived from fractals, so it needs enough price history loaded on each chart to detect a valid anchor and opposite point
- A larger PD_ATRMult filters out smaller, less significant swings; a smaller value will flag more (and noisier) ranges
About the Author
20 years of discretionary forex trading experience. Built around ICT / Smart Money Concepts market-structure analysis, the author has spent 10 years developing and running an independent tool suite (the All-Currency Search Lab) that scans across all symbols and all timeframes.
The 448 Scanner Series
| Tool | Price | Link |
|---|---|---|
| IFVG All Currency Scanner 448 Dashboard | 35 USD | View |
| Premium Discount Scanner 448 | Free | View |
| MA Perfect Order All Currency Scanner | Free | View |