
Why Most Support and Resistance Indicators Fail — And How AI Zone Radar Solves It

Support and resistance is the foundation of every trading strategy. Whether you trade gold, forex, or indices — knowing where price is likely to reverse is the most important piece of information on your chart.
But here's the problem: most traders either draw lines manually (inconsistently) or use indicators that flood the chart with dozens of meaningless levels.
After 12 years of trading XAUUSD and developing indicators, I built AI Zone Radar to solve this specific problem. This article explains exactly how it works and why the approach is different.
The core problem: Not all support/resistance levels are equal
Open any support/resistance indicator on your chart. You'll see 10, 20, sometimes 30+ lines. Some are from last week. Some are from last month. Some have been broken 5 times already.
Which ones actually matter right now? Most indicators can't tell you.
This is the core problem. Detection is easy — any fractal pivot can identify swing highs and lows. The hard part is scoring — determining which of those levels are strong enough to actually cause a price reaction.
The solution: 5-layer intelligent scoring
AI Zone Radar doesn't just find levels. It evaluates every detected zone using 5 independent scoring layers, then assigns a rating from ★1 (weak) to ★5 (institutional-grade).
Here's what each layer does:
Layer 1 — Body vs. Wick Reaction
When price reaches a support zone, how does it react? If the candle body closes above the zone, that's a strong reaction — the zone held with conviction. Score: 1.5x.
If only the wick touches the zone while the body stays far away, that's a weaker signal — price barely tested the level. Score: 0.5x.
This single distinction eliminates a huge number of false zones that look important on a chart but never actually held price.
Layer 2 — Exponential Time Decay
A support level from 3 days ago is far more relevant than one from 3 months ago.
AI Zone Radar applies exponential time decay to every zone. Recent touches get maximum weight. Zones older than 30 days decay to near zero and eventually disappear from your chart.
This means your chart always shows current levels, not historical noise.

Layer 3 — Touch Frequency
If price visits a zone 4 times in 3 days, that zone is being actively defended — likely by institutional orders.
If price touches a zone once and never returns, it might just be a random swing point.
AI Zone Radar counts touch frequency relative to time. Clustered touches in a short period dramatically increase the score.
Layer 4 — Volume Confirmation
When price reaches a zone, is there real participation? Or is it happening in a thin, low-volume environment?
If tick volume at the zone exceeds 1.3x the average, the score increases. This suggests large players are actively buying or selling at that level — a strong sign that the zone will hold again.
Layer 5 — Break Penalty
This is arguably the most important filter.
Many indicators keep showing "support" levels even after price has crashed through them 3 times. That's not support anymore — that's a broken floor.
AI Zone Radar tracks how many times a zone has been breached:
- 1 break: 25% score reduction
- 2 breaks: 50% reduction
- 3+ breaks: 70% reduction
Broken zones fade away. Only zones that are actually holding price survive with high scores.
ATR-Adaptive Detection — No Fixed Settings Required
Gold at 8 AM Tokyo time and gold at 3 PM London time are completely different instruments in terms of volatility.
Most support/resistance indicators use fixed parameters. "Detect zones within 50 pips." This fails because:
- During Asian session, 50 pips is too wide — you'll merge levels that should be separate
- During London news events, 50 pips is too narrow — you'll split one real zone into fragments
AI Zone Radar uses ATR (Average True Range) to automatically scale its detection. High volatility → wider zones. Low volatility → tighter zones. The indicator adapts to the market. You never need to adjust settings.
The Real-Time Analysis Panel
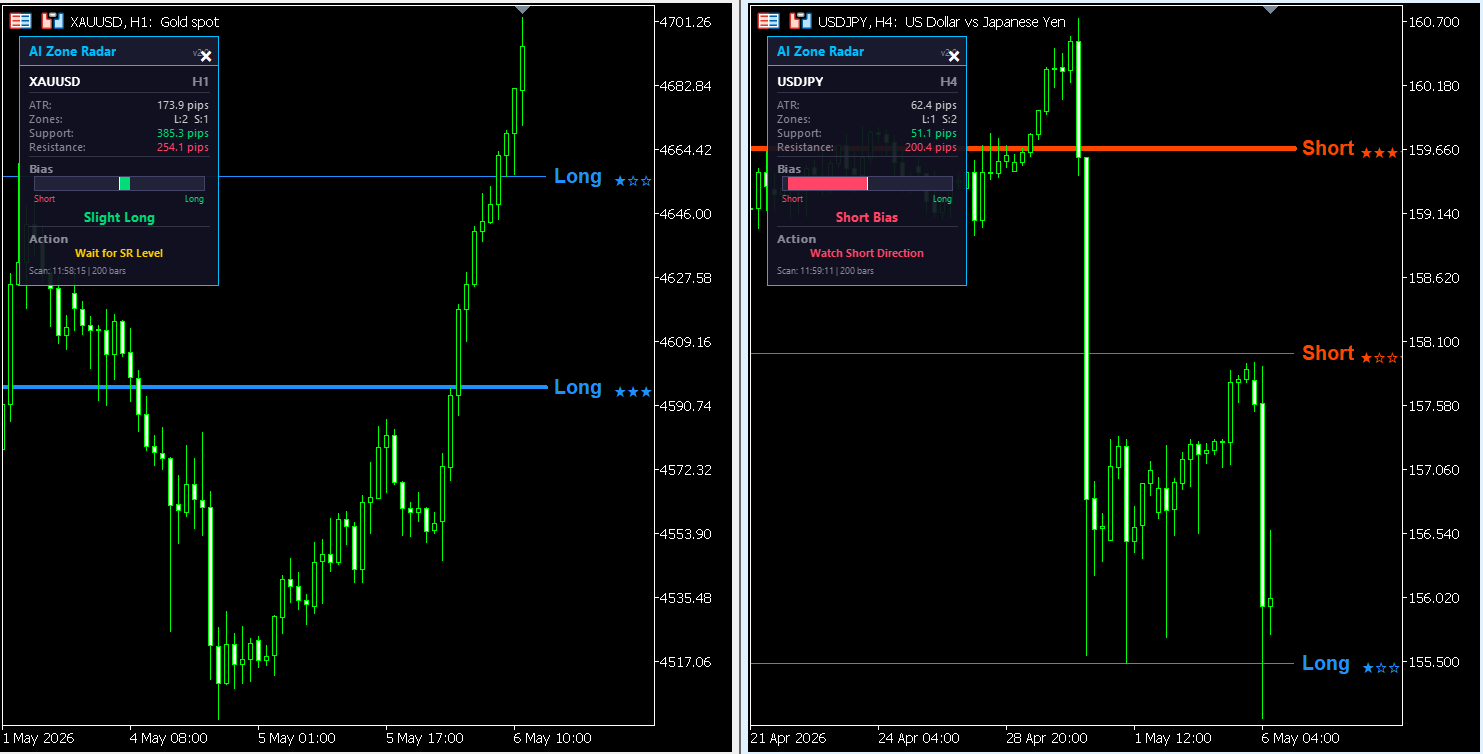
The panel in the top-left corner gives you a complete market snapshot:
ATR — Current volatility in pips. Tells you how "active" the market is right now.
Zones (L/S) — Number of detected support (Long) and resistance (Short) zones. More short zones above = resistance-heavy environment.
Support/Resistance Distance — How far (in pips) to the nearest zone in each direction. When this number gets small, pay attention.
Bias Gauge — A visual bar showing the balance between support and resistance strength. Skewed right = long bias. Skewed left = short bias. Centered = neutral.
Recommended Action — The panel generates one of 6 contextual messages:
- "Support Near - Long Setup" (high-score support within 0.5×ATR)
- "Resistance Near - Short Setup"
- "Support Near - Bounce Watch"
- "Resistance Near - Drop Watch"
- "Watch Long/Short Direction" (bias detected but no zone nearby)
- "Wait for SR Level" (no actionable setup)
This is not a signal. It's context. It tells you what to watch for, so you're prepared when price reaches a key level.
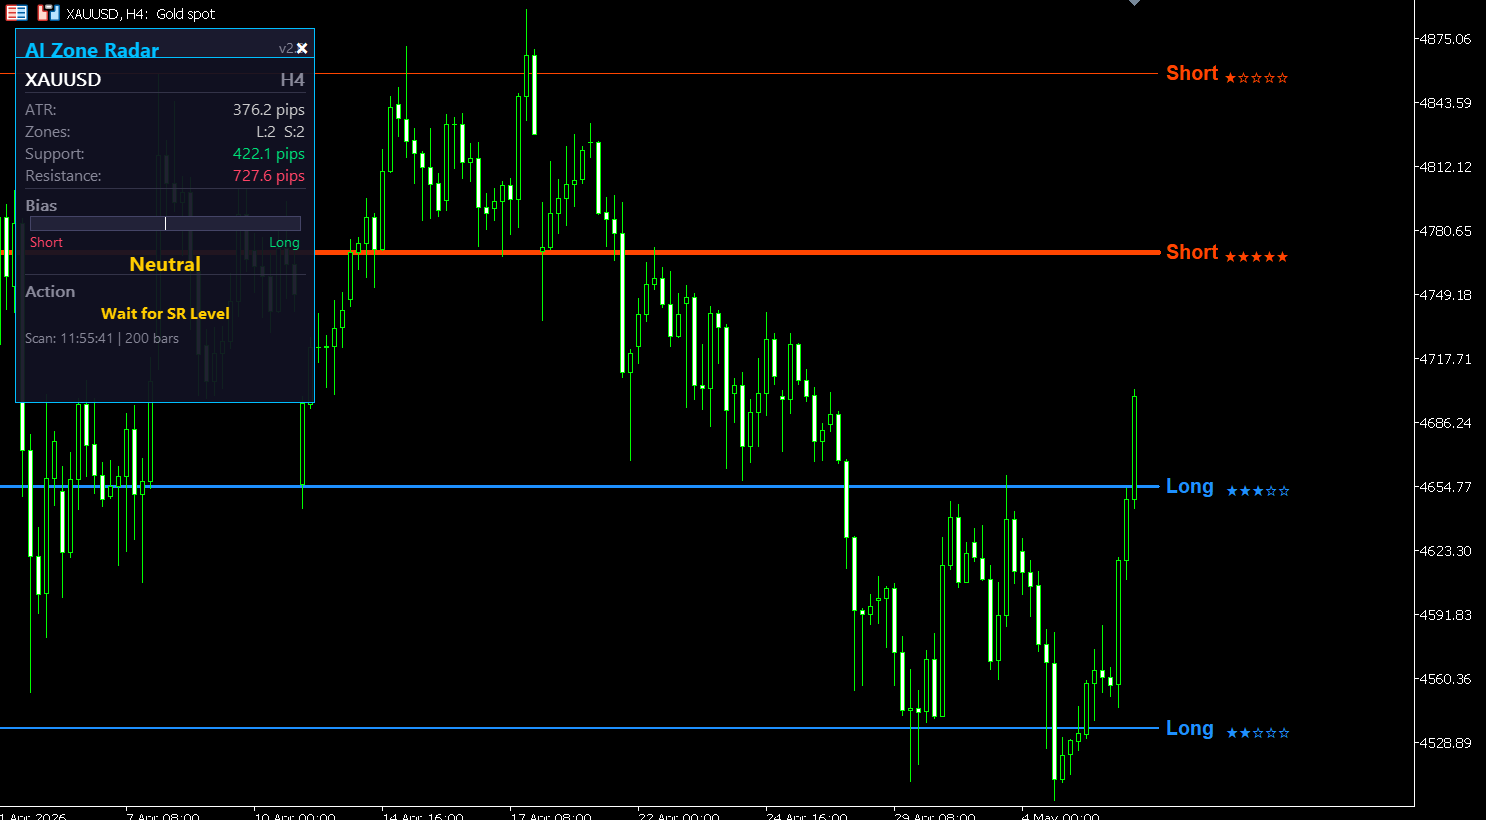
Visual Display — Information Without Clutter
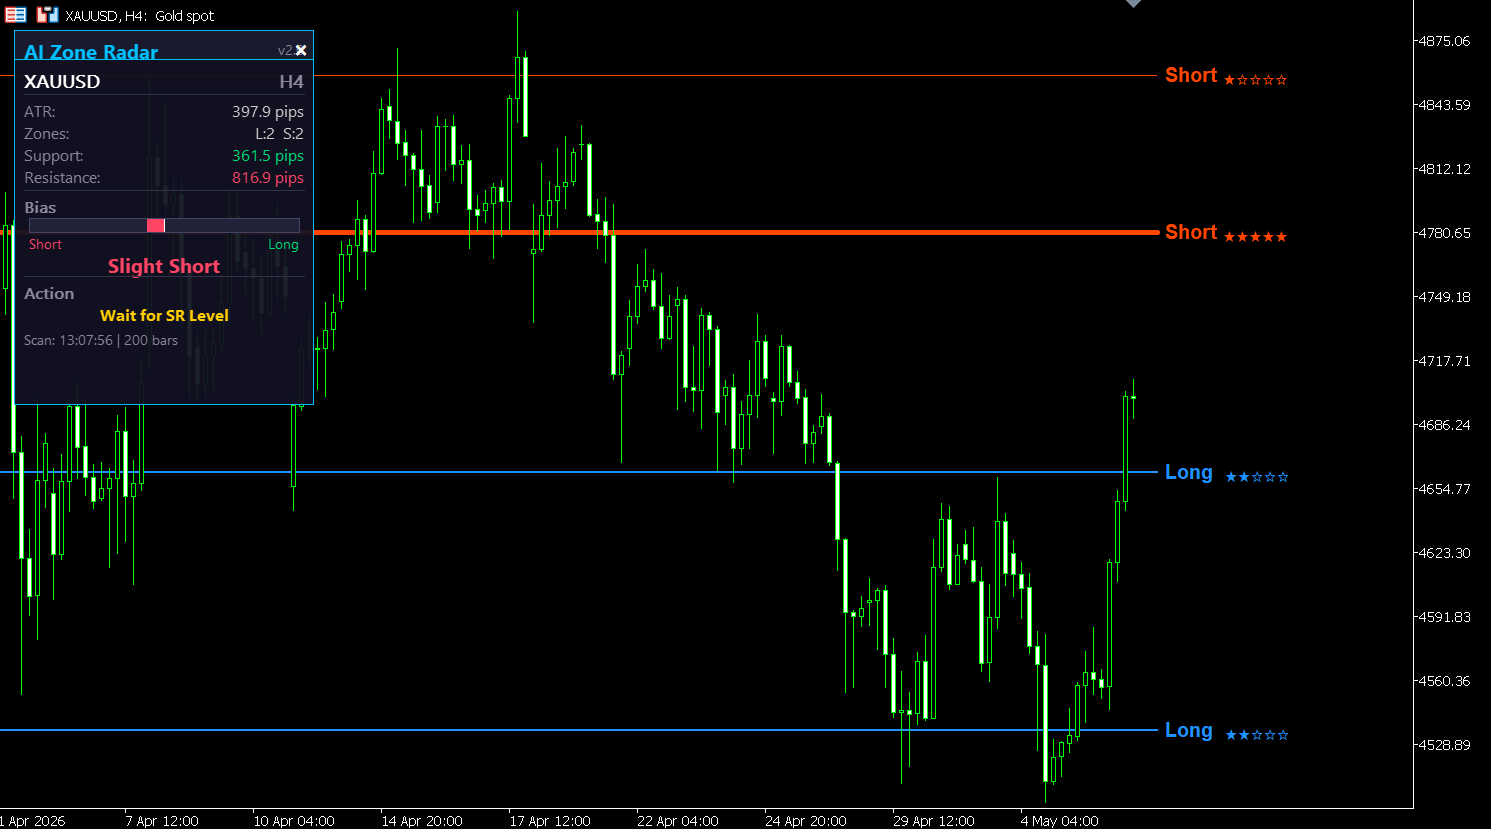
Every design decision was made to keep your chart clean:
- Line thickness = zone strength. ★1 zones are hair-thin. ★5 zones are bold. You instantly see which levels matter without reading any numbers.
- Blue = support. Red = resistance. Universal color coding.
- ★ rating next to each line. "Long ★★★★☆" or "Short ★★★★★" — tells you the direction and strength in one glance.
- No filled rectangles, no shaded areas, no visual noise. Just lines and labels.
How I Actually Use It
My personal workflow:
- Open chart. Check the panel for current bias and nearest zone distances.
- If a ★4 or ★5 zone is within 1×ATR of current price — I start watching.
- When price reaches the zone, I look for a confirmation entry (candlestick pattern, my signal indicator, etc.)
- TP target = the next zone in the opposite direction. Zone-to-zone trading.
- If only ★1-★2 zones are nearby, I wait. No high-quality zones = no trade.
This approach works because it answers the two most important questions before every trade:
- "Is there a reason for price to reverse here?" (★4-★5 zone = yes)
- "Where is my target?" (next opposing zone)
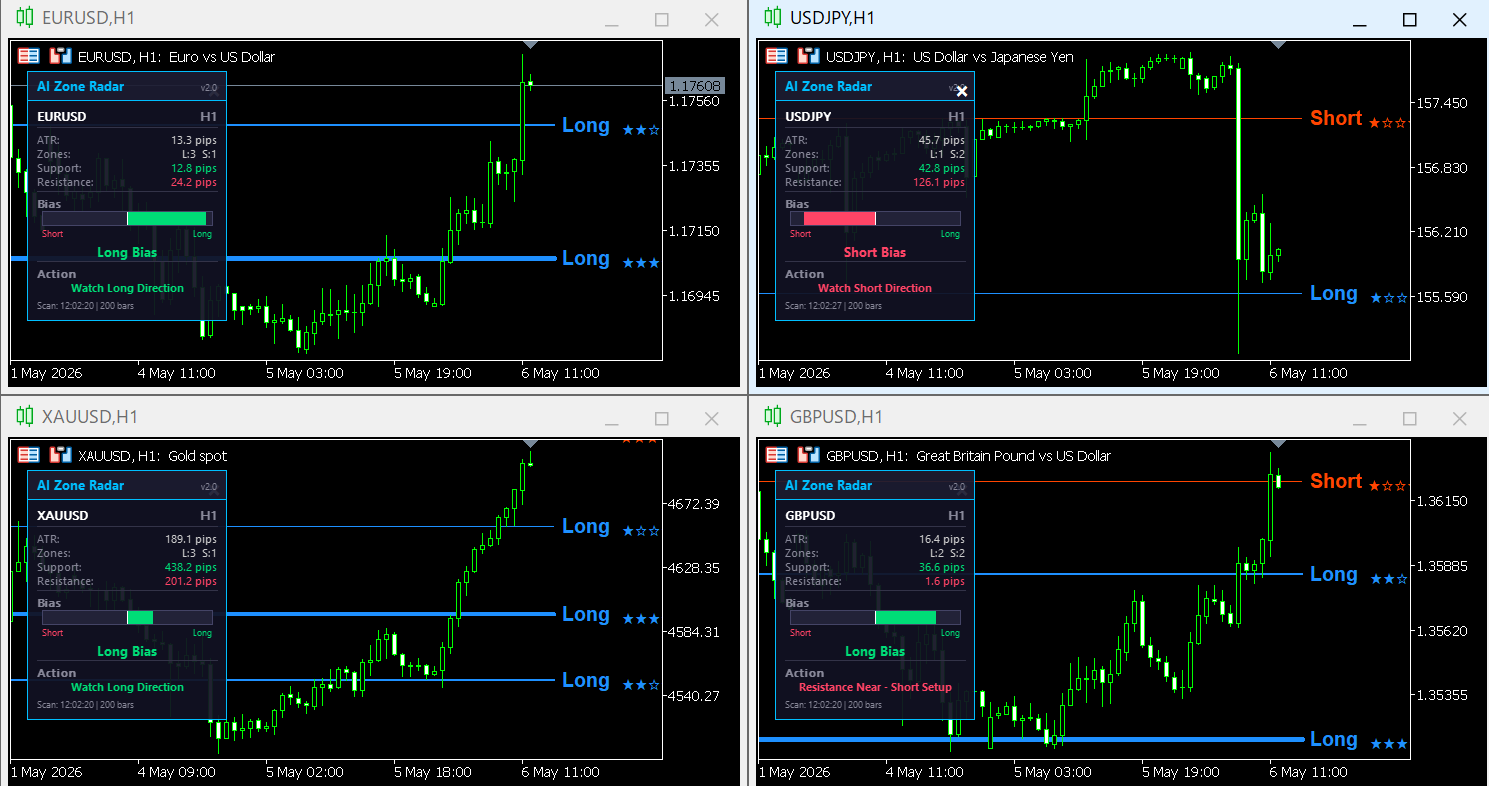
Works on Everything
AI Zone Radar is not gold-specific. It works on:
- XAUUSD (Gold) — my primary instrument
- EURUSD, GBPUSD, USDJPY — major forex pairs
- BTCUSD — crypto
- US30, NAS100 — indices
- Any symbol available in MT5
- Any timeframe from M1 to Monthly
The ATR-adaptive engine automatically calibrates for each instrument's volatility characteristics.

Parameters
- Fractal Period (default: 5) — Pivot detection sensitivity
- SR Lookback Bars (default: 200) — Scan depth
- SR Merge Distance (default: 2.0×ATR) — Zone clustering threshold
- ATR Period (default: 14)
- Max Zones (default: 6)
- Display Range (default: 8.0×ATR)
- Colors: Customizable for support and resistance
- Score Labels: ON/OFF
- AI Panel: ON/OFF
What this indicator does NOT do
I want to be clear about what AI Zone Radar is and what it isn't:
- It does NOT generate buy/sell signals. It shows you where to look, not when to click.
- It does NOT predict the future. Zones are based on historical price reactions.
- It does NOT guarantee profits. No indicator can.
- It does NOT repaint. Confirmed zones remain fixed.
This is a decision-support tool. It replaces manual line drawing with algorithmic zone detection and scoring. The trading decisions are still yours.
Try It
AI Zone Radar is available on MQL5 Market for MT5:
→ AI Zone Radar on MQL5 Market
Available as monthly rental or lifetime purchase. Start with a rental — apply it to your charts, scroll through past price action, and see for yourself whether the ★4-★5 zones held.
If you need a detailed user manual, message me directly on MQL5.
This article describes a tool I developed for my own trading. It is not investment advice. All trading decisions are your responsibility. Past zone performance does not guarantee future results.


