チャート上でトレーディングの考え方を時間をかけずに検証する方法
はじめに
第6回目の自動売買チャンピオンシップがついに開始されました。最初の盛り上がりは去り、少しリラックスし提出された売買ロボットを検証することができるようになりました。そこで最新売買ロボットのもっとも顕著な特徴を見つけ、そのトレード機能に何が期待できるのか見極めるべく少しばかり調査をすることにしました。
しかしそれは難しいことが判りました。そのため私の計算は完璧に正確だとか完成されているということはできません。私の手元にあるのは Expert Advisor の記述と開発者の稀なコメントだけだからです。ただそれでもある結論を導くことはできます。下記が私の結論です。:チャンピオンシップには 451 件の Expert Advisors が出場していますが、内、意義ある記述を持つのはたった 316 件です。それ以外はプログラム記述が友人や家族へのあいさつ、宇宙人へのメッセージ、自画自賛で埋められています。
ATC 2012 におけるもっともよく知られる戦略
- 多様なグラフィカルコンストラクションを使用しているトレーディング(重要な価格レベル、サポートレジスタンスレベル、チャネル)- 55
- 価格変動分析(さまざまな時間枠に対して)- 33
- トレンド追跡システム(この大げさな言葉にはなにか過剰に最適化された移動平均の組合せが隠されていますが、私は間違っているかもしれません :) )- 31
- 統計的価格パターン- 10
- アービトレーション、シンボル相関関係分析- 8
- 予想変動率分析- 8
- ニューラルネットワーク- 7
- ろうそく足分析- 5
- 平均値- 5
- 戦略の組み合せ- 5
- トレーディングセッション時間- 4
- 乱数ジェネレータ- 4
- ニュースのトレード- 3
- エリオット波動-2
もちろん指数戦略がこれまでもっとも知られるものの一つです。Expert Advisor の特定のインディケータの役割を明確にするのは困難ですが、その絶対的使用数を推定することは可能です。
- 移動平均- 75
- MACD-54
- ストキャスティックオシレータ- 25
- RSI - 23
- ボリンジャーバンド-19
- フラクタル- 8
- CCI、ATR - 各7 インディケータ
- Zigzag、パラボリック SAR- 各6 インディケータ
- ADX - 5
- モメンタム- 4
- カスタムインディケータ(なんと面白い:)) - 4
- 一目均衡表、AO - 各3 インディケータ
- ROC、WPR、StdDev、ボリューム - 各2 インディケータ
データから得られるのは以下の結論です。ほとんどの出場者はインディケータを伴う戦略に従ったトレードを採用します。おそらく私はデータ収集段階で何か見落としをしたのでしょう。自動売買の分野における際立った特徴が現れるのを見ていくことになるのでしょうが、今のところそれは起こりそうにもありません。主な問題はマーケットに魅了された初心者はたいていの場合知識ではなくルールを受け入れることです。
たとえば、MACDを使うルールがある、シグナルがある、これでパラメータを最適化してお金を稼ぐのだ、という具合です。ちょっとは脳みそを使ったらどうですか?こんなことまったく無意味です!基準となるものはすでに開発済みです!なぜそれをまた一から始めるのですか?現在人気のインディケータは私やあなたと何も違わないトレーダーによって考え出されたのです。かれらも自身の基準と根拠を持っていたのです。もしかしたらあなたの名前がついた新しいインディケータが 10 年後標準的なインディケータになるかもしれません。
そんなわけで、これからトレーディングの考え方を検索する方法やその考え方を時間をかけずに検証する方法をみなさんと共有したいと思います。
メソッドの記述
テクニカル分析はすべて一つのシンプルな原理を基にしています。すなわち価格がすべてを考慮する、です。 しかし一つ問題があります。この意見はダイナミクスを欠いています。チャートを見て、静的イメージを確認します。価格は実際にはすべてを考慮してきているのです。ただし、収益を得るために、将来のある期間に価格は何を考えるのか、それはどこに向かうのか知りたいと思います。価格から派生するインディケータは将来に起こりうる変動を正確に予想するために作成されています。
物理学で知っているように大きさの一次微分係数は速度です。よってインディケータは現在価格変動のスピードを計算します。また有意な大きさは慣性を持ち、大きな外力の干渉なしに値の急激な変動で起こるスピードを避けることもわかっています。それが次第にトレンドのコンセプトに近づく方法-一次微分係数(スピード)が外力(ニュース、中央銀行の政策等)がマーケットに影響を与えない期間内、その値を保つ価格状態、です。
ですがここでスタート地点に戻りましょう。価格がすべてを考慮する、というところです。新しい考えを発展させるには、価格の動向および同じ時間間隔における微分係数を検証する必要があります。価格チャートを注意深く検証するだけが盲信からみなわんのトレーディングを純粋な理解のレベルに引き上げるのです。
これがトレーディングの結果をすぐに変えることにはなりませんが、数多くのなぜ?という質問に答える力は遅かれ早かれ役に立つものです。その上、チャートとインディケータの視覚的分析によりインディケータの開発者には見通せなかったまったく新しい相関関係を価格とインディケータの間に見つけることができるかもしれません。
思い通り役立ちそうな新しい相関関係を見つけたとします。では次にくるのは何でしょうか?もっとも簡単な方法はExpert Advisor を書き、履歴データに基づきそれを検証し、予想が正しいと確認することです。そうでなければ、パラメータを最適化する共通の方法を選択する必要があります。これに関する最悪のことがらは、なぜ?という質問に答えられないことです。なぜ Expert Advisor は損失を生む/収益性があるようになったのでしょうか?なぜそのような大きなドローダウンが生じたのでしょうか?答えなしには自分の考え方を効果的に取り入れることはできません。
取得した相関関係の結果をチャート上で適切に視覚化するために以下を行います。
- 必要なインディケータを作成または変更し、それがシグナルを生成するようにします。: -1 は売り、そして1 は買いです。
- チャートに参入点と終了点を表示する残高インディケーを連動します。インディケータはまたシグナル処理中の残高と資本(ポイント表示)の変動を表示します。
- そしてどのような場合また状況で予想が正しいか分析します。
方法には一定のメリットががあります。
- まず、残高インディケータは最大スピードで計算し、自動で入力計算配列の履歴データを利用できる OnCalculate メソッドを使って全体的に計算されます。
- 二番目に既存のインディケータにシグナルを追加することは「ウィザード」を介して Expert Advisor を作成することと自分で Expert Advisor を作成することの中間的なステップです。
- 三番目に考え方と最終結果は単一チャートで確認可能です。もちろんこの方法にはいくつかの制約があります。:シグナルがバーの終値に固定されている、残高は定数ロットに対して計算される、指値注文を使用してトレードするオプションは一つもない、などです。ただし、これら制約は簡単に修正/改善ができます。
実装
シンプルなシグナルインディケータを作成し、それがどのように動作するか理解し、この方法の利便性を評価します。ろうそく足パターンのことは以前から聞いています。実践でその動作を確認してはどうでしょうか?買いシグナル、売りシグナルにそれぞれ『ハンマー』と『流れ星』の逆パターンを選択しました。下図はそれらの視覚化されたスキームを示しています。
図1 ろうそく足パターン:"Hammer"と"Shooting Star"』
ここで"Hammer"パターンが現れるときのマーケット参入ルールを定義します。
- ろうそくの安値は前5本のろうそくの安値よりも低くなる必要があります。
- ろうそくの本体は高さ全体の 50% を越えません。
- ろうそくの上側のヒゲは高さ全体の 0% を越えません。
- ろうそくの高さはそれより以前の 5本 のろうそくの平均高さの 100% よりも低くなります。
- このパターンの終値は期間 10 の「移動平均」よりも低くなります。
これら条件が満たされれば、ロングポジションをオープンします。"Shooting Star"パターンに対してもルールは同じです。唯一の違いは"Shooting Star"パターンではショートポジションをオープンすることです。
- ろうそくの高値は前5本のろうそくの高値よりも高くなる必要があります。
- ろうそくの本体は高さ全体の 50% を越えません。
- ろうそくの下側のヒゲは高さ全体の 0% を越えません。
- ろうそくの高さはそれより以前の 5本 のろうそくの平均高さの 100% よりも低くなります。
- このパターンの終値は期間 10 の「移動平均」よりも高くなります。
将来最適化する可能性がある(パターンが受け入れ可能な結果を示せば)描画に基づき使用するパラメータのスタイルには太文字を使いました。希望の制限を取り入れ、不適切な外見を持つものからパターンを除外することができます(pp. 1-3)。シグナルとして受け入れられない弱いとわかっているものからのパターンも同様です。
その上、終了時も決定する必要があります。前述のパターンはトレンド逆シグナルとして現れるため、トレンドは適切なろうそくが出現するときに存在します。そのため価格を追う移動平均もまた存在することとなります。終了シグナルは価格と 10期間移動平均をクロスすることで形成されます。
では、プログラムにまいります。MQL5 「ウィザード」で新しいカスタムインディケータを作成し、それを PivotCandles と名づけ、そのふるまいを記述します。残高インディケータと連携するように戻り値を定義します。
- -1 -売りポジションをオープンします。
- -2 -買いポジションを終了します。
- 0 -シグナルなし
- 1 -買いポジションをオープンします。
- 2 -売りポジションを終了します。
ご存じのように本物のプログラマーは簡単な方法を探そうとしないものです。彼らはもっとも簡単な方法を探すのです。:) 私も例外ではありません。ヘッドフォンで音楽を聴き、アロマコーヒーを飲みながら、インディケータおよび Expert Advisor (インディケータを基にそれを作成しようと決めた場合)に実装するクラスを持つファイルを作成しました。たぶんそれは別のそうろく足パターンのために変更することも可能です。コードはなにも新しいことを含んでいません。コードに実装されるコメントは出る可能性のある課題に対応しているはずです。
//+------------------------------------------------------------------+
//|                                            PivotCandlesClass.mqh |
//|                        Copyright 2012, MetaQuotes Software Corp. |
//|                                              http://www.mql5.com |
//+------------------------------------------------------------------+
#property copyright "Copyright 2012, MetaQuotes Software Corp."
#property link      "http://www.mql5.com"
//+------------------------------------------------------------------+
//| Input parameters                                                 |
//+------------------------------------------------------------------+
input int      iMaxBodySize            = 50;  // Maximum candle body, %
input int      iMaxShadowSize          = 0;   // Maximum allowed candle shadow, %
input int      iVolatilityCandlesCount = 5;   // Number of previous bars for calculation of an average volatility
input int      iPrevCandlesCount       = 5;   // Number of previous bars, for which the current bar should be an extremum
input int      iVolatilityPercent      = 100; // Correlation of a signal candle with a previous volatility, %
input int      iMAPeriod               = 10;  // Period of a simple signal moving average
//+------------------------------------------------------------------+
//| Class definition                                                 |
//+------------------------------------------------------------------+
class CPivotCandlesClass
  {
private:
   MqlRates          m_candles[];              // Array for storing the history necessary for calculations
   int               m_history_depth;          // Array length for storing the history
   int               m_handled_candles_count;  // Number of the already processed candles

   double            m_ma_value;               // Current calculated moving average value
   double            m_prev_ma_value;          // Previous calculated moving average value
   bool              m_is_highest;             // Check if the current candle is the highest one
   bool              m_is_lowest;              // Check if the current candle is the lowest one
   double            m_volatility;             // Average volatility
   int               m_candle_pattern;         // Current recognized pattern

   void              PrepareArrayForNewCandle();        // Prepare the array for accepting the new candle
   int               CheckCandleSize(MqlRates &candle); // Check the candle for conformity with patterns
   void              PrepareCalculation();
protected:
   int               DoAnalizeNewCandle();              // Calculation function
public:
   void              CPivotCandlesClass();

   void              CleanupHistory();                  // Clean up all calculation variables
   double            MAValue() {return m_ma_value;}     // Current value of the moving average
   int               AnalizeNewCandle(MqlRates& candle);
   int               AnalizeNewCandle( const datetime time,
                                       const double open,
                                       const double high,
                                       const double low,
                                       const double close,
                                       const long tick_volume,
                                       const long volume,
                                       const int spread );
  };
//+------------------------------------------------------------------+
//| CPivotCandlesClass                                               |
//+------------------------------------------------------------------+
//| Class initialization                                             |
//+------------------------------------------------------------------+
void CPivotCandlesClass::CPivotCandlesClass()
  {
   // History depth should be enough for all calculations
   m_history_depth = (int)MathMax(MathMax(
      iVolatilityCandlesCount + 1, iPrevCandlesCount + 1), iMAPeriod);
   m_handled_candles_count = 0;
   m_prev_ma_value = 0;
   m_ma_value = 0;

   ArrayResize(m_candles, m_history_depth);
  }
//+------------------------------------------------------------------+
//| CleanupHistory                                                   |
//+------------------------------------------------------------------+
//| Clean up the candle buffer for recalculation                     |
//+------------------------------------------------------------------+
void CPivotCandlesClass::CleanupHistory()
  {
   // Clean up the array
   ArrayFree(m_candles);
   ArrayResize(m_candles, m_history_depth);

   // Null calculation variables
   m_handled_candles_count = 0;
   m_prev_ma_value = 0;
   m_ma_value = 0;
  }
//+-------------------------------------------------------------------+
//| AnalizeNewCandle                                                  |
//+-------------------------------------------------------------------+
//| Preparations for analyzing the new candle and the analysis itself |
//| based on candle's separate parameter values                       |
//+-------------------------------------------------------------------+
int CPivotCandlesClass::AnalizeNewCandle( const datetime time,
                                          const double open,
                                          const double high,
                                          const double low,
                                          const double close,
                                          const long tick_volume,
                                          const long volume,
                                          const int spread )
  {
   // Prepare the array for the new candle
   PrepareArrayForNewCandle();

   // Fill out the current value of the candle
   m_candles[0].time          = time;
   m_candles[0].open          = open;
   m_candles[0].high          = high;
   m_candles[0].low           = low;
   m_candles[0].close         = close;
   m_candles[0].tick_volume   = tick_volume;
   m_candles[0].real_volume   = volume;
   m_candles[0].spread        = spread;

   // Check if there is enough data for calculation
   if (m_handled_candles_count < m_history_depth)
      return 0;
   else
      return DoAnalizeNewCandle();
  }
//+-------------------------------------------------------------------+
//| AnalizeNewCandle                                                  |
//+-------------------------------------------------------------------+
//| Preparations for analyzing the new candle and the analysis itself |
//| based on the received candle                                      |
//+-------------------------------------------------------------------+
int CPivotCandlesClass::AnalizeNewCandle(MqlRates& candle)
  {
   // Prepare the array for the new candle
   PrepareArrayForNewCandle();

   // Add the candle
   m_candles[0] = candle;

   // Check if there is enough data for calculation
   if (m_handled_candles_count < m_history_depth)
      return 0;
   else
      return DoAnalizeNewCandle();
  }
//+------------------------------------------------------------------+
//| PrepareArrayForNewCandle                                         |
//+------------------------------------------------------------------+
//| Prepare the array for the new candle                             |
//+------------------------------------------------------------------+
void CPivotCandlesClass::PrepareArrayForNewCandle()
  {
   // Shift the array by one position to write the new value there
   ArrayCopy(m_candles, m_candles, 1, 0, m_history_depth-1);

   // Increase the counter of added candles
   m_handled_candles_count++;
  }
//+------------------------------------------------------------------+
//| CalcMAValue                                                      |
//+------------------------------------------------------------------+
//| Calculate the current values of the Moving Average, volatility   |
//|   and the value extremality                                      |
//+------------------------------------------------------------------+
void CPivotCandlesClass::PrepareCalculation()
  {
   // Store the previous value
   m_prev_ma_value = m_ma_value;
   m_ma_value = 0;

   m_is_highest = true;  // check if the current candle is the highest one
   m_is_lowest = true;     // check if the current candle is the lowest one
   m_volatility = 0;    // average volatility

   double price_sum = 0; // Variable for storing the sum
   for (int i=0; i<m_history_depth; i++)
     {
      if (i<iMAPeriod)
         price_sum += m_candles[i].close;
      if (i>0 && i<=iVolatilityCandlesCount)
         m_volatility += m_candles[i].high - m_candles[i].low;
      if (i>0 && i<=iPrevCandlesCount)
        {
         m_is_highest = m_is_highest && (m_candles[0].high > m_candles[i].high);
         m_is_lowest = m_is_lowest && (m_candles[0].low < m_candles[i].low);
        }
     }
   m_ma_value = price_sum / iMAPeriod;
   m_volatility /= iVolatilityCandlesCount;

   m_candle_pattern = CheckCandleSize(m_candles[0]);
  }
//+------------------------------------------------------------------+
//| CheckCandleSize                                                  |
//+------------------------------------------------------------------+
//| Check if the candle sizes comply with the patterns               |
//| The function returns:                                            |
//|   0 - if the candle does not comply with the patterns            |
//|   1 - if "hammer" pattern is detected                            |
//|   -1 - if "shooting star" pattern is detected                    |
//+------------------------------------------------------------------+
int CPivotCandlesClass::CheckCandleSize(MqlRates &candle)
  {
   double candle_height=candle.high-candle.low;          // candle's full height
   double candle_body=MathAbs(candle.close-candle.open); // candle's body height

   // Check if the candle has a small body
   if(candle_body/candle_height*100.0>iMaxBodySize)
      return 0;

   double candle_top_shadow=candle.high-MathMax(candle.open,candle.close);   // candle upper shadow height
   double candle_bottom_shadow=MathMin(candle.open,candle.close)-candle.low; // candle bottom shadow height

   // If the upper shadow is very small, that indicates the "hammer" pattern
   if(candle_top_shadow/candle_height*100.0<=iMaxShadowSize)
      return 1;
   // If the bottom shadow is very small, that indicates the "shooting star" pattern
   else if(candle_bottom_shadow/candle_height*100.0<=iMaxShadowSize)
      return -1;
   else
      return 0;
  }
//+------------------------------------------------------------------+
//| DoAnalizeNewCandle                                               |
//+------------------------------------------------------------------+
//| Real analysis of compliance with the patterns                    |
//+------------------------------------------------------------------+
int CPivotCandlesClass::DoAnalizeNewCandle()
  {
   // Prepare data for analyzing the current situation
   PrepareCalculation();

   // Process prepared data and set the exit signal
   int signal = 0;

   ///////////////////////////////////////////////////////////////////
   // EXIT SIGNALS                                                  //
   ///////////////////////////////////////////////////////////////////
   // If price crosses the moving average downwards, short position is closed
   if(m_candles[1].close > m_prev_ma_value && m_candles[0].close < m_ma_value)
      signal = 2;
   // If price crosses the moving average upwards, long position is closed
   else if (m_candles[1].close < m_prev_ma_value && m_candles[0].close > m_ma_value)
      signal = -2;

   ///////////////////////////////////////////////////////////////////
   // ENTRY SIGNALS                                                 //
   ///////////////////////////////////////////////////////////////////
   // Check if the minimum volatility condition is met
   if (m_candles[0].high - m_candles[0].low >= iVolatilityPercent / 100.0 * m_volatility)
     {
      // Checks for "shooting star" pattern
      if (m_candle_pattern < 0 && m_is_highest && m_candles[0].close > m_ma_value)
         signal = -1;
      // Checks for "hammer" pattern
      else if (m_candle_pattern > 0 && m_is_lowest && m_candles[0].close < m_ma_value)
         signal = 1;
     }

   return signal;
  }
//+------------------------------------------------------------------+
計算部分はすべて CPivotCandlesClass クラスによって行われます。よいプログラムとみなされるのは、計算部分がビジュアルから分離されているもので、私はできるだけこの推奨に従おうとしています。そのメリットはすぐに得られます。以下はインディケータ自体のコードです。
//+------------------------------------------------------------------+
//|                                                 PivotCandles.mq5 |
//|                        Copyright 2012, MetaQuotes Software Corp. |
//|                                              http://www.mql5.com |
//+------------------------------------------------------------------+
#property copyright "Copyright 2012, MetaQuotes Software Corp."
#property link      "http://www.mql5.com"
#property version   "1.00"
#property indicator_chart_window

// Use four buffers, while drawing two
#property indicator_buffers 4
#property indicator_plots   2
//--- plot SlowMA
#property indicator_label1  "SlowMA"
#property indicator_type1   DRAW_LINE
#property indicator_color1  clrAliceBlue
#property indicator_style1  STYLE_SOLID
#property indicator_width1  1
//--- plot ChartSignal
#property indicator_label2  "ChartSignal"
#property indicator_type2   DRAW_COLOR_ARROW
#property indicator_color2  clrLightSalmon,clrOrangeRed,clrBlack,clrSteelBlue,clrLightBlue
#property indicator_style2  STYLE_SOLID
#property indicator_width2  3

#include <PivotCandlesClass.mqh>
//+------------------------------------------------------------------+
//| Common arrays and structures                                     |
//+------------------------------------------------------------------+
//--- Indicator buffers
double   SMA[];            // Values of the Moving Average
double   Signal[];         // Signal values
double   ChartSignal[];    // Location of signals on the chart
double   SignalColor[];    // Signal color array
//--- Calculation class
CPivotCandlesClass PivotCandlesClass;
//+------------------------------------------------------------------+
//| Custom indicator initialization function                         |
//+------------------------------------------------------------------+
int OnInit()
  {
//--- indicator buffers mapping
   SetIndexBuffer(0,SMA,INDICATOR_DATA);
   SetIndexBuffer(1,ChartSignal,INDICATOR_DATA);
   SetIndexBuffer(2,SignalColor,INDICATOR_COLOR_INDEX);
   SetIndexBuffer(3,Signal,INDICATOR_CALCULATIONS);

//--- set 0 as an empty value
   PlotIndexSetDouble(1,PLOT_EMPTY_VALUE,0);

   return(0);
  }
//+------------------------------------------------------------------+
//| Custom indicator iteration function                              |
//+------------------------------------------------------------------+
int OnCalculate(const int rates_total,
                const int prev_calculated,
                const datetime &time[],
                const double &open[],
                const double &high[],
                const double &low[],
                const double &close[],
                const long &tick_volume[],
                const long &volume[],
                const int &spread[])
  {
   // If there have not been calculations yet or (!) the new history is uploaded, clean up the calculation object
   if (prev_calculated == 0)
      PivotCandlesClass.CleanupHistory();

   int end_calc_edge = rates_total-1;
   if (prev_calculated >= end_calc_edge)
      return end_calc_edge;

   for(int i=prev_calculated; i<end_calc_edge; i++)
     {
      int signal = PivotCandlesClass.AnalizeNewCandle(time[i],open[i],high[i],low[i],close[i],tick_volume[i],volume[i],spread[i]);
      Signal[i] = signal;
      SMA[i] = PivotCandlesClass.MAValue();

      // Signals are processed, display them on the chart
      // Set the location of our signals...
      if (signal < 0)
         ChartSignal[i]=high[i];
      else if (signal > 0)
         ChartSignal[i]=low[i];
      else
         ChartSignal[i]=0;
      // .. as well as their color
      // Signals have a range of [-2..2], while color indices - [0..4]. Align them
      SignalColor[i]=signal+2;
     }

   // Set the Moving Average value similar to the previous one to prevent it from sharp fall
   SMA[end_calc_edge] = SMA[end_calc_edge-1];

//--- return value of prev_calculated for next call
   return(end_calc_edge);
  }
//+------------------------------------------------------------------+
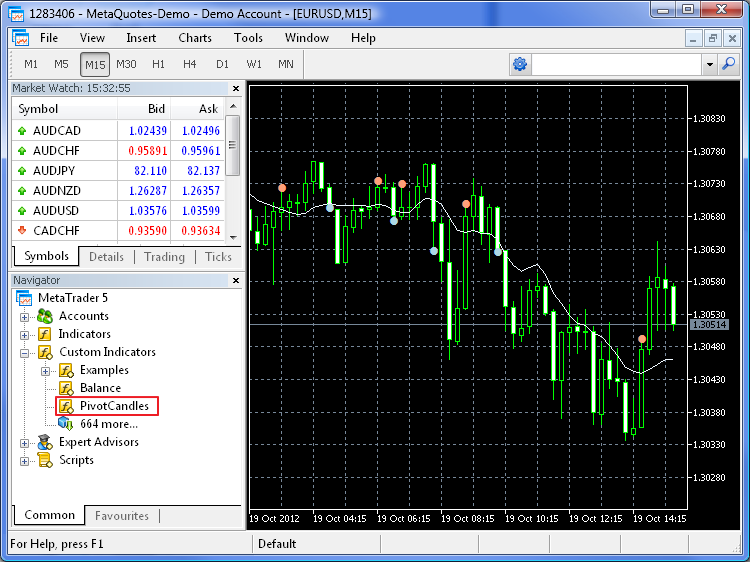
インディケータはできました。これからチャート上でそれを検証します。このために、コンパイルされたインディケータをチャート上にインストールします。その後、以下の画像に示されるようなものが表示されます。

図2 ろうそく足パターン『ハンマー』と『流れ星』のインディケータ
色付でマークされている点は可能なマーケットへの参入と終了です。色は次のように選ばれています。
- 暗い赤-売り
- 暗い青-買い
- 薄い赤-ロングポジションの終了
- 薄い青-ショートポジションの終了
終了シグナルは価格が移動平均に達したとき毎回作成されます。そのときポジションがなければこのシグナルは無視されます。
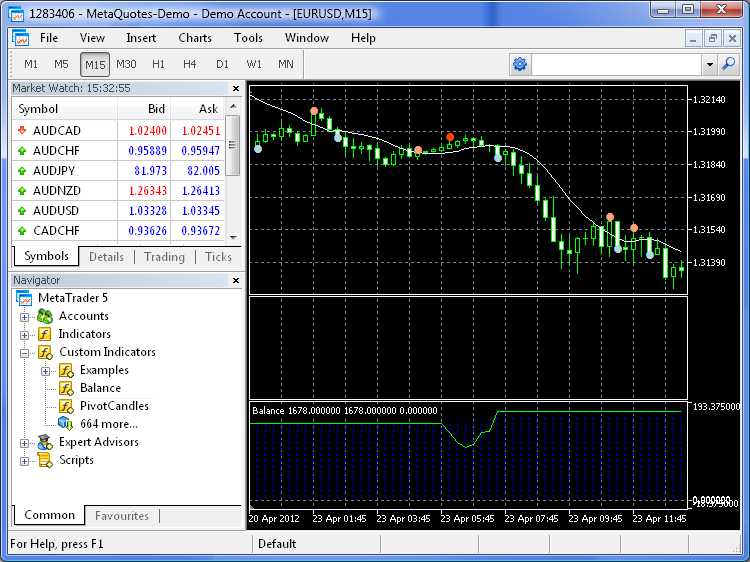
それでは本稿のメインのトピックに移ります。いくつか特定シグナルのみを作成するシグナルバッファを持つインディケータを取得します。実際に追いかければこれらシグナルがどれほど収益性があるか/損失を生じるか同じチャートの個別ウィンドウに表示します。インディケータはそのような場合のために特別に作成されました。それはもう一つ別のインディケータに連携し、受け取られるシグナルに応じて実質上のポジションをオープン/クローズすることができます。
そしてここでも前のインディケータのように、コードをに分割する必要があります。すなわち計算するコードおよび表示するコードです。以下は徹夜の成果ですが、徹夜した価値があることを願っています。:)
//+------------------------------------------------------------------+
//|                                                 BalanceClass.mqh |
//|                        Copyright 2012, MetaQuotes Software Corp. |
//|                                              http://www.mql5.com |
//+------------------------------------------------------------------+
#property copyright "Copyright 2012, MetaQuotes Software Corp."
#property link      "http://www.mql5.com"
//+------------------------------------------------------------------+
//| Common structures                                                |
//+------------------------------------------------------------------+
// Structure for returning calculation results
// using only return command;
struct BalanceResults
  {
   double balance;
   double equity;
  };
//+------------------------------------------------------------------+
//| Common function                                                  |
//+------------------------------------------------------------------+
//  Function for searching for the indicator handle by its name
int FindIndicatorHandle(string _name)
  {
   // Receive the number of open charts
   int windowsCount = (int)ChartGetInteger(0,CHART_WINDOWS_TOTAL);

   // Search all of them
   for(int w=windowsCount-1; w>=0; w--)
     {
      // How many indicators are attached to the current chart
      int indicatorsCount = ChartIndicatorsTotal(0,w);

      // Search by all chart indicators
      for(int i=0;i<indicatorsCount;i++)
        {
         string name = ChartIndicatorName(0,w,i);
         // If such an indicator is found, return its handle
         if (name == _name)
            return ChartIndicatorGet(0,w,name);
        }
     }

   // If there is no such an indicator, return the incorrect handle
   return -1;
  }
//+------------------------------------------------------------------+
//| Base calculation class                                           |
//+------------------------------------------------------------------+
class CBaseBalanceCalculator
  {
private:
   double            m_position_volume; // Current open position volume
   double            m_position_price;  // Position opening price
   double            m_symbol_points;   // Value of one point for the current symbol
   BalanceResults    m_results;         // Calculation results
public:
   void              CBaseBalanceCalculator(string symbol_name = "");
   void              Cleanup();
   BalanceResults    Calculate( const double _prev_balance,
                                const int    _signal,
                                const double _next_open,
                                const double _next_spread );
  };
//+------------------------------------------------------------------+
//| CBaseBalanceCalculator                                           |
//+------------------------------------------------------------------+
void CBaseBalanceCalculator::CBaseBalanceCalculator(string symbol_name = "")
  {
   // Clean up state variables
   Cleanup();

   // Define point size (because we will calculate the profit in points)
   if (symbol_name == "")
      m_symbol_points = SymbolInfoDouble(Symbol(), SYMBOL_POINT);
   else
      m_symbol_points = SymbolInfoDouble(symbol_name, SYMBOL_POINT);
  }
//+------------------------------------------------------------------+
//| Cleanup                                                          |
//+------------------------------------------------------------------+
//| Clean up data on positions and prices                            |
//+------------------------------------------------------------------+
void CBaseBalanceCalculator::Cleanup()
  {
   m_position_volume = 0;
   m_position_price = 0;
  }
//+------------------------------------------------------------------+
//| Calculate                                                        |
//+------------------------------------------------------------------+
//| Main calculation block                                           |
//+------------------------------------------------------------------+
BalanceResults CBaseBalanceCalculator::Calculate(
                                       const double _prev_balance,
                                       const int _signal,
                                       const double _next_open,
                                       const double _next_spread )
  {
   // Clean up the output structure from the previous values
   ZeroMemory(m_results);

   // Initialize additional variables
   double current_price = 0; // current price (bid or ask depending on position direction)
   double profit = 0;        // profit calculated value

   // If there was no signal, the balance remains the same
   if (_signal == 0)
      m_results.balance = _prev_balance;
   // the signal coincides with the direction or no positions are opened yet
   else if (_signal * m_position_volume >= 0)
     {
      // Position already exists, the signal is ignored
      if (m_position_volume != 0)
         // Balance is not changed
         m_results.balance = _prev_balance;
      // No positions yet, buy signal

      else if (_signal == 1)
        {
         // Calculate current ASK price, recalculate price, volume and balance
         current_price = _next_open + _next_spread * m_symbol_points;
         m_position_price = (m_position_volume * m_position_price + current_price) / (m_position_volume + 1);
         m_position_volume = m_position_volume + 1;
         m_results.balance = _prev_balance;
        }
      // No positions yet, sell signal
      else if (_signal == -1)
        {
         // Calculate current BID price, recalculate price, volume and balance
         current_price = _next_open;
         m_position_price = (-m_position_volume * m_position_price + current_price) / (-m_position_volume + 1);
         m_position_volume = m_position_volume - 1;
         m_results.balance = _prev_balance;
        }
      else
         m_results.balance = _prev_balance;
     }
   // Position is set already, the opposite direction signal is received
   else
     {
      // buy signal/close sell position
      if (_signal > 0)
        {
         // Close position by ASK price, recalculate profit and balance
         current_price = _next_open + _next_spread * m_symbol_points;
         profit = (current_price - m_position_price) / m_symbol_points * m_position_volume;
         m_results.balance = _prev_balance + profit;

         // If there is a signal for opening a new position, open it at once
         if (_signal == 1)
           {
            m_position_price = current_price;
            m_position_volume = 1;
           }
         else
            m_position_volume = 0;
        }
      // sell signal/close buy position
      else
        {
         // Close position by BID price, recalculate profit and balance
         current_price = _next_open;
         profit = (current_price - m_position_price) / m_symbol_points * m_position_volume;
         m_results.balance = _prev_balance + profit;

         // If there is a signal for opening a new position, open it at once
         if (_signal == -1)
           {
            m_position_price = current_price;
            m_position_volume = -1;
           }
         else
           m_position_volume = 0;
        }
     }

   // Calculate the current equity
   if (m_position_volume > 0)
     {
      current_price = _next_open;
      profit = (current_price - m_position_price) / m_symbol_points * m_position_volume;
      m_results.equity = m_results.balance + profit;
     }
   else if (m_position_volume < 0)
     {
      current_price = _next_open + _next_spread * m_symbol_points;
      profit = (current_price - m_position_price) / m_symbol_points * m_position_volume;
      m_results.equity = m_results.balance + profit;
     }
   else
      m_results.equity = m_results.balance;

   return m_results;
  }
//+------------------------------------------------------------------+
計算クラスはできました。それではどのように動作するか確認するためインディケータ表示を実装します。
//+------------------------------------------------------------------+
//|                                                      Balance.mq5 |
//|                        Copyright 2012, MetaQuotes Software Corp. |
//|                                              http://www.mql5.com |
//+------------------------------------------------------------------+
#property copyright "Copyright 2012, MetaQuotes Software Corp."
#property link      "http://www.mql5.com"
#property version   "1.00"
#property indicator_separate_window

#property indicator_buffers 4
#property indicator_plots   3
#property indicator_level1  0.0
#property indicator_levelcolor Silver
#property indicator_levelstyle STYLE_DOT
#property indicator_levelwidth 1
//--- plot Balance
#property indicator_label1  "Balance"
#property indicator_type1   DRAW_COLOR_HISTOGRAM
#property indicator_color1  clrBlue,clrRed
#property indicator_style1  STYLE_DOT
#property indicator_width1  1
//--- plot Equity
#property indicator_label2  "Equity"
#property indicator_type2   DRAW_LINE
#property indicator_color2  clrLime
#property indicator_style2  STYLE_SOLID
#property indicator_width2  1
//--- plot Zero
#property indicator_label3  "Zero"
#property indicator_type3   DRAW_LINE
#property indicator_color3  clrGray
#property indicator_style3  STYLE_DOT
#property indicator_width3  1

#include <BalanceClass.mqh>
//+------------------------------------------------------------------+
//| Input and global variables                                       |
//+------------------------------------------------------------------+
input string   iParentName        = "";             // Indicator name for balance calculation
input int      iSignalBufferIndex = -1;            // Signal buffer's index number
input datetime iStartTime         = D'01.01.2012';  // Calculation start date
input datetime iEndTime           = 0;             // Calculation end date
//--- Indicator buffers
double   Balance[];       // Balance values
double   BalanceColor[];  // Color index for drawing the balance
double   Equity[];        // Equity values
double   Zero[];          // Zero value for histogram's correct display
//--- Global variables
double   Signal[1];       // Array for receiving the current signal
int      parent_handle;   // Indicator handle, the signals of which are to be used

CBaseBalanceCalculator calculator; // Object for calculating balance and equity
//+------------------------------------------------------------------+
//| Custom indicator initialization function                         |
//+------------------------------------------------------------------+
int OnInit()
  {
   // Binding indicator buffers
   SetIndexBuffer(0,Balance,INDICATOR_DATA);
   SetIndexBuffer(1,BalanceColor,INDICATOR_COLOR_INDEX);
   SetIndexBuffer(2,Equity,INDICATOR_DATA);
   SetIndexBuffer(3,Zero,INDICATOR_DATA);

   // Search for indicator handle by its name
   parent_handle = FindIndicatorHandle(iParentName);
   if (parent_handle < 0)
     {
      Print("Error! Parent indicator not found");
      return -1;
     }

   return(0);
  }
//+------------------------------------------------------------------+
//| Custom indicator iteration function                              |
//+------------------------------------------------------------------+
int OnCalculate(const int rates_total,
                const int prev_calculated,
                const datetime &time[],
                const double &open[],
                const double &high[],
                const double &low[],
                const double &close[],
                const long &tick_volume[],
                const long &volume[],
                const int &spread[])
  {
   // Set the borders for calculating the indicator
   int start_index = prev_calculated;
   int end_index = rates_total-1;

   // Calculate balance and equity values
   for(int i=start_index; i<end_index; i++)
     {
      // Check if the balance calculation corresponds the interval
      if (time[i] < iStartTime)
        {
         Balance[i] = 0;
         Equity[i] = 0;
         continue;
        }
      if (time[i] > iEndTime && iEndTime != 0)
        {
         Equity[i] = (i==0) ? 0 : Equity[i-1];
         Balance[i] = Equity[i];
         continue;
        }

      // Request a signal from the parent indicator
      if(CopyBuffer(parent_handle,iSignalBufferIndex,time[i],1,Signal)==-1) // Copy the indicator main line data
        {
         Print("Data copy error: " + IntegerToString(GetLastError()));
         return(0);  // Finish the function operation and send indicator for the full recalculation
        }

      // Initialize balance and equity calculation
      // Since the signal is formed when the candle is closing, we will be able
      //   to perform any operation only at the next candle's opening price
      BalanceResults results = calculator.Calculate(i==0?0:Balance[i-1], (int)Signal[0], open[i+1], spread[1+1]);

      // Fill out all indicator buffers
      Balance[i] = results.balance;
      Equity[i] = results.equity;
      Zero[i] = 0;
      if (Balance[i] >= 0)
         BalanceColor[i] = 0;
      else
         BalanceColor[i] = 1;
     }

   // Fill out buffers for the last candle
   Balance[end_index] = Balance[end_index-1];
   Equity[end_index] = Equity[end_index-1];
   BalanceColor[end_index] = BalanceColor[end_index-1];
   Zero[end_index] = 0;

   return rates_total;
  }
//+------------------------------------------------------------------+
ついに完成です!コンパイルして結果を検証します。
使用説明
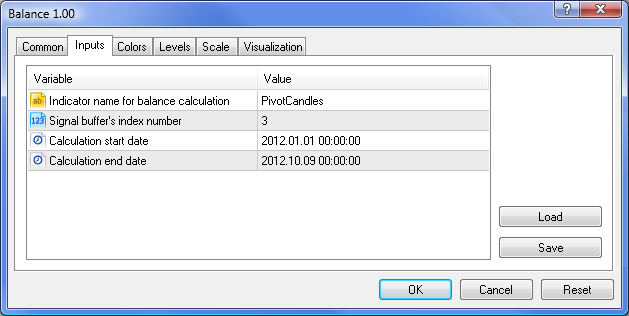
新たに作成したインディケータの処理を評価するために、最低シグナルインディケータを1個は持つチャートにアタッチする必要があります。全ステップに従うと、すでにそのようなインディケータ:PivotCandles は入手済みのはずです。そこで入力パラメータを構成する必要があります。指定が必要なものは何か見ます。
- 残高計算用インディケータ名(文字列)-残高インディケータのバインディングは名前によって行われることを忘れないようにします。よってこのフィールドは必須です。
- シグナルバッファのインデックス数(整数)-もうひとつの重要なパラメータ。シグナルインディケータは前に定義されたアルゴリズムに従い複数のシグナルを作成します。このため残高インディケータは計算するバッファのシグナルに関するデータを取得する必要があります。
- 計算開始日(日/時)-残高計算の初日 。
- 計算終了日(日/時)-残高計算の終了日 。日にちが選択されていなければ(=ゼロ)、計算は最終バーまで行われます。
図3はPivotCandles インディケータに残高インディケータをアタッチするための最初の2個のパラメータのコンフィギュレーションを示しています。残りのパラメータ2個はお好きなように設定できます。

図3 残高インディケータのパラメータ
以前のステップをすべて正しく行えば、以下の表示にひじょうに近い画像を取得します。

図4 PivotCandles インディケータシグナルを用いて作成される残高および資金曲線
ここで異なる時間枠とシンボルで試し、もっとも収益性のある、またはもっとも損失を生むマーケット参入を見つけます。この方法はトレーディング結果に影響を与えるマーケットの相関関係を見つけるのに役立つことを付け加えておきます。
元々、同じシグナルに基づいて Expert Advisor を検証するのに費やす時間を上述の方法を用いて費やす時間と比較したいと思っていました。しかしやめにしました。というのもインディケータの計算にかかる時間は約1秒だからです。履歴をアップロードしまだアルゴリズムを作成しているティックがあっては、確かに Expert Advisor ではそのような短い時間は達成できません。
おわりに
上で述べた方法はひじょうにスピードの速いものです。その上、ポジションのオープン/クローズのシグナルを作成するインディケータの検証を明確に行います。それによりトレーダーはシグナルの分析と、単一のチャートウィンドウ内でデポジットのシグナルに対する応答を分析することができます。ただ、それにはまだ以下のような知っておくべき制約があります。
- 分析されるインディケータのシグナルバッファは事前に準備が必要である。
- シグナルは新しいバーのオープン時刻に縛られる。
- 残高計算時 ММ はない。
ただし、こういったデメリットにもかかわらず、メリットの方が多いこと、この検証方法はマーケット変動を分析しマーケットにより作成されるシグナルを処理するために作成されるその他ツールの一旦となることを願っています。
MetaQuotes Ltdによってロシア語から翻訳されました。
元の記事: https://www.mql5.com/ru/articles/505
警告: これらの資料についてのすべての権利はMetaQuotes Ltd.が保有しています。これらの資料の全部または一部の複製や再プリントは禁じられています。
この記事はサイトのユーザーによって執筆されたものであり、著者の個人的な見解を反映しています。MetaQuotes Ltdは、提示された情報の正確性や、記載されているソリューション、戦略、または推奨事項の使用によって生じたいかなる結果についても責任を負いません。
 MetaTrader 5 から MetaTrader 4へトレードをコピーする方法
 MetaTrader 5 ターミナルのストラテジーテスタ内でティック作成をするアルゴリズム
- 無料取引アプリ
- 8千を超えるシグナルをコピー
- 金融ニュースで金融マーケットを探索
ありがとう。
流れ星/ハンマー」と「チャキン・インジケーター」には、わずかな共通点がある。
ありがとうございます。
PivotCandles.mq5インジケータのOnCalculateイベントに問題があります。 open,high,low,closeの配列メンバ要素がすべて同じ値を返しています。 これは、各OHLCインデックスの[i]に同じ値が格納されています。 また、配列の最初の要素が日付として1971を報告しています。 OnCalculateに渡された配列が有効でないように見えます。
何かアイデアは ありますか?