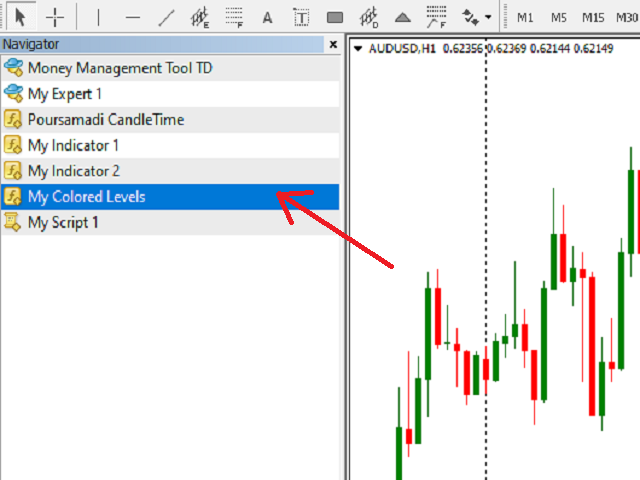
Colored Levels and Boxes
- Indicatori
- Versione: 2.0
- Aggiornato: 2 novembre 2022
- Attivazioni: 10

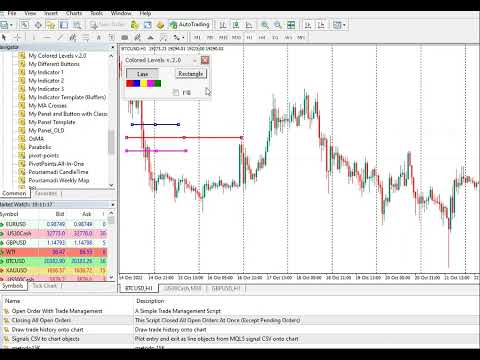
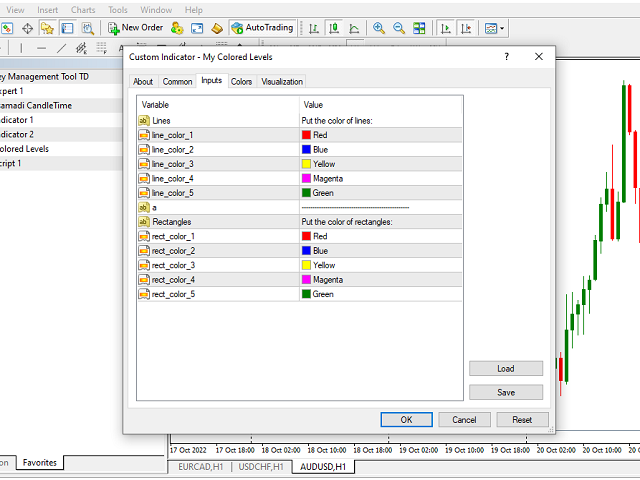
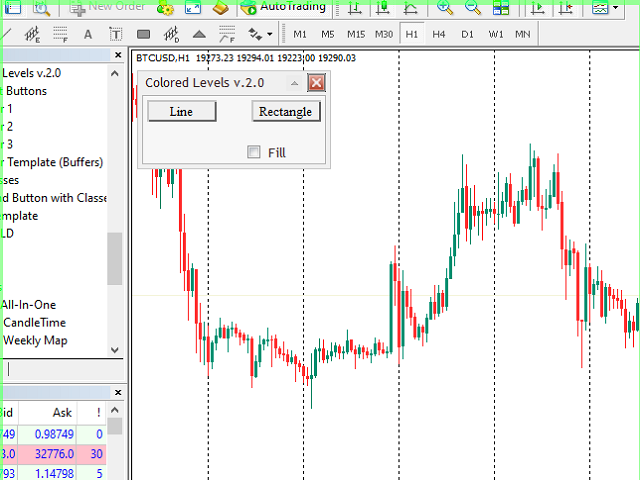
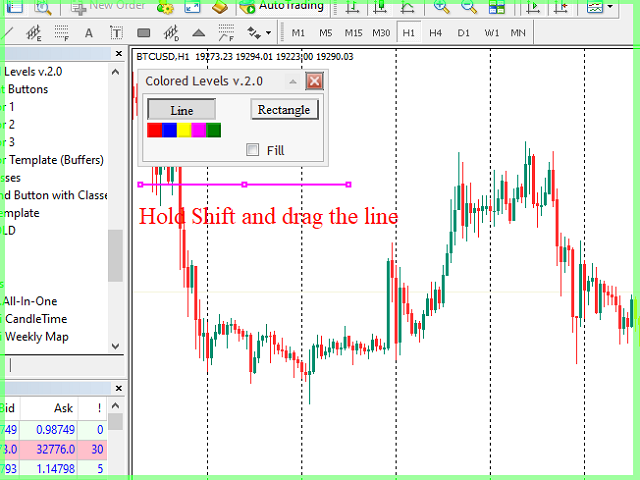
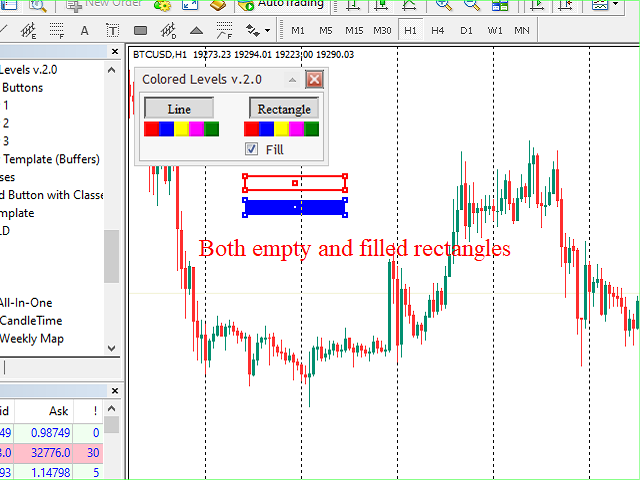
Questo strumento software è progettato per semplificare il processo di creazione di linee di tendenza orizzontali e rettangoli nella scelta di cinque colori personalizzabili.
Disegnare linee di tendenza orizzontali precise in MT5 può essere impegnativo, ma con questo indicatore puoi crearle senza sforzo nei colori che si adattano alle tue preferenze.
Inoltre, il nostro strumento fornisce una chiara visualizzazione dei livelli di prezzo associati alle linee orizzontali tracciate.
Apprezziamo il tuo feedback e speriamo che trovi questo strumento una risorsa preziosa per le tue esigenze di trading.
Non esitate a condividere i vostri pensieri con noi.