Colored Levels and Boxes
- 지표
- 버전: 2.0
- 업데이트됨: 2 11월 2022
- 활성화: 10

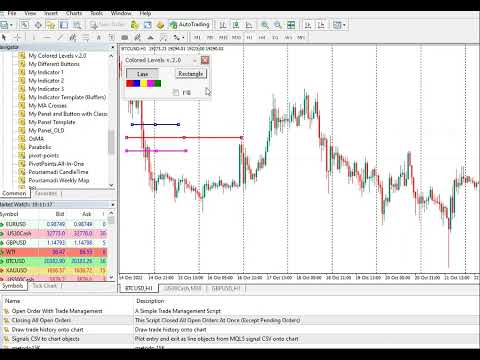
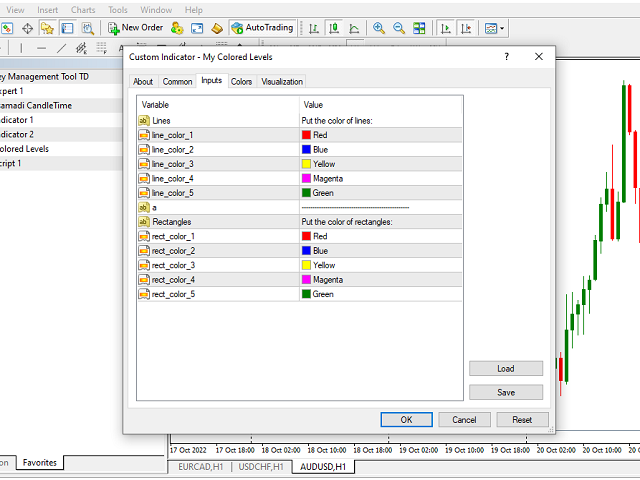
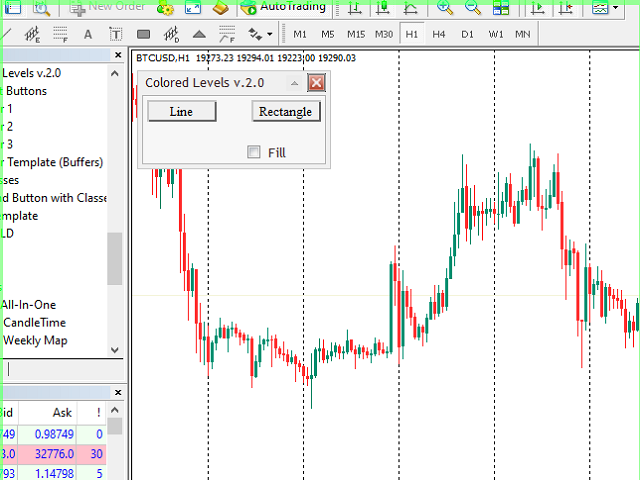
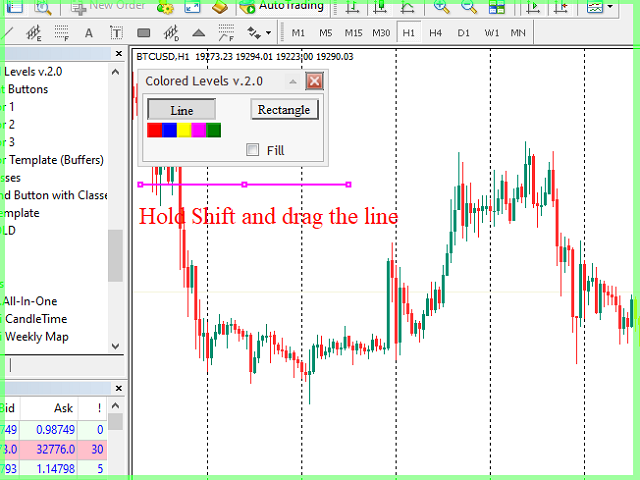
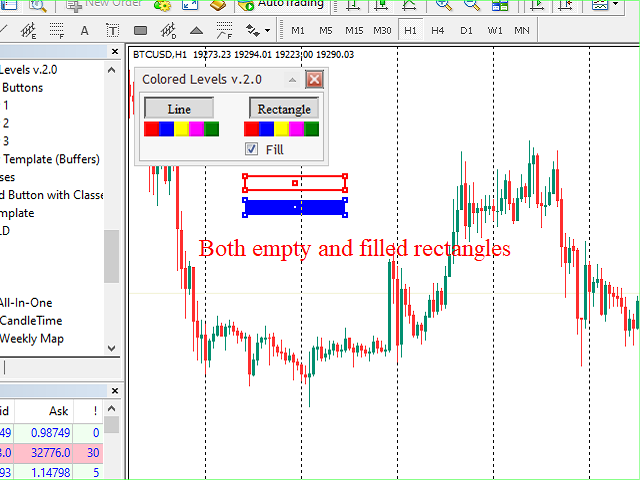
이 소프트웨어 도구는 사용자 정의 가능한 5가지 색상을 선택하여 수평 추세선과 직사각형을 생성하는 프로세스를 간소화하도록 설계되었습니다.
MT5에서 정확한 수평 추세선을 그리는 것은 어려울 수 있지만 이 지표를 사용하면 원하는 색상으로 쉽게 추세선을 만들 수 있습니다.
또한 우리 도구는 귀하가 그리는 수평선과 관련된 가격 수준을 명확하게 표시합니다.
우리는 귀하의 피드백을 소중히 여기며 이 도구가 귀하의 거래 요구에 맞는 귀중한 자산이 되기를 바랍니다.
주저하지 말고 귀하의 생각을 우리와 공유해 주십시오.
..................................................................................