KT Inside Bar MT5

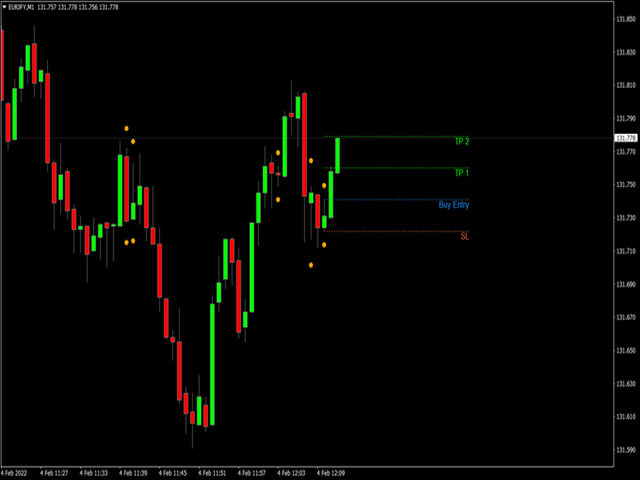
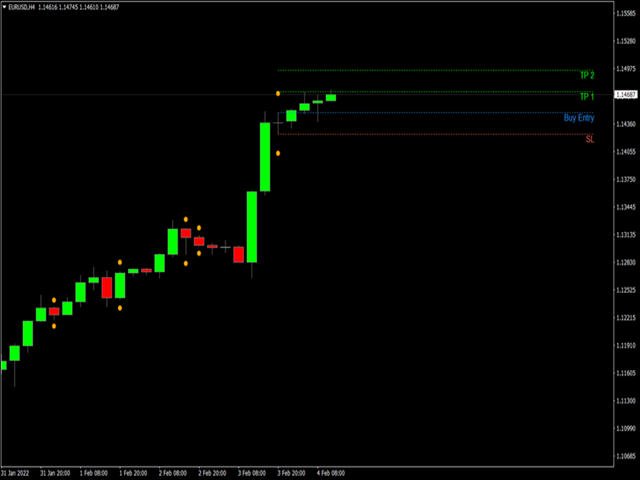
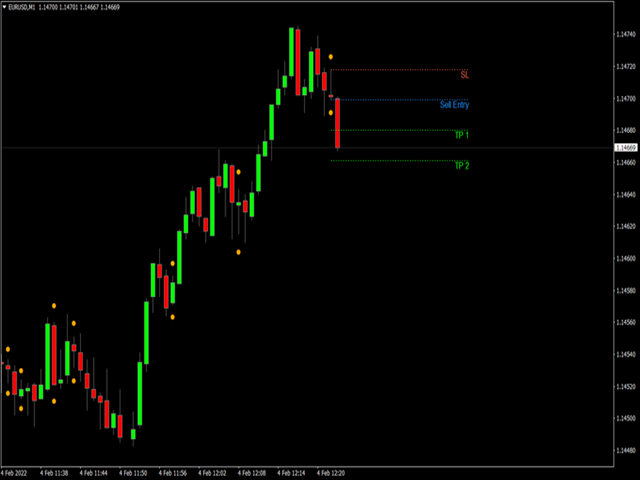
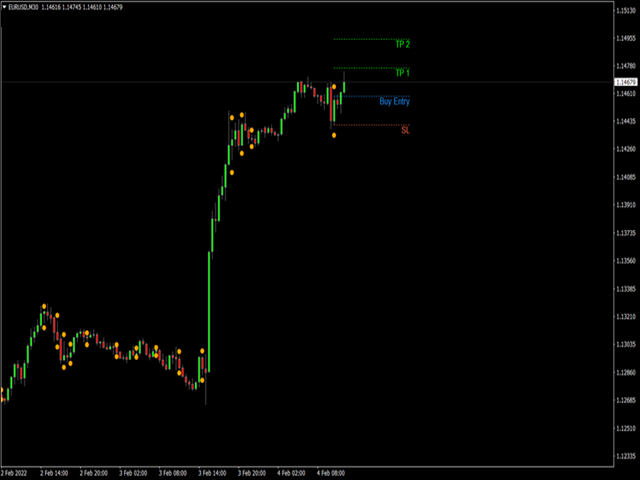
KT Inside Bar plots the famous inside bar pattern in which the bar carries a lower high and higher low compared to the previous bar. The last bar is also known as the mother bar. On smaller time-frames, the inside bar sometimes appears similar to a triangle pattern.

Features

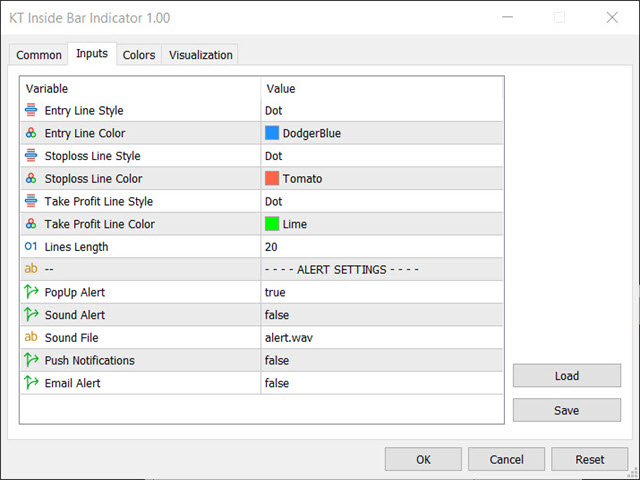
  • Also plots entry, stop-loss, and take-profit levels with the inside bar pattern.
  • No complex inputs and settings.
  • Erase unwanted levels when the price reaches the entry line in either direction.
  • All Metatrader alerts included.

How to trade with Inside Bar

Inside bars are usually traded by using pending buy and sell orders at the high or low of the previous bar(mother bar). Most of the time, the inside bar pattern provides breakout entries in the trend direction. Inside bars are generally not recommended to trade the reversals.

It also provides Stoploss and Takeprofit levels. However, veteran traders should decide the entries and targets using more detailed analysis.

Prodotti consigliati
Candlestick Pattern Teller
Flavio Javier Jarabeck
5 (1)
Minions Labs' Candlestick Pattern Teller It shows on your chart the names of the famous Candlesticks Patterns formations as soon as they are created and confirmed. No repainting. That way beginners and also professional traders who have difficulties in visually identifying candlestick patterns will have their analysis in a much easier format. Did you know that in general there are 3 types of individuals: Visual, Auditory, and Kinesthetic? Don't be ashamed if you cannot easily recognize Candlesti
Fibaction
Abdelkhalek Orabi
Indicator Name: Fibaction – price action candle Detector Description: Fibo Signal Boxes is a powerful Smart Money Concept (SMC)-inspired indicator that auto-detects price action candles. bullish hammers and shooting stars, then draws precise Fibonacci entry zones and multiple take-profit levels directly on the chart. as for the SL personally i use 40 pips rules  Key Features: Detects bullish hammer and shooting star reversal candles. Automatically draws Fibonacci entry and TP boxes. as
Girassol Sunflower MT5 Indicator
Saullo De Oliveira Pacheco
3.86 (7)
This is the famous Sunflower indicator for Metatrader5. This indicator marks possible tops and bottoms on price charts. The indicator identifies tops and bottoms in the asset's price history, keep in mind that the current sunflower of the last candle repaints, as it is not possible to identify a top until the market reverses and it is also not possible to identify a bottom without the market stop falling and start rising. If you are looking for a professional programmer for Metatrader5, please
FREE
QuantumAlert Stoch Navigator is a free indicator available for MT4/MT5 platforms, its work is to provide "alerts" when the market is inside "overbought and oversold" regions in the form of "buy or sell" signals. This indicator comes with many customization options mentioned in the parameter section below, user can customise these parameters as needful. Join our   MQL5 group , where we share important news and updates. You are also welcome to join our private channel as well, contact me for the p
FREE
Haven FVG Indicator
Maksim Tarutin
5 (8)
L'indicatore   Haven FVG   è uno strumento per l'analisi dei mercati che permette di identificare le aree di inefficienza (Fair Value Gaps, FVG) nel grafico, fornendo ai trader livelli chiave per l'analisi dei prezzi e la presa di decisioni commerciali. Altri prodotti ->  QUI Caratteristiche principali: Impostazioni dei colori individuali: Colore per FVG rialzista   (Bullish FVG Color). Colore per FVG ribassista   (Bearish FVG Color). Visualizzazione flessibile di FVG: Numero massimo di candele
FREE
Indicatore Average True Range (ATR) con supporto multi-timeframe, segnali visivi personalizzabili e sistema di alert configurabile. Servizi di programmazione freelance, aggiornamenti e altri prodotti TrueTL sono disponibili sul mio profilo MQL5 . Feedback e recensioni sono molto apprezzati! Cos'è l'ATR? L'Average True Range (ATR), sviluppato da J. Welles Wilder, è un indicatore tecnico che misura la volatilità del mercato. Calcola la media del True Range su un periodo specificato. Il True Ran
FREE
Indicatore Balance of Power (BOP) con supporto multi-timeframe, segnali visivi personalizzabili e sistema di avvisi configurabile. I servizi di programmazione freelance, gli aggiornamenti e altri prodotti TrueTL sono disponibili nel mio profilo MQL5 . Feedback e recensioni sono molto apprezzati! Cos'è il BOP? Balance of Power (BOP) è un oscillatore che misura la forza degli acquirenti rispetto ai venditori confrontando la variazione del prezzo con il range della candela. L'indicatore viene ca
FREE
Wave Box Market Frenquency
Jean Jacques Huve Ribeiro
4.75 (4)
Totally linked to the result of a movement and the duration he had. Its height records how many ticks the asset walked during a given movement, its width shows us the duration that movement had. Its configuration must be in line with the Weis Wave Indicator configuration to observe the movement force and can indicate a possible accumulation or distribution of the movement;
FREE
Tops and Bottoms Indicator
Josue De Matos Silva
4.6 (5)
Tops & Bottoms Indicator FREE   Tops abd Bottoms:   An effective indicator for your trades The tops and bottoms indicator helps you to find  ascending and descending channel formations with indications of ascending and/or descending tops and bottoms. In addition, it  show possibles  opportunities with a small yellow circle when the indicator encounters an impulse formation. This indicator provide to you  more security and speed in making entry decisions. Also test our FREE advisor indicator:  
FREE
Value Chart Candlesticks
Flavio Javier Jarabeck
4.69 (13)
The idea of a Value Chart indicator was presented in the very good book I read back in 2020 , " Dynamic Trading Indicators: Winning with Value Charts and Price Action Profile ", from the authors Mark Helweg and David Stendahl. The idea is simple and the result is pure genius: Present candlestick Price analysis in a detrended way! HOW TO READ THIS INDICATOR Look for Overbought and Oversold levels. Of course, you will need to test the settings a lot to find the "correct" one for your approach. It
FREE
FlatBreakout MT5
Aleksei Vorontsov
FlatBreakout MT5 (Free Version) Flat Range Detector and Breakout Panel for MT5 — GBPUSD Only FlatBreakout MT5   is the free version of the professional FlatBreakoutPro MT5 indicator, specially designed for flat (range) detection and breakout signals on the   GBPUSD   pair only. Perfect for traders who want to experience the unique fractal logic of FlatBreakout MT5 and test breakout signals on a live market without limitations. Who Is This Product For? For traders who prefer to trade breakout of
FREE
Donchian Breakout And Rsi
Mattia Impicciatore
5 (1)
Descrizione generale Questo indicatore è una versione avanzata del classico Donchian Channel , arricchita con funzioni operative per il trading reale. Oltre alle tre linee tipiche (massimo, minimo e linea centrale), il sistema rileva i breakout e li segnala graficamente con frecce sul grafico, mostrando solo la linea opposta alla direzione del trend per semplificare la lettura. L’indicatore include: Segnali visivi : frecce colorate al breakout Notifiche automatiche : popup, push e email Filtro R
FREE
Strong Candle Indicates the size of each candlestick with the text value above it and indicates which candlestick has a body larger than the one specified in the parameters in percentage, that is, a strong candlestick (between Size_Min and Size_Max) with at least x% of body. The candlestick size is placed in the buffer and that is the buy or sell indication, where: value > 0 = bullish candle or value < 0 bearish candle, value = 0 means no indication (the candle did not match the desired pattern
Volume Zone Fractal
Eduardo Da Costa Custodio Santos
VZO Plus è un indicatore che mostra le regioni di ipercomprato e ipervenduto in base al volume scambiato. #Quando la linea dell'indicatore è compresa tra -40 e -60 è ipervenduta #Quando la linea dell'indicatore è tra 40 e 60 è ipercomprato. Al di fuori di queste regioni, il mercato segue per inerzia il suo percorso naturale. Sopra la linea verde, significa che il mercato è positivo, Un altro modo per analizzare l'indicatore è attraverso le regioni di divergenza. Quando abbiamo il minimo più alto
Smart Money Concepts v2.2 – Market Structure Smart Money Concepts v2.2 is an advanced MetaTrader 5 indicator designed for traders who use institutional market concepts such as market structure, liquidity, and premium/discount price zones. The indicator automatically highlights key areas where price is likely to react, helping traders operate with greater context, clarity, and precision. Key Features Market Structure detection (Bullish / Bearish / Ranging) BOS (Break of Structure) & CH
KT Horizontal Lines MT5
KEENBASE SOFTWARE SOLUTIONS
Su MetaTrader, tracciare più   linee orizzontali   e monitorare i rispettivi livelli di prezzo può essere un’attività noiosa. Questo indicatore disegna automaticamente più linee orizzontali a intervalli uguali per impostare avvisi di prezzo, tracciare livelli di supporto e resistenza, e per altri usi manuali. Questo indicatore è perfetto per i trader Forex alle prime armi che cercano opportunità per ottenere profitti rapidi tramite acquisto e vendita. Le linee orizzontali aiutano a identificare
RBreaker
Zhong Long Wu
RBreaker Gold Indicators is a short-term intraday trading strategy for gold futures that combines trend following and intraday reversal approaches. It not only captures profits during trending markets but also enables timely profit-taking and counter-trend trading during market reversals. This strategy has been ranked among the top ten most profitable trading strategies by the American magazine   Futures Truth   for 15 consecutive years. It boasts a long lifecycle and remains widely used and st
WanaScalper
Isaac Wanasolo
1 (1)
A scalping indicator based on mathematical patterns, which on average gives signals with relatively small SL, and also occasionally helps to catch big moves in the markets (more information in the video) This indicator has three main types of notifications: The first type warns of a possible/upcoming signal on the next bar The second type indicates the presence of a ready signal to enter the market/open a position The third type is for SL and TP levels - you will be notified every time price re
Visual Heatmap Book Analyzer
Alexandre Moraes De Souza Lima
Visual Heatmap Book Analyser This indicator monitors the market liquidity and generates colors based on order patterns, quantities, and renewal activities in the book. This allows you to visualize the order flow and identify areas of high and low liquidity and activity. The indicator uses machine learning techniques to analyze the order behavior in the book, enabling it to detect patterns and trends in orders, allowing you to make informed decisions about your trading operations. The color pale
FX Clock
Abderrahmane Benali
FXClock – Professional Clock Indicator for Traders Please leave a 5 star rating if you like this free tool! Thank you so much :) The FXClock indicator is a practical and simple tool that displays time directly on your trading platform, allowing you to track multiple key pieces of information at the same time. It is specially designed to help traders synchronize their trading with market hours and global sessions. Key Features: Displays the broker server time with precision. Displays your local c
FREE
Swing Point BoS CHoCH Con Exp Alerts
Usiola Oluwadamilol Olagundoye
NOTE: Turn Pattern Scan ON This indicator identifies Swing Points, Break of Structure (BoS), Change of Character (CHoCH), Contraction and Expansion patterns which are plotted on the charts It also comes with Alerts & Mobile notifications so that you do not miss any trades. It can be used on all trading instruments and on all timeframes. The non-repaint feature makes it particularly useful in backtesting and developing profitable trading models. The depth can be adjusted to filter swing points.
FREE
Limitless MT5
Dmitriy Kashevich
Limitless MT5 is a universal indicator suitable for every beginner and experienced trader. works on all currency pairs, cryptocurrencies, raw stocks Limitless MT5 - already configured and does not require additional configuration And now the main thing Why Limitless MT5? 1 complete lack of redrawing 2 two years of testing by the best specialists in trading 3 the accuracy of correct signals exceeds 80% 4 performed well in trading during news releases Trading rules 1 buy signal - the ap
Smart Wave Trend Analyzer Analizzatore Intelligente di Tendenze ad Onde Un sistema avanzato di rilevamento delle tendenze che identifica e traccia automaticamente linee di tendenza di alta qualità basate sull'analisi delle onde e sui pattern frattali. MT4-version:  https://www.mql5.com/en/market/product/164395 Componenti Principali: 1. LINEE PRINCIPALI (Blu/Rosso, Spesse) Tendenza a lungo termine basata sull'incrocio di SMA(70) e LWMA(10) Identifica i principali picchi e minimi nel movimento de
HLC bar MT5 Wyckoff
Eduardo Da Costa Custodio Santos
L'indicatore "HLC_bar_MT5 Wyckoff" per MT5 è stato creato per facilitare l'analisi al momento del trading. La barra HLC è stata utilizzata da Richard Wyckoff ed è attualmente ampiamente utilizzata nelle operazioni "VSA". Wyckoff ha scoperto che l'utilizzo di High, Low e Close ha reso il grafico molto più pulito e più facile da analizzare. L'indicatore "HLC_bar_MT5 Wyckoff" consente: # Cambia la larghezza della barra; # Lascia la barra dello stesso colore; # Ed evidenzia la barra che si è aperta
ZigZag with Fibonacci
Rafael Caetano Pinto
This indicator uses the metaquotes ZigZag indicator as base to plot fibonacci extension and fibonacci retracement based in the Elliot waves. A fibonacci retracement will be plotted on every wave draw by the ZigZag. A fibonacci extension will be plotted only after the 2nd wave. Both fibonacci will be updated over the same wave tendency. Supporting until 9 consecutive elliot waves. Parameters: Depth: How much the algorithm will iterate to find the lowest and highest candles Deviation: Amount of
Statistical Arbitrage Spread Generator for Cointegration [MT5] What is Pair Trading? Pair trading is a market-neutral strategy that looks to exploit the relative price movement between two correlated assets — instead of betting on the direction of the market. The idea? When two assets that usually move together diverge beyond a statistically significant threshold, one is likely mispriced. You sell the expensive one, buy the cheap one , and profit when they converge again. It’s a statistica
FREE
RangeXpert
Steve Rosenstock
5 (5)
CLICCA QUI PER VEDERE TUTTI I MIEI PRODOTTI GRATUITI Quando si tratta di riconoscere opportunità di mercato perfette e tradare i breakout con precisione, RangeXpert è uno degli strumenti più efficaci sul mercato. Sviluppato da me specificamente per principianti e semi-professionisti, offre una qualità di analisi che solitamente si trova solo negli strumenti professionali utilizzati da banche, trader istituzionali e hedge fund . L’indicatore identifica aree di mercato che spesso portano a forti
FREE
VolumeBasedColorsBars
Henrique Magalhaes Lopes
VolumeBasedColorsBars — Free Powerful Volume Analysis for All Traders Unlock the hidden story behind every price bar! VolumeBasedColorsBars is a professional-grade, 100% FREE indicator that colorizes your chart candles based on real, adaptive volume analysis. Instantly spot surges in market activity, identify exhaustion, and catch the moves that matter. This indicator gives you:    • Dynamic color-coded bars for instant volume context    • Adaptive thresholds based on historical, session-awar
FREE
Higher High Lower Low MT5
KEENBASE SOFTWARE SOLUTIONS
5 (1)
KT Higher High Lower Low segna i seguenti punti di swing con i rispettivi livelli di supporto e resistenza: Higher High: Un massimo superiore rispetto al massimo precedente. Lower High: Un massimo inferiore rispetto al massimo precedente. Lower Low: Un minimo inferiore rispetto al minimo precedente.  Higher Low: Un minimo superiore rispetto al minimo precedente.   Caratteristiche L'intensità dei massimi e minimi può essere regolata modificando il numero di barre a sinistra e a destra. Fornisce
This multi time frame and multi symbol indicator identifies high-probability breakout patterns. It does this by identifying strong, symmetrical pennants and triangles. This pattern  DOES NOT  appear very often on higher timeframes. But when it does, it is a very high-probability setup. The indicator also includes an Inside bars scanner. It can for example be used to detect a special type of Inside bars formation which is formed by a Master candle (MC) followed by 4 inside candles (please see the
Gli utenti di questo prodotto hanno anche acquistato
SuperScalp Pro
Van Minh Nguyen
5 (11)
SuperScalp Pro – Sistema avanzato di indicatore per scalping con filtri multipli SuperScalp Pro è un sistema avanzato di indicatore per scalping che combina il classico Supertrend con molteplici filtri di conferma intelligenti. L’indicatore funziona in modo efficiente su tutti i timeframe da M1 a H4 ed è particolarmente adatto per XAUUSD, BTCUSD e le principali coppie Forex. Può essere utilizzato come sistema stand-alone o integrato in modo flessibile nelle strategie di trading esistenti. L’indi
Divergence Bomber
Ihor Otkydach
4.89 (83)
Ogni acquirente dell’indicatore riceverà inoltre gratuitamente: L’utilità esclusiva “Bomber Utility”, che gestisce automaticamente ogni operazione, imposta i livelli di Stop Loss e Take Profit e chiude le posizioni secondo le regole della strategia I file di configurazione (set file) per adattare l’indicatore a diversi asset I set file per configurare il Bomber Utility in tre modalità: “Rischio Minimo”, “Rischio Bilanciato” e “Strategia di Attesa” Una guida video passo-passo per installare, conf
Azimuth Pro
Ottaviano De Cicco
5 (4)
LAUNCH PROMO Azimuth Pro price is initially set at 299$ for the first 100 buyers. Final price will be 499$ . THE DIFFERENCE BETWEEN RETAIL AND INSTITUTIONAL ENTRIES ISN'T THE INDICATOR — IT'S THE LOCATION. Most traders enter at arbitrary price levels, chasing momentum or reacting to lagging signals. Institutions wait for price to reach structured levels where supply and demand actually shift. Azimuth Pro maps these levels automatically: swing-anchored VWAP, multi-timeframe structure lines, an
Entry In The Zone and SMC Multi Timeframe is a real-time market analysis tool developed based on Smart Money Concepts (SMC). It is designed to analyze market structure, price direction, reversal points, and key zones across multiple timeframes in a systematic way. The system displays Points of Interest (POI) and real-time No Repaint signals, with instant alerts when price reaches key zones or when signals occur within those zones. It functions as both an Indicator and a Signal System (2-in-1), c
ARICoins
Temirlan Kdyrkhan
ARICoin is a powerful trading companion designed to generate high-probability entry signals with dynamic TP/SL/DP levels based on volatility. Built-in performance tracking shows win/loss stats, PP1/PP2 hits, and success rates all updated live. Key Features: Buy/Sell signals with adaptive volatility bands Real-time TP/SL/DP levels based on ATR Built-in MA Filter with optional ATR/StdDev volatility Performance stats panel (Success, Profit/Loss, PP1/PP2) Alerts via popup, sound, push, or email Cust
Se acquisti questo indicatore, riceverai il mio Trade Manager Professionale + EA  GRATUITAMENTE. Innanzitutto è importante sottolineare che questo sistema di trading è un indicatore Non-Repainting, Non-Redrawing e Non-Lagging, il che lo rende ideale sia per il trading manuale che per quello automatico. Corso online, manuale e download di preset. Il "Sistema di Trading Smart Trend MT5" è una soluzione completa pensata sia per i trader principianti che per quelli esperti. Combina oltre 10 indicat
FX Trend MT5 NG
Daniel Stein
5 (4)
FX Trend NG: La Nuova Generazione di Intelligenza di Trend Multi-Mercato Panoramica FX Trend NG è uno strumento professionale di analisi del trend multi-timeframe e monitoraggio dei mercati. Ti consente di comprendere la struttura completa del mercato in pochi secondi. Invece di passare tra numerosi grafici, puoi identificare immediatamente quali strumenti sono in trend, dove il momentum sta diminuendo e dove esiste un forte allineamento tra i timeframe. Offerta di Lancio – Ottieni FX Trend NG
Power Candles MT5
Daniel Stein
5 (6)
Power Candles – Segnali di ingresso basati sulla forza per tutti i mercati Power Candles porta l’analisi di forza collaudata di Stein Investments direttamente sul grafico dei prezzi. Invece di reagire solo al prezzo, ogni candela viene colorata in base alla reale forza di mercato, consentendo di identificare immediatamente accumuli di momentum, accelerazioni della forza e transizioni di trend pulite. Un’unica logica per tutti i mercati Power Candles funziona automaticamente su tutti i simboli di
[ My Products ] , [ My Channel ]   ,  [ LIVE SIGNAL ] HFT Spike Detector HFT Spike Detector è uno strumento professionale di monitoraggio dei tick progettato per analizzare e misurare in tempo reale i movimenti di prezzo ad alta frequenza (picchi improvvisi causati da HFT). Il suo scopo è permetterti di rilevare slippage anomalo, gap di liquidità e picchi di prezzo a livello millisecondo causati dal broker, utilizzando dati numerici. Poiché analizza il flusso di tick in tempo reale e le cond
Trend Screener Pro MT5
STE S.S.COMPANY
4.81 (103)
Indicatore di tendenza, soluzione unica rivoluzionaria per il trading di tendenze e il filtraggio con tutte le importanti funzionalità di tendenza integrate in un unico strumento! È un indicatore multi-timeframe e multi-valuta al 100% non ridipingibile che può essere utilizzato su tutti i simboli/strumenti: forex, materie prime, criptovalute, indici e azioni. Trend Screener è un indicatore di tendenza che segue un indicatore efficiente che fornisce segnali di tendenza a freccia con punti nel gra
AriX
Temirlan Kdyrkhan
1 (4)
AriX Indicator for MT5 A powerful trend-following and signal-evaluation tool AriX is a custom MT5 indicator that combines Moving Averages and ATR-based risk/reward logic to generate clear buy/sell signals. It visualizes dynamic SL/TP levels, evaluates past trade outcomes, and displays win/loss statistics in a clean on-chart panel. Key features include: Buy/Sell signals based on MA crossovers ATR-based SL/TP1/TP2/TP3 levels with visual lines and labels Signal outcome tracking with real-time stat
RFI levels PRO MT5
Roman Podpora
3.67 (3)
L'indicatore mostra accuratamente i punti di inversione e le zone di ritorno dei prezzi in cui il       Principali attori   . Vedi dove si formano le nuove tendenze e prendi decisioni con la massima precisione, mantenendo il controllo su ogni operazione. VERSION MT4     -    Rivela il suo massimo potenziale se combinato con l'indicatore   TREND LINES PRO Cosa mostra l'indicatore: Strutture di inversione e livelli di inversione con attivazione all'inizio di un nuovo trend. Visualizzazione dei li
Grabber System MT5
Ihor Otkydach
4.83 (23)
Ti presento un eccellente indicatore tecnico: Grabber, che funziona come una strategia di trading "tutto incluso", pronta all’uso. In un solo codice sono integrati strumenti potenti per l’analisi tecnica del mercato, segnali di trading (frecce), funzioni di allerta e notifiche push. Ogni acquirente di questo indicatore riceve anche gratuitamente: L’utility Grabber: per la gestione automatica degli ordini aperti Video tutorial passo dopo passo: per imparare a installare, configurare e utilizzare
Game Changer Indicator mt5
Vasiliy Strukov
4.64 (22)
Game Changer è un indicatore di tendenza rivoluzionario, progettato per essere utilizzato su qualsiasi strumento finanziario, per trasformare il tuo MetaTrader in un potente analizzatore di trend. Funziona su qualsiasi intervallo temporale e aiuta a identificare i trend, segnala potenziali inversioni, funge da meccanismo di trailing stop e fornisce avvisi in tempo reale per risposte tempestive del mercato. Che tu sia un professionista esperto o un principiante in cerca di un vantaggio, questo st
Atomic Analyst MT5
Issam Kassas
4.03 (30)
Innanzitutto, vale la pena sottolineare che questo indicatore di trading non è repaint, non è ridisegno e non presenta ritardi, il che lo rende ideale sia per il trading manuale che per quello automatico. Manuale utente: impostazioni, input e strategia. L'Analista Atomico è un indicatore di azione del prezzo PA che utilizza la forza e il momentum del prezzo per trovare un miglior vantaggio sul mercato. Dotato di filtri avanzati che aiutano a rimuovere rumori e segnali falsi, e aumentare il pote
OmniSync Projection
Antonio-alin Teculescu
5 (1)
Chronos Fractal Engine is an innovative price projection indicator for MetaTrader 5, designed to transform your technical analysis by intelligently identifying and projecting historical price patterns. Built upon an advanced correlation algorithm and the fractal principles of the market, this powerful tool visualizes potential future price movements, giving you a unique edge in your trading decisions. What is Chronos Fractal Engine? At its core, the Chronos Fractal Engine employs a sophisticat
FX Power MT5 NG
Daniel Stein
5 (31)
FX Power: Analizza la Forza delle Valute per Decisioni di Trading Più Intelligenti Panoramica FX Power è lo strumento essenziale per comprendere la reale forza delle principali valute e dell'oro in qualsiasi condizione di mercato. Identificando le valute forti da comprare e quelle deboli da vendere, FX Power semplifica le decisioni di trading e rivela opportunità ad alta probabilità. Che tu segua le tendenze o anticipi inversioni utilizzando valori estremi di Delta, questo strumento si adatta
Smart Stop Indicator – Precisione intelligente dello stop-loss direttamente sul grafico Panoramica Smart Stop Indicator è la soluzione ideale per i trader che desiderano posizionare il loro stop-loss in modo chiaro e metodico, senza dover indovinare o affidarsi all’intuizione. Questo strumento combina la logica classica del price action (massimi e minimi strutturali) con un moderno riconoscimento dei breakout per identificare il prossimo livello di stop realmente logico. In trend, in range o i
Trend Lines PRO MT5
Roman Podpora
5 (1)
LINEE DI TENDENZA PRO  Aiuta a capire dove il mercato sta realmente cambiando direzione. L'indicatore mostra reali inversioni di tendenza e punti in cui i principali operatori rientrano. Vedi   Linee BOS   Cambiamenti di tendenza e livelli chiave su timeframe più ampi, senza impostazioni complesse o rumore inutile. I segnali non vengono ridisegnati e rimangono sul grafico dopo la chiusura della barra. VERSIONE MT4   -   Svela il suo massimo potenziale se abbinato all'indicatore   RFI LEVELS PRO
Innanzitutto, vale la pena sottolineare che questo Strumento di Trading è un Indicatore Non-Ridipingente, Non-Ridisegnante e Non-Laggante, il che lo rende ideale per il trading professionale. Corso online, manuale utente e demo. L'Indicatore Smart Price Action Concepts è uno strumento molto potente sia per i nuovi che per i trader esperti. Racchiude più di 20 utili indicatori in uno solo, combinando idee di trading avanzate come l'Analisi del Trader del Circolo Interno e le Strategie di Tradin
ARIPoint
Temirlan Kdyrkhan
ARIPoint is a powerful trading companion designed to generate high-probability entry signals with dynamic TP/SL/DP levels based on volatility. Built-in performance tracking shows win/loss stats, PP1/PP2 hits, and success rates all updated live. Key Features: Buy/Sell signals with adaptive volatility bands Real-time TP/SL/DP levels based on ATR Built-in MA Filter with optional ATR/StdDev volatility Performance stats panel (Success, Profit/Loss, PP1/PP2) Alerts via popup, sound, push, or email Cu
Trend indicator AI mt5
Ramil Minniakhmetov
5 (15)
Trend Ai indicator è un ottimo strumento che migliorerà l'analisi di mercato di un trader combinando l'identificazione della tendenza con punti di ingresso utilizzabili e avvisi di inversione. Questo indicatore consente agli utenti di navigare nelle complessità del mercato forex con fiducia e precisione Oltre ai segnali primari, l'indicatore Ai di tendenza identifica i punti di ingresso secondari che si presentano durante i pullback o i ritracciamenti, consentendo ai trader di capitalizzare le
RelicusRoad Pro: Sistema Operativo Quantitativo di Mercato 70% DI SCONTO ACCESSO A VITA (TEMPO LIMITATO) - UNISCITI A 2.000+ TRADER Perché la maggior parte dei trader fallisce anche con indicatori "perfetti"? Perché operano su Singoli Concetti isolati. Un segnale senza contesto è una scommessa. Per vincere serve CONFLUENZA . RelicusRoad Pro non è un semplice indicatore. È un Ecosistema Quantitativo completo . Mappa la "Fair Value Road", distinguendo tra rumore e rotture strutturali. Smetti di in
Quantum TrendPulse
Bogdan Ion Puscasu
5 (22)
Ecco   Quantum TrendPulse   , lo strumento di trading definitivo che combina la potenza di   SuperTrend   ,   RSI   e   Stocastico   in un unico indicatore completo per massimizzare il tuo potenziale di trading. Progettato per i trader che cercano precisione ed efficienza, questo indicatore ti aiuta a identificare con sicurezza le tendenze di mercato, i cambiamenti di momentum e i punti di entrata e uscita ottimali. Caratteristiche principali: Integrazione SuperTrend:   segui facilmente l'andame
Pips Stalker mt5
Abdulkarim Karazon
5 (1)
Il Pips Stalker è un indicatore a freccia lunga e corta, aiuta i trader di tutti i livelli a prendere decisioni migliori nel trading sul mercato, l'indicatore non viene mai ridipinto e usa l'RSI come logica principale del segnale; una volta applicata una freccia, non verrà mai ridipinta o ridipinga e le frecce non vengono ritardate. VERSIONE MT4 &lt;---- CARATTERISTICHE DELLA FRECCIA PIPS STALKER : PANNELLO STATISTICHE un dashboard informativo unico che mostra la percentuale complessiva di
FX Levels MT5
Daniel Stein
5 (13)
FX Levels: Supporti e Resistenze di Precisione Eccezionale per Tutti i Mercati Panoramica Rapida Cercate un modo affidabile per individuare livelli di supporto e resistenza in ogni mercato—coppie di valute, indici, azioni o materie prime? FX Levels fonde il metodo tradizionale “Lighthouse” con un approccio dinamico all’avanguardia, offrendo una precisione quasi universale. Basato sulla nostra esperienza reale con i broker e su aggiornamenti automatici giornalieri più quelli in tempo reale, FX
Candle Smart Range
Gianny Alexander Lugo Sanchez
5 (1)
Candle Smart Range (CSR) per MetaTrader 5 Candle Smart Range è un indicatore tecnico progettato per l'identificazione automatica dei range di prezzo su più timeframe. Questo strumento analizza la struttura del mercato basandosi sulle formazioni delle candele e sull'interazione del prezzo con i massimi e i minimi precedenti. Caratteristiche principali: Rilevamento Range: Identifica le zone di consolidamento prima dei movimenti impulsivi. Identificazione Falsi Breakout: Segnala quando il prezzo su
Crystal Heikin Ashi Signals
Muhammad Jawad Shabir
5 (1)
Crystal Heikin Ashi Signals - Professional Trend & Signal Detection Indicator Advanced Heikin Ashi Visualization with Intelligent Signal System for Manual & Automated Trading Final Price: $149 ---------> Price goes up $10 after every 10 sales . Limited slots available — act fast . Overview Crystal Heikin Ashi Signals is a professional-grade MetaTrader 5 indicator that combines pure Heikin Ashi candle visualization with an advanced momentum-shift detection system. Designed for both manual traders
IX Power MT5
Daniel Stein
4.92 (13)
IX Power: Scopri approfondimenti di mercato per indici, materie prime, criptovalute e forex Panoramica IX Power è uno strumento versatile progettato per analizzare la forza di indici, materie prime, criptovalute e simboli forex. Mentre FX Power offre la massima precisione per le coppie di valute utilizzando i dati di tutte le coppie disponibili, IX Power si concentra esclusivamente sui dati di mercato del simbolo sottostante. Questo rende IX Power una scelta eccellente per mercati non correlat
Questo indicatore è un indicatore per l'analisi automatica delle onde perfetto per il trading pratico! Caso... Nota:   non sono abituato a usare nomi occidentali per la classificazione delle onde a causa dell'influenza della convenzione di denominazione di Tang Lun (Tang Zhong Shuo Zen), ho chiamato l'onda base come   penna   e la banda dell'onda secondaria come   segmento   At allo stesso tempo, il segmento ha la direzione del trend. La denominazione   è principalmente segmento di trend   (que
Altri dall’autore
KT Momentum Arrows MT5
KEENBASE SOFTWARE SOLUTIONS
5 (2)
L'indicatore KT Momentum Arrows si basa su una rottura momentanea calcolata utilizzando la deviazione delle bande e la volatilità emergente in una determinata direzione. Un segnale di acquisto viene generato quando il prezzo chiude al di sopra della banda superiore, mentre un segnale di vendita viene generato quando chiude al di sotto della banda inferiore. Viene utilizzato un coefficiente di magnitudo come input, che influenza sia la deviazione delle bande sia la misurazione della volatilità. I
KT Asian Breakout
KEENBASE SOFTWARE SOLUTIONS
4 (1)
KT Asian Breakout carefully analyzes the range-bound market during the Asian session and then fires a long or short trade after doing some preassessment based on its inbuilt technical analysis module. The executed orders are closed within a day before the completion of the next day session. The inbuilt technical analysis module checks for the session range and compares it with the last 20 days price movement. If it finds any erratic price movement within the session, the orders are not executed
Use of support and resistance in systematic trading is very subjective. Every trader has their own idea and way to plotting the support and resistance levels on the chart. KT Support and Resistance indicator take out this ambiguity out of the situation and automatically draws support and resistance levels following an algorithmic approach using a unique multi-timeframe analysis. When launched on the chart, It immediately scan the most significant extreme points across all the available timefra
ACB Breakout Arrows
KEENBASE SOFTWARE SOLUTIONS
4.15 (34)
L’indicatore ACB Breakout Arrows fornisce un segnale di ingresso cruciale rilevando uno specifico pattern di breakout. Monitora costantemente il grafico alla ricerca di un momentum stabile in una direzione e segnala con precisione l’ingresso poco prima del movimento principale.  Ottieni lo scanner multi-simbolo e multi-timeframe qui - Scanner per ACB Breakout Arrows MT4 Caratteristiche principali Lo Stop Loss e il Take Profit sono calcolati automaticamente dall'indicatore. Include una dashboard
ACB Breakout Arrows MT5
KEENBASE SOFTWARE SOLUTIONS
5 (1)
L’indicatore ACB Breakout Arrows fornisce un segnale di ingresso fondamentale nel mercato rilevando uno specifico pattern di breakout. L’indicatore analizza costantemente il grafico per individuare un momentum stabile in una direzione e fornisce un segnale preciso subito prima del movimento principale. Ottieni lo scanner multi-simbolo e multi-timeframe da qui - Scanner per ACB Breakout Arrows MT5 Caratteristiche principali I livelli di Stop Loss e Take Profit sono forniti automaticamente dall’
KT RSI Divergence Robot MT4
KEENBASE SOFTWARE SOLUTIONS
KT RSI Divergence robot è un Expert Advisor completamente automatizzato che opera le divergenze regolari e nascoste tra il prezzo e l’oscillatore Relative Strength Index (RSI). I segnali di divergenza provengono dal nostro indicatore RSI Divergence disponibile gratuitamente. Non tutte le divergenze sfociano in un’inversione di prezzo di successo; per questo motivo l’EA combina i segnali grezzi di divergenza con il proprio modulo di analisi tecnica integrato per sfruttare l’inefficienza di prez
KT CCI Divergence MT5
KEENBASE SOFTWARE SOLUTIONS
KT CCI Divergence shows the regular and hidden divergence created between the price and CCI oscillator. Divergence is one of the vital signals that depicts the upcoming price reversal in the market. Manually spotting the divergence between price and CCI can be a hectic and ambiguous task. Limitations of KT CCI Divergence   Using the CCI divergence as a standalone entry signal can be risky. Every divergence can't be interpreted as a strong reversal signal. For better results, try to combine it w
ACB Trade Filter MT4
KEENBASE SOFTWARE SOLUTIONS
5 (1)
The ACB Trade Filter indicator provides a solution for filtering out the low probability trading setups in a trading strategy. The indicator uses a sophisticated filtration algorithm based on the market sentiment and trend. Applications Works great with our indicator " ACB Breakout Arrows ". Filter out low probability signals from any indicator. Avoid overtrading and minimize the losses. Trade in the direction of market sentiment and trend. Avoid the choppiness in the market. How to use Only L
KT Momentum Arrows
KEENBASE SOFTWARE SOLUTIONS
L'indicatore KT Momentum Arrows si basa su una rottura momentanea calcolata utilizzando la deviazione delle bande e la volatilità emergente in una determinata direzione. Un segnale di acquisto viene generato quando il prezzo chiude al di sopra della banda superiore, mentre un segnale di vendita viene generato quando chiude al di sotto della banda inferiore. Viene utilizzato un coefficiente di magnitudo come input, che influenza sia la deviazione delle bande sia la misurazione della volatilità. I
KT COG Advanced MT4
KEENBASE SOFTWARE SOLUTIONS
1 (1)
KT COG is an advanced implementation of the center of gravity indicator presented by John F. Ehlers in the May 2002 edition of Technical Analysis of Stocks & Commodities magazine. It's a leading indicator which can be used to identify the potential reversal points with the minimum lag. The COG oscillator catches the price swings quite effectively. MT5 version of the same indicator is available here KT COG Advanced MT5 Calculation of COG The COG indicator is consist of the two lines. The main l
KT Pin Bar
KEENBASE SOFTWARE SOLUTIONS
KT Pin Bar identifies the pin bar formation which is a type of price action pattern which depicts a sign of reversal or rejection of the trend. When combined with support and resistance, BRN and other significant levels, Pin Bar pattern proved to be a very strong sign of reversal. Basically, a pin bar is characterized by a small body relative to the bar length which is closed either in upper or lower 50% part of its length. They have very large wicks and small candle body. A pin bar candlestic
KT Trend Magic
KEENBASE SOFTWARE SOLUTIONS
KT Trend Magic shows the trend depiction on chart using the combination of market momentum and volatility. A smoothing coefficient is used to smooth out the noise from the signal.It can be used to find out the new entries or confirm the trades produced by other EA/Indicators. Usage Drag n drop MTF scanner which scans for the new signals across multiple time-frames. Find new entries in the trend direction. Improve the accuracy of other indicators when used in conjunction. Can be used as a dynami
KT Auto Fibo
KEENBASE SOFTWARE SOLUTIONS
KT Auto Fibo traccia automaticamente i livelli di ritracciamento di Fibonacci basandosi sulla direzione della tendenza in corso. I massimi e i minimi vengono selezionati automaticamente utilizzando i punti massimi e minimi disponibili sul grafico. Puoi ingrandire, ridurre e scorrere il grafico per regolare i livelli di Fibonacci di conseguenza. Modalità Automatico:  Traccia automaticamente i livelli di Fibonacci in base all'area visibile del grafico. Manuale: Traccia i livelli di Fibonacci una
KT Psar Arrows
KEENBASE SOFTWARE SOLUTIONS
KT Psar Arrows traccia frecce sul grafico utilizzando l'indicatore standard Parabolic SAR. Una freccia rialzista viene tracciata quando il massimo della candela tocca il SAR. Una freccia ribassista viene tracciata quando il minimo della candela tocca il SAR. I segnali vengono generati in tempo reale senza attendere la chiusura della candela.  Funzionalità Uno strumento utile per i trader che desiderano sperimentare strategie di trading che includono l'uso dell'indicatore Parabolic SAR.  Può ess
KT Ichimoku Trader
KEENBASE SOFTWARE SOLUTIONS
1 (1)
KT Ichimoku Trader is a fully automated expert advisor that offers five popular trading strategies based on the Ichimoku indicator. Each strategy has it's own entry and exit method without any interference to other strategies. The Ichimoku system can be applied to all major currency pairs and metals. However, we found that it performs reasonably well mainly on two pairs.   MT5 Version is available here  https://www.mql5.com/en/market/product/35043 Features Trade up to 5 famous trading strategi
KT Volatility Oscillator
KEENBASE SOFTWARE SOLUTIONS
L'Oscillatore di Volatilità KT analizza i dati di mercato passati e presenti utilizzando una formula matematica per mostrare il risultato sotto forma di oscillatore. Le onde crescenti e decrescenti corrispondono rispettivamente a un'elevata e a una bassa volatilità dell'asset.  In poche parole, la volatilità è semplicemente una misura delle fluttuazioni di prezzo di un asset in un certo periodo di tempo. Senza volatilità, ci sarebbero pochi movimenti di mercato e i trader non potrebbero trarre p
KT COG Robot
KEENBASE SOFTWARE SOLUTIONS
KT COG Robot is a fully automated Expert Advisor based on the KT COG Indicator . The COG indicator was originally presented by John F. Ehlers in the May 2002 edition of Technical Analysis of Stocks & Commodities magazine. The EA fires a long trade when COG line cross above the signal line and a short trade is fired when the COG line cross below the signal line.  Adaptive Filtration Our adaptive filtration algorithm combines the original COG formula with the major trend direction and market acce
ACB Breakout Arrows EA
KEENBASE SOFTWARE SOLUTIONS
Questo è un Expert Advisor completamente automatizzato basato sul nostro indicatore personalizzato chiamato "ACB Breakout Arrows" . Le entrate si basano su un pattern di breakout che si verifica costantemente in entrambe le direzioni. L’intensità dei segnali può essere regolata tramite il parametro esterno "Signal Sensitivity". Conferma delle operazioni ACB Breakout Arrows EA consente di filtrare gli ingressi utilizzando un altro nostro indicatore personalizzato chiamato ACB Trade Filter . For
KT London Breakout
KEENBASE SOFTWARE SOLUTIONS
First thirty minutes are essential for a trading session. The early reaction of traders and market players sets a path for the rest of the day. KT London Breakout EA takes advantage of this phenomenon, and after analyzing the first thirty minutes of London session, it places two bidirectional pending orders. One of pending order is eventually canceled after realizing the market direction with certainty. It has been strictly tested and developed for EUR/JPY using 30-Min Time Frame. You can expe
Use of support and resistance in systematic trading is very subjective. Every trader has their own idea and way to plotting the support and resistance levels on the chart. KT Support and Resistance indicator take out this ambiguity out of the situation and automatically draws support and resistance levels following an algorithmic approach using a unique multi-timeframe analysis. When launched on the chart, It immediately scan the most significant extreme points across all the available timefra
Se fai trading nel Forex, avere informazioni dettagliate sulla forza delle valute e sulla correlazione tra coppie di valute può portare il tuo trading a un livello superiore. La correlazione ti aiuterà a dimezzare il rischio, mentre l'analisi della forza ti permetterà di massimizzare i profitti. Questo indicatore offre un approccio ibrido per selezionare le coppie di valute più appropriate, combinando l'analisi della forza delle valute e la correlazione tra coppie di valute. Come utilizzare l'a
MACD Divergence Seeker
KEENBASE SOFTWARE SOLUTIONS
KT MACD Divergence Seeker trades the regular and hidden divergence signals generated by our free indicator named KT MACD Divergence indicator. Trading the standalone divergences can be a risky affair that's why the KT MACD Divergence Seeker combines the standard divergence signals with an advanced analysis module to exploit the price inefficiencies on some FX pairs. What is the Divergence exactly? As a general conception if the price is making higher highs, then macd should also be making hig
KT Asian Breakout Indicator
KEENBASE SOFTWARE SOLUTIONS
L'indicatore KT Asian Breakout analizza una parte cruciale della sessione asiatica per generare segnali di acquisto e vendita in entrambe le direzioni, in base alla rottura del prezzo. Un segnale di acquisto si verifica quando il prezzo supera il massimo della sessione, mentre un segnale di vendita si verifica quando il prezzo scende al di sotto del minimo della sessione. Cose da ricordare Se la scatola della sessione è troppo ampia verticalmente, è consigliabile evitare di entrare in nuovi tra
MACD Divergence MT4
KEENBASE SOFTWARE SOLUTIONS
KT MACD Divergence mostra le divergenze regolari e nascoste che si formano tra il prezzo e l’oscillatore. Se la tua strategia di trading prevede un'inversione di tendenza, puoi utilizzare la divergenza regolare del MACD per identificare possibili punti di svolta. Se invece la tua strategia si basa sulla continuazione del trend, la divergenza nascosta del MACD sarà più adatta. Limitazioni di KT MACD Divergence Usare la divergenza del MACD come unico segnale d'ingresso può essere rischioso. Non
KT Bollinger Bands Trader MT4
KEENBASE SOFTWARE SOLUTIONS
KT Bollinger Bands Trader è un Expert Advisor completamente automatizzato che utilizza una strategia di ritorno alla media basata sulle bande di Bollinger durante i periodi di bassa volatilità. Il prezzo spesso reagisce sulla linea superiore o inferiore delle bande, ma non sempre si verifica un'inversione. Tuttavia, la probabilità di un’inversione è maggiore quando la volatilità è bassa. Ingressi Un trade long viene attivato quando il prezzo si posiziona correttamente al di sotto della banda in
KT CCI Divergence MT4
KEENBASE SOFTWARE SOLUTIONS
KT CCI Divergence shows the regular and hidden divergence created between the price and CCI oscillator. Divergence is one of the vital signals that depicts the upcoming price reversal in the market. Manually spotting the divergence between price and CCI can be a hectic and ambiguous task. Limitations of KT CCI Divergence   Using the CCI divergence as a standalone entry signal can be risky. Every divergence can't be interpreted as a strong reversal signal. For better results, try to combine it w
KT Heiken Ashi Smoothed MT4
KEENBASE SOFTWARE SOLUTIONS
KT Heiken Ashi Smoothed è una versione smussata dello Heiken Ashi standard e disegna frecce di acquisto/vendita quando la tendenza cambia. Viene tracciata una freccia di acquisto quando si passa da stato ribassista a rialzista. Viene tracciata una freccia di vendita quando si passa da rialzista a ribassista. Notifiche mobile, email, audio e pop-up incluse. Cosa è esattamente Heiken Ashi Smoothed? Filtra i falsi segnali e il rumore del Heiken Ashi standard applicando due medie mobili per render
KT MA Crossover MT4
KEENBASE SOFTWARE SOLUTIONS
KT MA Crossover disegna frecce di acquisto e vendita in base all'incrocio delle medie mobili selezionate. Inoltre, genera gli avvisi appropriati e visualizza il valore MFE (Escursione Più Favorevole) per ogni segnale consecutivo. L’incrocio delle medie mobili è una delle strategie più utilizzate dai trader di tutto il mondo. Di solito si basa su una media mobile veloce e una lenta per determinare segnali di ingresso in acquisto o vendita in base alla direzione dell’incrocio. Segnale di acquisto
KT Round Numbers MT4
KEENBASE SOFTWARE SOLUTIONS
KT Round Numbers plots the round number levels which are also commonly known as psychological levels in the Forex world. In the context of Forex trading, round number levels are those levels in which there are two or more zeroes at the end. They are named as 00 levels on the chart. Some traders also consider the halfway points as a valid round number level. They are named as 50 levels on the chart. Use of round number levels in trading Round number levels work as strong support and resistance
KT Inside Bar Advanced MT4
KEENBASE SOFTWARE SOLUTIONS
Despite the popularity of inside bar pattern among the traders, using it as a standalone signal doesn't provide any edge in the market. KT Inside Bar Advanced indicator solves this problem by combining the classic inside bar pattern with the "ECE" cycle and Fibonacci extensions. Using this indicator in place of our classic inside bar indicator will provide a tremendous advantage and edge in the market. What is the ECE cycle? In financial markets, the price never moves in a straight line but u
Filtro:
Nessuna recensione
Rispondi alla recensione