TTM Squeeze indicator for MT4
- Indicatori
-
Renaud Herve Francois Candel
 ITC SOFTWARE is a technology company based in the United States since 2010.
🟠🔴 The company develops financial software and indicators for different trading platforms:
-Metatrader 4 and Metatrader 5
-TradingView
-NinjaTrader - Versione: 1.80
- Aggiornato: 2 luglio 2023
- Attivazioni: 5
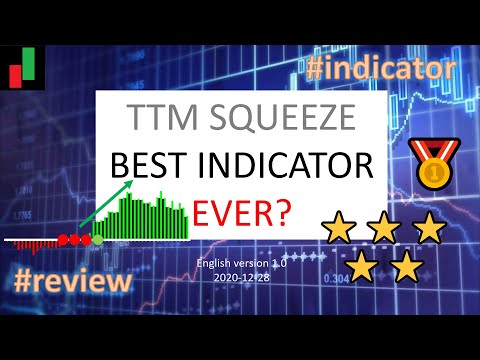
TTM Squeeze is an indicator to time entries based on volatility.
TMM Squeeze might well be one of the best and most overlooked indicator. It was created by famous trader John Carter and is also used by many traders like Nathan Bear.
Why is the TTM Squeeze indicator important? Because in trading correct timing entries might be more important than picking the right direction. This is a concept that is not very well understood in the trading community. Most trader think that they will make money if they can predict market direction. Only very experienced traders like Nathan Bear are well aware of the importance of timing to make money in the market. And the purpose of TTM Squeeze indicator is exactly to time entries and this is why this indicator is so important.
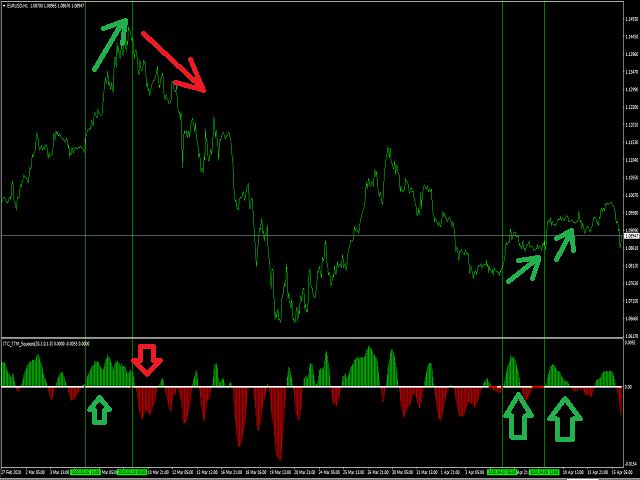
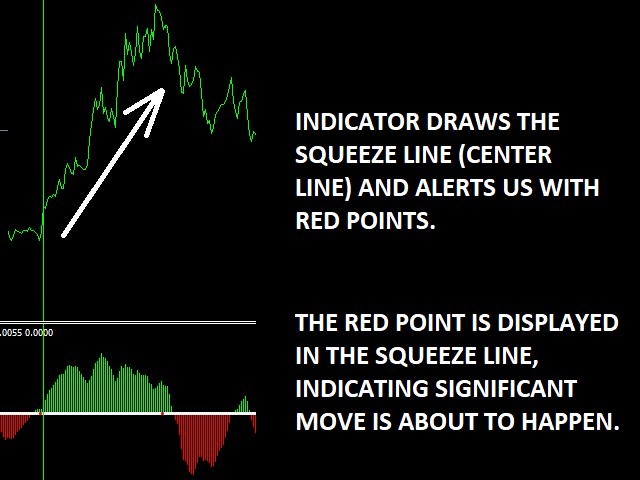
The indicator will plot red and white points (squeeze line in the center) and histogram (above and below the center line).
When the indicator draws red points then it means the market is ready to shoot (see example in screenshot).
Indicator also draws histogram showing momentum. This is an indication of the direction of the next move. The histogram tell us about the strength of the momentum in price.
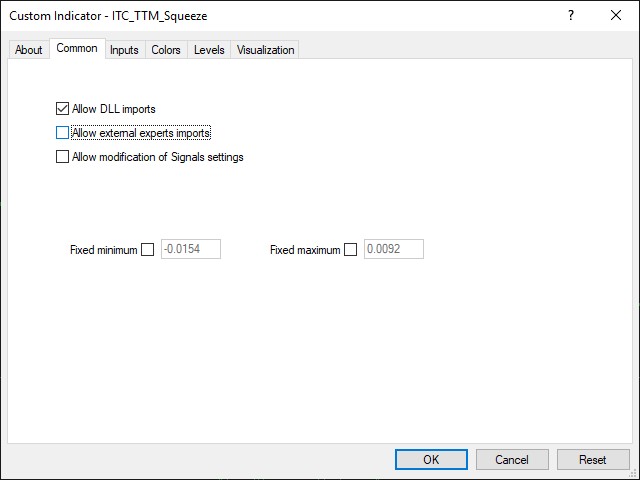
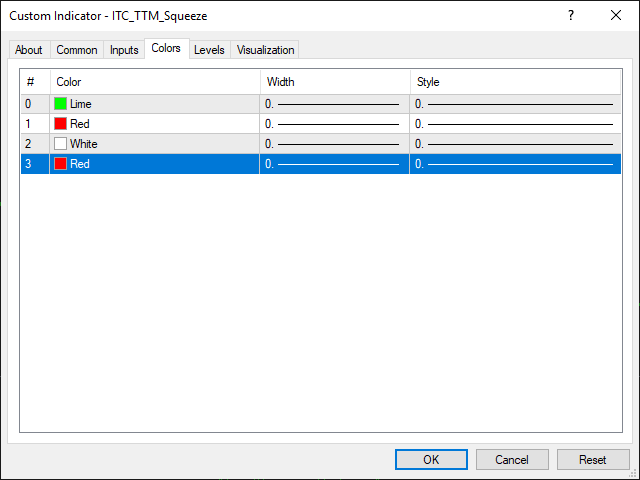
You can customize colors for the indicator, both for the squeeze line and the histogram.
You can receive alerts once a signal is confirmed (at the close of the candle). You have many options to receive the alerts: popup window, email, notification, sound.
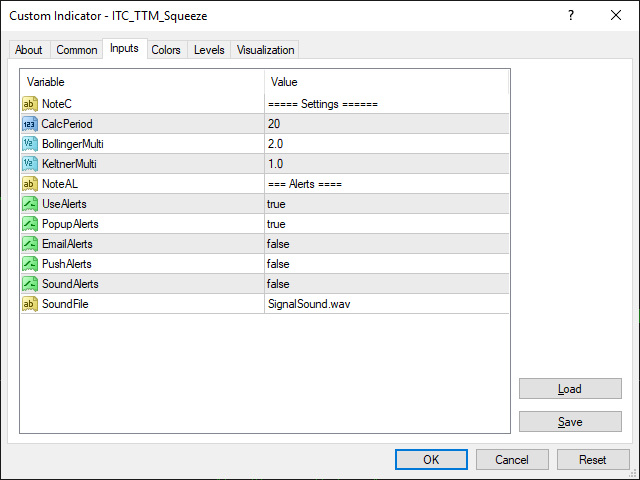
Inputs of the indicator are:
- Period (default 20) - period used for the calculations of the Bollinger and Keltner bands
- BollingerMulti (default 2.0) - is the factor used for calculation of the Bollinger bands with the standard deviation.
- KeltnerMulti (default 1.0) - is the factor used for the calculation of the Keltner bands with the true range.
- UseAlerts (true/false) - set to true to enable alerts management.
- PopupAlerts (true/false) - set to true to receive alerts of type pop-up box window.
- EmailAlerts (true/false) - set to true to receive alerts over email.
- PushAlerts (true/false) - set to true to receive alerts to your mobile using Metatrader notifications.
- SoundAlerts (true/false) - set to true to receive alerts of type sound.
- SoundFile - name of wav file to be used to play sound alerts.
Some indicators use simplified formulas for the calculation of the squeeze. This indicator uses the complete formulas as designed by the original creator of the indicator.
The indicator can be used with any class of instruments: Forex, Stocks, Indices, Futures, Commodities and Cryptos
The indicator can be used with any time frame.
The higher the time frame you choose, the smaller the quantity of signals.
For my personal use, I like to trade the H1 time frame.
The indicator will give few signals but they are quite accurate.
Other indicators for MT4:
We developed more than 60 indicators and utilities for Metatrader 4 and Metatrader 5.
Indicators for MT5:
All our indicator are developed both for MT4 and MT5.
👉 You can get the complete list of our indicators visiting our profile page.