MTF MA2 for MT5
- Indicatori
- Versione: 3.0
- Aggiornato: 17 dicembre 2020
- Attivazioni: 5

MTF-MA2 for MT5
特徴:
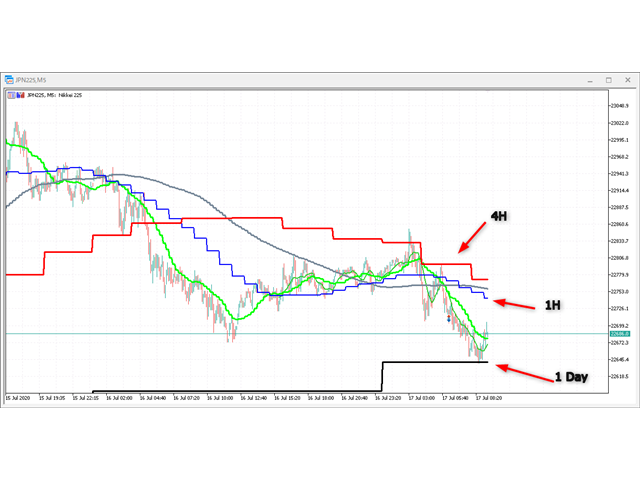
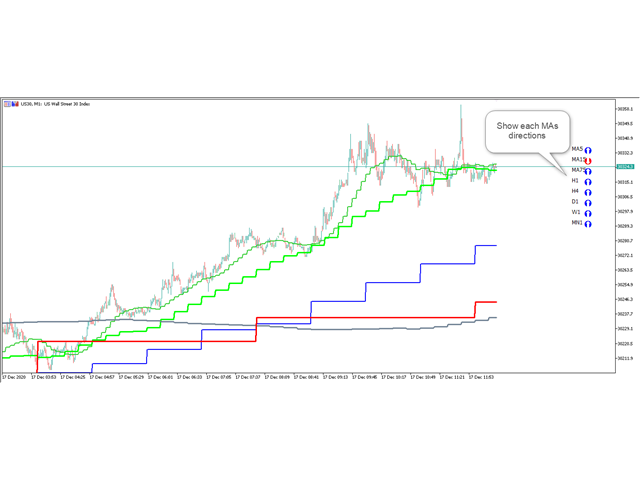
MTF Moving Averageを8本一気に表示してくれるインジケータになります。
8本も必要ない場合にももちろん非表示にできます。
パフォーマンスを考慮しているのでチャートが重くなるようなことは
無いはずになります。どの通貨でも使用可能になります。
それぞれのMTF Moving Averageの色や太さを変更できます。
各パラメータの説明:
■Method:MAの種類設定をします。
■Applied price:MAで使用する価格を設定をします。
TimeFrame M5:使用するMAの時間足を設定します。
Period M5:使用するMAの期間を設定します。
※ラベルに関係なく8本のMTF MAはどの時間足でも期間設定可能になります。
■ Limited bar?:表示に使用するバーを制限するかどうかを設定します。
※ここをFalseにするとすべてのバーを読み込むことになるのでチャートが重く
なるかもしれません。ご注意ください。
■ Max bars:使用するバーの本数を設定します。過去検証をする場合にはここの値を増やしてください。
■ Update Frequency(seconds):MTF Moving Averageの再作成更新頻度を入力します。

1.右上に表示されるラベルが邪魔で Label position X, Y を 0 に設定することで非表示にできた
2.M75という設定が意味不明で不要
3.M30が必要
4.チャートの右端に縦線が表示されて増えてゆく
5.これは使えないのでチャートから外しました