MA Cross for MT5

AKT for MT5 (Traders Club) 


機能:
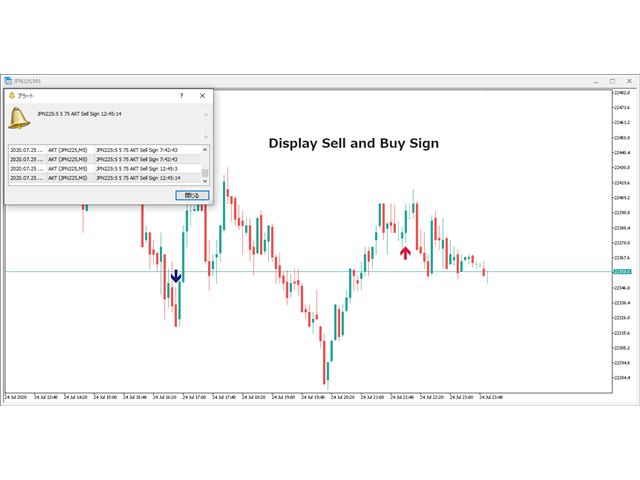
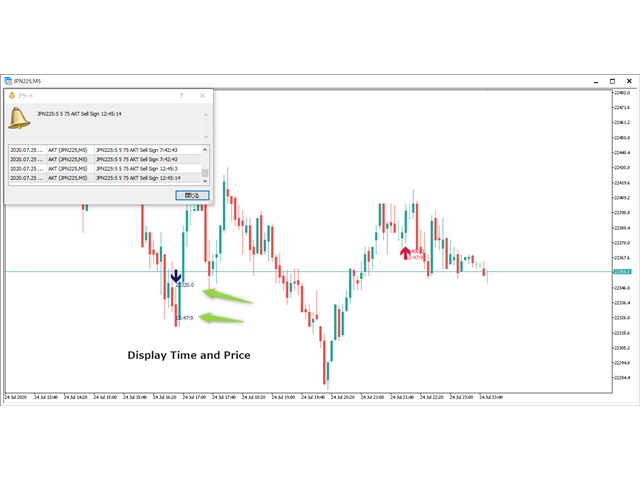
■MAゴールデンクロスで買いサイン、デットクロスで売りサインを表示します。
MAの期間は短期足と長期足を入力できます。
MAの種類を選択できます。(SMA、EMA、SMMA、LWMA)
適用する価格を選べます。(CLOSE,OPEN,LOW,HIGH,MEDIAN,TYPICAL,WEIGHTED)
■サインをアラートで通知します。
■サイン発生をE-mailやSNSで通知します。

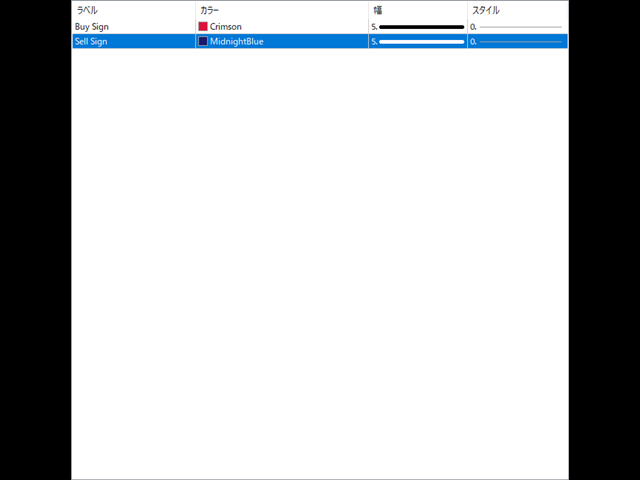
■表示するサインを変更することが出来ます。
■サインの色を変更することが出来ます。
■サインの表示された時間と価格が表示されます。
※価格は終値になります。
Indicator Noを変えることによるこのインジケータを複数適用することができます。
これにより違う MAの期間による ゴールデンクロスと デットクロスのサインを
表示できます。


Prodotti consigliati
Universal Soul Reaper
Pieter Gerhardus Van Zyl
Universal Soul Reaper is an atmospheric market-flow oscillator designed to interpret price behavior as a cycle of spiritual energy. Instead of reacting to raw price alone, it visualizes the state of the market’s soul —revealing when momentum is awakening, stabilizing, or fading. The indicator operates in a separate window and presents three interwoven entities: the Ectoplasmic Veil , the Spirit Boundary , and the Soul Core . Together, they form a living framework that helps traders sense pressu
Fibo Channels
Jeffrey Quiatchon
Fibo Daily Channel Indicator The  Indicator is a powerful tool for traders, providing precise daily support and resistance levels based on Fibonacci retracement and extension calculations. This indicator automatically draws key pivot points (PP, R1, R2, S1, S2) as well as additional extension levels (R3, R4, S3, S4), helping traders identify potential reversal and breakout zones with ease. It includes customizable alerts and push notifications, allowing traders to receive updates whenever the pr
KT Renko Patterns MT5
KEENBASE SOFTWARE SOLUTIONS
KT Renko Patterns analizza il grafico Renko mattone per mattone per individuare i pattern grafici più famosi, frequentemente utilizzati dai trader nei vari mercati finanziari. Rispetto ai grafici basati sul tempo, i grafici Renko rendono il trading basato sui pattern più semplice e visivamente chiaro grazie alla loro struttura pulita. KT Renko Patterns include diversi pattern Renko, molti dei quali sono ampiamente spiegati nel libro “Profitable Trading with Renko Charts” di Prashant Shah. Un E
Nova AC Trader is a modern automation of the Accelerator Oscillator (AC) — a Bill Williams momentum tool designed to detect shifts in market acceleration before trends fully form. This EA transforms the indicator’s early-warning nature into a structured trading system that reacts only when momentum changes are clear and consistent. Instead of waiting for the trend to be obvious, Nova AC Trader identifies when market acceleration starts to turn — offering opportunities at the earliest stage of mo
L'indicateur SMC Venom Model BPR est un outil professionnel pour les traders travaillant dans le concept Smart Money (SMC). Il identifie automatiquement deux modèles clés sur le graphique des prix: FVG   (Fair Value Gap) est une combinaison de trois bougies, dans laquelle il y a un écart entre la première et la troisième bougie. Forme une zone entre les niveaux où il n'y a pas de support de volume, ce qui conduit souvent à une correction des prix. BPR   (Balanced Price Range) est une combinaiso
Cumulative delta indicator As most traders believe, the price moves under the pressure of market buying or selling. When someone redeems an offer standing in the cup, the deal is a "buy". If someone pours into the bid standing in the cup - the deal goes with the direction of "sale". The delta is the difference between purchases and sales. A cumulative delta - the difference between the cumulative sum of purchases and sales for a certain period of time. It allows you to see who is currently contr
Owl Smart Levels MT5
Sergey Ermolov
4.03 (32)
Versione MT4  |  FAQ L' indicatore Owl Smart Levels è un sistema di trading completo all'interno dell'unico indicatore che include strumenti di analisi di mercato popolari come i frattali avanzati di Bill Williams , Valable ZigZag che costruisce la corretta struttura a onde del mercato, e i livelli di Fibonacci che segnano i livelli esatti di entrata nel mercato e luoghi per prendere profitti. Descrizione dettagliata della strategia Istruzioni per lavorare con l'indicatore Consulente-assistente
Pro Gold System Indicator
PEDRO JOAQUIM GONCALVES GOMES
ADVANCED FUNCTIONALITIES: Trend Score (0-100) with visual bar Intelligent signals with adjustable strength (1-10) Risk management with automatic TP/SL Audible and visual alerts Price zones with smooth filling Multi-indicator analysis (RSI, ATR, BB, EMAs) DESIGN FEATURES Modern Visual: Smooth and well-spaced lines (EMA with 2-3px width) Vibrant and professional colors (Sky Blue, Orange, Gold) Modern arrows (code 233/234) for buy/sell signals Configurable dark/light theme Adjustable transparency f
Noize Absorption Index - is the manual trading system that measures the difference of pressure between bears forces and bulls forces. Green line - is a noize free index that showing curent situation. Zero value of index shows totally choppy/flat market.Values above zero level shows how powerfull bullish wave is and values below zero measures bearish forces.Up arrow appears on bearish market when it's ready to reverse, dn arrow appears on weak bullish market, as a result of reverse expectation.
PZ Mean Reversion MT5
PZ TRADING SLU
3 (2)
Indicatore unico che implementa un approccio professionale e quantitativo al trading di reversione. Sfrutta il fatto che il prezzo devia e ritorna alla media in modo prevedibile e misurabile, il che consente regole di entrata e uscita chiare che superano di gran lunga le strategie di trading non quantitative. [ Installation Guide | Update Guide | Troubleshooting | FAQ | All Products ] Segnali di trading chiari Incredibilmente facile da scambiare Colori e dimensioni personalizzabili Implementa l
ATRZigMACD
Igor Nagorniuk
ATRZigMACD - Breve Descrizione dell'Indicatore 1. Scopo e Concetto ATRZigMACD è un oscillatore avanzato che combina il classico MACD con un algoritmo ATR-ZigZag per filtrare i falsi segnali. L'indicatore identifica i punti di inversione di tendenza considerando la volatilità, conferma la forza del trend e genera segnali di trading chiari. 2. Principio di Funzionamento Componenti: Istogramma MACD (blu) - differenza tra EMA veloce e lenta Linea di segnale (gialla) - MA di livellamento dell'istog
FXC iDeM-DivergencE MT5 Indicator This is an advanced DeMarker indicator that finds trend-turn divergences on the current symbol. The indicator detects divergence between the DeMarker and the price movements as a strong trend-turn pattern. Main features: Advanced divergence settings Price based on Close, Open or High/Low prices Give Buy/Sell open signals PUSH notifications E-mail sending Pop-up alert Customizeable Information panel Input parameters: DeM Period: The Period size of the DeMarker in
B2U Market State System Part of the B2U Market State System A professional indicator suite designed to analyze market structure, trend state, and momentum. B2U Market State System 의 구성 요소입니다. 시장 구조, 추세 상태, 모멘텀을 입체적으로 분석하기 위한 전문 인디케이터 시스템입니다. Visualizes momentum state and pressure balance within market structures. B2U Ultimate %R Edition goes beyond the traditional Williams %R numeric oscillator. 과매수 · 과매도를 색상과 라인으로 ‘ 상태화 ’ 하다 .” B2U Ultimate %R Edition 은  단순히 전통 Williams %R 을 “ 과매수 / 과매도 숫자 지표 ”
Il livello Premium è un indicatore unico con una precisione superiore all'80% delle previsioni corrette! Questo indicatore è stato testato dai migliori Specialisti di Trading per più di due mesi! L'indicatore dell'autore che non troverai da nessun'altra parte! Dagli screenshot puoi vedere di persona la precisione di questo strumento! 1 è ottimo per il trading di opzioni binarie con un tempo di scadenza di 1 candela. 2 funziona su tutte le coppie di valute, azioni, materie prime, criptovalu
Introduction The "Two Moving Average Crossover" indicator for MetaTrader 5 (MT5) is a technical analysis tool that displays two moving averages and notifies when the moving averages cross each other. The indicator calculates and plots two moving averages, one of which is faster and the other is slower. When the faster moving average crosses above the slower moving average, it is considered a bullish signal, indicating a potential trend reversal or the start of a new uptrend. Conversely, when th
Price Magnet — Price Density and Attraction Levels Indicator Price Magnet is a professional analytical tool designed to identify key support and resistance levels based on statistical Price Density. The indicator analyzes a specified historical period and detects price levels where the market spent the most time. These zones act as “magnets,” attracting price action or forming a structural base for potential reversals. Unlike traditional Volume Profile tools, Price Magnet focuses on price-time d
The Best RSI MT5
Szymon Palczynski
The relative strength index (RSI) is a popular momentum oscillator introduced in 1978. The RSI provides technical traders with signals about bullish and bearish price momentum, and it is often plotted beneath the graph of an asset's price. An asset is usually considered overbought when the RSI is above 70 and oversold when it is below 30. The Best RSI uses the input signal from the RSI indicator. Unlock the potential of the markets with The Best RSI, the fully automated and ready-to-use trading
Laguerre SuperTrend Clouds   adds an Adaptive Laguerre averaging algorithm and alerts to the widely popular SuperTrend indicator. As the name suggests,   Laguerre SuperTrend Clouds (LSC)   is a trending indicator which works best in trendy (not choppy) markets. The SuperTrend is an extremely popular indicator for intraday and daily trading, and can be used on any timeframe. Incorporating Laguerre's equation to this can facilitate more robust trend detection and smoother filters. The LSC uses the
**   All Symbols   x   All Timeframes   scan just by pressing scanner button ** Discount: The price is $50$, But now it is just $39, Limited time offer is active. *** Contact me  to send you instruction and add you in "Trend Reversal group" for sharing or seeing experiences with other users. Introduction: Trendlines are the most famous technical analysis in trading . Trendlines continually form on the charts of markets across all the different timeframes providing huge opportunities for traders
Nova OSM Trader harnesses the analytical strength of OsMA (Moving Average of Oscillator) — a hybrid momentum indicator that captures shifts in market sentiment through the convergence and divergence of moving averages. By reading the pulse of price momentum beneath the surface, this EA identifies optimal trade zones with precision and clarity. Nova OSM Trader focuses on moments when momentum builds or fades in sync with price structure. Rather than reacting to random fluctuations, it evaluates b
Trend Forecaster
Alexey Minkov
5 (7)
The Trend Forecaster indicator utilizes a unique proprietary algorithm to determine entry points for a breakout trading strategy. The indicator identifies price clusters, analyzes price movement near levels, and provides a signal when the price breaks through a level. The Trend Forecaster indicator is suitable for all financial assets, including currencies (Forex), metals, stocks, indices, and cryptocurrencies. You can also adjust the indicator to work on any time frames, although it is recommen
ATrend
Zaha Feiz
4.82 (17)
"ATREND: Come funziona e come utilizzarlo" ### Come funziona L'indicatore "ATREND" per la piattaforma MT5 è progettato per fornire ai trader robusti segnali di acquisto e vendita utilizzando una combinazione di metodologie di analisi tecnica. Questo indicatore sfrutta principalmente l'Average True Range (ATR) per la misurazione della volatilità, insieme ad algoritmi di individuazione dei trend per identificare potenziali movimenti di mercato. Lascia un messaggio dopo l'acquisto e ricevi un rega
STRICTLY FOR BOOM INDEX ONLY!!!!! Here I bring the Maximum Trend Arrows OT1.0 MT5 indicator. This indicator is made up of a combination of different trend indicators for entries and exits, for entries an orange arrow will paint on the chart below the current market and a red flag for closing of trades and it produces buy arrows only. When the orange arrow appears, it will appear along with it's sound to notify you. The 1H timeframe is recommended, don't use it anywhere else than on the 1H timefr
Scalping Lines System MT5 - è un sistema di trading scalping specificamente progettato per il trading dell'oro, l'asset XAUUSD, su timeframe M1-H1. Combina indicatori per l'analisi di trend, volatilità e ipercomprato/ipervenduto, riuniti in un unico oscillatore per l'identificazione di segnali a breve termine. I principali parametri interni per le linee di segnale sono preconfigurati. Alcuni parametri possono essere modificati manualmente: "Durata dell'onda di tendenza", che regola la durata di
PipFinite Exit EDGE MT5
Karlo Wilson Vendiola
4.87 (31)
Did You Have A Profitable Trade But Suddenly Reversed? In a solid strategy, exiting a trade is equally important as entering. Exit EDGE helps maximize your current trade profit and avoid turning winning trades to losers. Never Miss An Exit Signal Again Monitor all pairs and timeframes in just 1 chart www.mql5.com/en/blogs/post/726558 How To Trade You can close your open trades as soon as you receive a signal Close your Buy orders if you receive an Exit Buy Signal. Close your Sell orders if
Wave Trend MT5
Diego Arribas Lopez
MT4 Version Wave Trend MT5 Wave Trend is an oscillator, which helps identifing in a extremely accurate manner market reversals. The Oscillator being obove the overbought level and a cross down of the fast into the slow MA usually indicates a good SELL signal. If the oscillators is below the oversold level and the fast MA crosses over the slower MA usually highlights a good BUY signal. The Wave Trend indicator can be also used when divergences appear against the price, indicating the current move
Trend Master Chart MT5
Frederic Jacques Collomb
Trend Master Chart è l'indicatore di tendenza di cui hai bisogno. Si sovrappone al grafico e utilizza la codifica a colori per definire le diverse tendenze/mosse del mercato. Utilizza un algoritmo che combina due medie mobili e diversi oscillatori. I periodi di questi tre elementi sono modificabili. Funziona su qualsiasi intervallo di tempo e su qualsiasi coppia. A colpo d'occhio sarai in grado di identificare una tendenza al rialzo o al ribasso e i diversi punti di ingresso in questa tendenza.
Crash 1000 Scalping Indicator for the Crash 1000 Deriv Synthetic Index. Introduction The Crash 1000 Scalping Indicator is a specialized tool designed for the Crash 1000 index on the Deriv Synthetic market. This indicator is particularly useful for scalping on the M1 timeframe, helping traders to identify precise entry and exit points for buy positions. It is designed to be non-repainting, providing clear signals with audible alerts and push notifications, and is compatible with mobile devices th
Multi-Timeframe Money Flow Index (MTF MFI) with Smart Divergence and Dashboard Unlock the flow of institutional money across every timeframe. Are you tired of guessing the trend only to be trapped by a sudden reversal? The Multi-Timeframe Money Flow Index (MTF MFI) is a professional-grade trading tool designed to provide a bird's-eye view of market liquidity and momentum. By aggregating volume-weighted data from W1 down to M1, this indicator eliminates noise and highlights high-probability tra
DYJ TradingView
Daying Cao
5 (1)
DYJ TRADINGVIEW è un sistema di valutazione multi indicatore, che utilizza i conteggi dei segnali di valutazione e gli strumenti di analisi per trovare opportunità di ingresso nei mercati globali DYJ TRADINGVIEW ha 10 indicatori integrati per l'analisi di mercato. L'analisi basata su indicatori viene utilizzata da molti trader per aiutarli a prendere decisioni su quali operazioni intraprendere e dove entrare e uscire da esse. Utilizziamo diversi tipi che possono completarsi a vicenda. Usaci
Gli utenti di questo prodotto hanno anche acquistato
SuperScalp Pro
Van Minh Nguyen
5 (7)
SuperScalp Pro – Sistema avanzato di indicatore per scalping con filtri multipli SuperScalp Pro è un sistema avanzato di indicatore per scalping che combina il classico Supertrend con molteplici filtri di conferma intelligenti. L’indicatore funziona in modo efficiente su tutti i timeframe da M1 a H4 ed è particolarmente adatto per XAUUSD, BTCUSD e le principali coppie Forex. Può essere utilizzato come sistema stand-alone o integrato in modo flessibile nelle strategie di trading esistenti. L’indi
Se acquisti questo indicatore, riceverai il mio Trade Manager Professionale + EA  GRATUITAMENTE. Innanzitutto è importante sottolineare che questo sistema di trading è un indicatore Non-Repainting, Non-Redrawing e Non-Lagging, il che lo rende ideale sia per il trading manuale che per quello automatico. Corso online, manuale e download di preset. Il "Sistema di Trading Smart Trend MT5" è una soluzione completa pensata sia per i trader principianti che per quelli esperti. Combina oltre 10 indicat
FX Trend MT5 NG
Daniel Stein
5 (4)
FX Trend NG: La Nuova Generazione di Intelligenza di Trend Multi-Mercato Panoramica FX Trend NG è uno strumento professionale di analisi del trend multi-timeframe e monitoraggio dei mercati. Ti consente di comprendere la struttura completa del mercato in pochi secondi. Invece di passare tra numerosi grafici, puoi identificare immediatamente quali strumenti sono in trend, dove il momentum sta diminuendo e dove esiste un forte allineamento tra i timeframe. Offerta di Lancio – Ottieni FX Trend NG
Divergence Bomber
Ihor Otkydach
4.89 (83)
Ogni acquirente dell’indicatore riceverà inoltre gratuitamente: L’utilità esclusiva “Bomber Utility”, che gestisce automaticamente ogni operazione, imposta i livelli di Stop Loss e Take Profit e chiude le posizioni secondo le regole della strategia I file di configurazione (set file) per adattare l’indicatore a diversi asset I set file per configurare il Bomber Utility in tre modalità: “Rischio Minimo”, “Rischio Bilanciato” e “Strategia di Attesa” Una guida video passo-passo per installare, conf
Entry In The Zone and SMC Multi Timeframe is a real-time market analysis tool developed based on Smart Money Concepts (SMC). It is designed to analyze market structure, price direction, reversal points, and key zones across multiple timeframes in a systematic way. The system displays Points of Interest (POI) and real-time No Repaint signals, with instant alerts when price reaches key zones or when signals occur within those zones. It functions as both an Indicator and a Signal System (2-in-1), c
RFI levels PRO MT5
Roman Podpora
3.67 (3)
L'indicatore mostra accuratamente i punti di inversione e le zone di ritorno dei prezzi in cui il       Principali attori   . Vedi dove si formano le nuove tendenze e prendi decisioni con la massima precisione, mantenendo il controllo su ogni operazione. VERSION MT4     -    Rivela il suo massimo potenziale se combinato con l'indicatore   TREND LINES PRO Cosa mostra l'indicatore: Strutture di inversione e livelli di inversione con attivazione all'inizio di un nuovo trend. Visualizzazione dei li
Power Candles MT5
Daniel Stein
5 (6)
Power Candles – Segnali di ingresso basati sulla forza per tutti i mercati Power Candles porta l’analisi di forza collaudata di Stein Investments direttamente sul grafico dei prezzi. Invece di reagire solo al prezzo, ogni candela viene colorata in base alla reale forza di mercato, consentendo di identificare immediatamente accumuli di momentum, accelerazioni della forza e transizioni di trend pulite. Un’unica logica per tutti i mercati Power Candles funziona automaticamente su tutti i simboli di
FX Power MT5 NG
Daniel Stein
5 (31)
FX Power: Analizza la Forza delle Valute per Decisioni di Trading Più Intelligenti Panoramica FX Power è lo strumento essenziale per comprendere la reale forza delle principali valute e dell'oro in qualsiasi condizione di mercato. Identificando le valute forti da comprare e quelle deboli da vendere, FX Power semplifica le decisioni di trading e rivela opportunità ad alta probabilità. Che tu segua le tendenze o anticipi inversioni utilizzando valori estremi di Delta, questo strumento si adatta
Trend Lines PRO MT5
Roman Podpora
5 (1)
LINEE DI TENDENZA PRO  Aiuta a capire dove il mercato sta realmente cambiando direzione. L'indicatore mostra reali inversioni di tendenza e punti in cui i principali operatori rientrano. Vedi   Linee BOS   Cambiamenti di tendenza e livelli chiave su timeframe più ampi, senza impostazioni complesse o rumore inutile. I segnali non vengono ridisegnati e rimangono sul grafico dopo la chiusura della barra. VERSIONE MT4   -   Svela il suo massimo potenziale se abbinato all'indicatore   RFI LEVELS PRO
Smart Stop Indicator – Precisione intelligente dello stop-loss direttamente sul grafico Panoramica Smart Stop Indicator è la soluzione ideale per i trader che desiderano posizionare il loro stop-loss in modo chiaro e metodico, senza dover indovinare o affidarsi all’intuizione. Questo strumento combina la logica classica del price action (massimi e minimi strutturali) con un moderno riconoscimento dei breakout per identificare il prossimo livello di stop realmente logico. In trend, in range o i
Trend Screener Pro MT5
STE S.S.COMPANY
4.84 (101)
Indicatore di tendenza, soluzione unica rivoluzionaria per il trading di tendenze e il filtraggio con tutte le importanti funzionalità di tendenza integrate in un unico strumento! È un indicatore multi-timeframe e multi-valuta al 100% non ridipingibile che può essere utilizzato su tutti i simboli/strumenti: forex, materie prime, criptovalute, indici e azioni. Trend Screener è un indicatore di tendenza che segue un indicatore efficiente che fornisce segnali di tendenza a freccia con punti nel gra
Quantum TrendPulse
Bogdan Ion Puscasu
5 (20)
Ecco   Quantum TrendPulse   , lo strumento di trading definitivo che combina la potenza di   SuperTrend   ,   RSI   e   Stocastico   in un unico indicatore completo per massimizzare il tuo potenziale di trading. Progettato per i trader che cercano precisione ed efficienza, questo indicatore ti aiuta a identificare con sicurezza le tendenze di mercato, i cambiamenti di momentum e i punti di entrata e uscita ottimali. Caratteristiche principali: Integrazione SuperTrend:   segui facilmente l'andame
Atomic Analyst MT5
Issam Kassas
4.1 (29)
Innanzitutto, vale la pena sottolineare che questo indicatore di trading non è repaint, non è ridisegno e non presenta ritardi, il che lo rende ideale sia per il trading manuale che per quello automatico. Manuale utente: impostazioni, input e strategia. L'Analista Atomico è un indicatore di azione del prezzo PA che utilizza la forza e il momentum del prezzo per trovare un miglior vantaggio sul mercato. Dotato di filtri avanzati che aiutano a rimuovere rumori e segnali falsi, e aumentare il pote
Azimuth Pro
Ottaviano De Cicco
5 (4)
LAUNCH PROMO Azimuth Pro price is initially set at 299$ for the first 100 buyers. Final price will be 499$ . THE DIFFERENCE BETWEEN RETAIL AND INSTITUTIONAL ENTRIES ISN'T THE INDICATOR — IT'S THE LOCATION. Most traders enter at arbitrary price levels, chasing momentum or reacting to lagging signals. Institutions wait for price to reach structured levels where supply and demand actually shift. Azimuth Pro maps these levels automatically: swing-anchored VWAP, multi-timeframe structure lines, an
ARIPoint
Temirlan Kdyrkhan
ARIPoint is a powerful trading companion designed to generate high-probability entry signals with dynamic TP/SL/DP levels based on volatility. Built-in performance tracking shows win/loss stats, PP1/PP2 hits, and success rates all updated live. Key Features: Buy/Sell signals with adaptive volatility bands Real-time TP/SL/DP levels based on ATR Built-in MA Filter with optional ATR/StdDev volatility Performance stats panel (Success, Profit/Loss, PP1/PP2) Alerts via popup, sound, push, or email Cu
FX Levels MT5
Daniel Stein
5 (13)
FX Levels: Supporti e Resistenze di Precisione Eccezionale per Tutti i Mercati Panoramica Rapida Cercate un modo affidabile per individuare livelli di supporto e resistenza in ogni mercato—coppie di valute, indici, azioni o materie prime? FX Levels fonde il metodo tradizionale “Lighthouse” con un approccio dinamico all’avanguardia, offrendo una precisione quasi universale. Basato sulla nostra esperienza reale con i broker e su aggiornamenti automatici giornalieri più quelli in tempo reale, FX
Top indicator for MT5   providing accurate signals to enter a trade without repainting! It can be applied to any financial assets:   forex, cryptocurrencies, metals, stocks, indices .  Watch  the video  (6:22) with an example of processing only one signal that paid off the indicator! MT4 version is here It will provide pretty accurate trading signals and tell you when it's best to open a trade and close it. Most traders improve their trading results during the first trading week with the help of
Trend indicator AI mt5
Ramil Minniakhmetov
5 (15)
Trend Ai indicator è un ottimo strumento che migliorerà l'analisi di mercato di un trader combinando l'identificazione della tendenza con punti di ingresso utilizzabili e avvisi di inversione. Questo indicatore consente agli utenti di navigare nelle complessità del mercato forex con fiducia e precisione Oltre ai segnali primari, l'indicatore Ai di tendenza identifica i punti di ingresso secondari che si presentano durante i pullback o i ritracciamenti, consentendo ai trader di capitalizzare le
IX Power MT5
Daniel Stein
4.92 (13)
IX Power: Scopri approfondimenti di mercato per indici, materie prime, criptovalute e forex Panoramica IX Power è uno strumento versatile progettato per analizzare la forza di indici, materie prime, criptovalute e simboli forex. Mentre FX Power offre la massima precisione per le coppie di valute utilizzando i dati di tutte le coppie disponibili, IX Power si concentra esclusivamente sui dati di mercato del simbolo sottostante. Questo rende IX Power una scelta eccellente per mercati non correlat
FX Dynamic MT5
Daniel Stein
5 (5)
FX Dynamic: Monitora volatilità e trend con un’analisi ATR personalizzabile Panoramica FX Dynamic è uno strumento potente che sfrutta i calcoli di Average True Range (ATR) per fornire ai trader informazioni impareggiabili sulla volatilità, sia giornaliera che intraday. Impostando soglie di volatilità chiare—ad esempio 80%, 100%, 130%—puoi individuare rapidamente opportunità di profitto o ricevere avvisi quando il mercato supera i range abituali. FX Dynamic si adatta al fuso orario del tuo brok
Candle Smart Range
Gianny Alexander Lugo Sanchez
Candle Smart Range (CSR) per MetaTrader 5 Candle Smart Range è un indicatore tecnico progettato per l'identificazione automatica dei range di prezzo su più timeframe. Questo strumento analizza la struttura del mercato basandosi sulle formazioni delle candele e sull'interazione del prezzo con i massimi e i minimi precedenti. Caratteristiche principali: Rilevamento Range: Identifica le zone di consolidamento prima dei movimenti impulsivi. Identificazione Falsi Breakout: Segnala quando il prezzo su
Advanced Supply Demand MT5
Bernhard Schweigert
4.53 (15)
La migliore soluzione per qualsiasi principiante o trader esperto! Questo indicatore è uno strumento di trading unico, di alta qualità e conveniente perché abbiamo incorporato una serie di funzionalità proprietarie e una nuova formula. Con questo aggiornamento, sarai in grado di mostrare fusi orari doppi. Non solo potrai mostrare una TF più alta, ma anche entrambe, la TF del grafico, PIÙ la TF più alta: SHOWING NESTED ZONES. Tutti i trader di domanda di offerta lo adoreranno. :) Informazioni imp
Ogni giorno, molti trader affrontano una sfida comune: il prezzo sembra rompere un livello chiave, entrano in un'operazione, e poi il mercato si inverte, attivando il loro stop loss. Questo è noto come falsa rottura (false breakout) — un movimento di prezzo che supera brevemente un livello di supporto o resistenza prima di invertire la direzione. Questi movimenti possono causare l'attivazione degli stop loss prima che la direzione effettiva del prezzo diventi chiara. Nell'analisi tecnica, questo
L'indicatore " Dynamic Scalper System MT5 " è progettato per il metodo di scalping, ovvero per il trading all'interno di onde di trend. Testato sulle principali coppie di valute e sull'oro, è compatibile con altri strumenti di trading. Fornisce segnali per l'apertura di posizioni a breve termine lungo il trend, con ulteriore supporto al movimento dei prezzi. Il principio dell'indicatore. Le frecce grandi determinano la direzione del trend. Un algoritmo per generare segnali per lo scalping sott
Presentazione       Quantum Breakout PRO   , l'innovativo indicatore MQL5 che sta trasformando il modo in cui scambi le zone di breakout! Sviluppato da un team di trader esperti con un'esperienza di trading di oltre 13 anni,       Quantum Breakout PRO       è progettato per spingere il tuo viaggio di trading a nuovi livelli con la sua strategia innovativa e dinamica della zona di breakout. Quantum Breakout Indicator ti fornirà frecce di segnalazione sulle zone di breakout con 5 zone target di
M1 Scalper Pro MT5
Elif Kaya
4.64 (11)
- Real price is 80$ - 45% Discount (It is 45$ now) Contact me for extra bonus   indicator, instruction or any questions! - Lifetime update free - Non-repaint - Related product: Gann Gold EA - I just sell my products in Elif Kaya Profile, any other websites are stolen old versions, So no any new updates or support. Advantages of  M1 Scalper Pro  Profitability: M1 Scalper Pro is highly profitable with a strict exit strategy. Frequent Opportunities: M1 Scalper Pro  takes advantage of numerous smal
Berma Bands
Muhammad Elbermawi
5 (8)
L'indicatore Berma Bands (BBs) è uno strumento prezioso per i trader che cercano di identificare e capitalizzare i trend di mercato. Analizzando la relazione tra il prezzo e le BBs, i trader possono discernere se un mercato è in una fase di trend o di range. Visita il [ Berma Home Blog ] per saperne di più. Le Berma Bands sono composte da tre linee distinte: la Upper Berma Band, la Middle Berma Band e la Lower Berma Band. Queste linee sono tracciate attorno al prezzo, creando una rappresentazion
Grabber System MT5
Ihor Otkydach
4.82 (22)
Ti presento un eccellente indicatore tecnico: Grabber, che funziona come una strategia di trading "tutto incluso", pronta all’uso. In un solo codice sono integrati strumenti potenti per l’analisi tecnica del mercato, segnali di trading (frecce), funzioni di allerta e notifiche push. Ogni acquirente di questo indicatore riceve anche gratuitamente: L’utility Grabber: per la gestione automatica degli ordini aperti Video tutorial passo dopo passo: per imparare a installare, configurare e utilizzare
Gold Sniper Scalper Pro
Ich Khiem Nguyen
3.63 (8)
Gold Sniper Scalper Pro is a professional indicator for MetaTrader 5, designed to help traders identify entry points and manage risk effectively. The indicator provides a comprehensive analysis toolkit including signal detection system, automatic Entry/SL/TP management, volume analysis, and real-time performance statistics. User guide to understand the system  |  User guide for other languages Included Tools Each Mirage Trading System purchase includes access to the following companion tools at
TrendMaestro5
Stefano Frisetti
Attenzione alle truffe, questo indicatore e' distribuito esclusivamente su MQL5.com nota: questo indicatore e' per METATRADER5, se vuoi la versione per  METATRADER4 questo e' il link:   https://www.mql5.com/it/market/product/108106 TRENDMAESTRO ver 2.5 TRENDMAESTRO   riconosce un nuovo TREND sul nascere, non sbaglia mai. La sicurezza di identificare un nuovo TREND non ha prezzo. DESCRIZIONE TRENDMAESTRO identifica un nuovo TREND sul nascere, questo indicatore prende in esame la volatilita' i
Altri dall’autore
Traders Club Clock for MT5 Readme ローソク足のすぐ横にその時間足での 残り時間とスプレッドを表示します。 ※残り時間はサーバ時間から計算しています。 月足、週足、日足、4時間足、1時間足、30分足、15分足、5分足、1分足 で表示可能となっております。 ※スプレッド値ポイント単位での表示になります。 ※時間の更新はティック毎ではなく1秒 毎 に更新するようにしています。   一目で残り時間とスプレッドを確認できます。 機能: 使用しているフォント種類を変更できます。 使用しているフォントサイズを変更できます。 表示しているテキストの色を変更できます。 スプレッド表示を非表示にすることができます。 表示する位置を変更することが出来ます。
FREE
エントリー前に確認できるチェックリストを作成しました。 以下のコードを参照してMT5用に作成しました。 Strategy Checklist - indicator for MetaTrader 4 https://www.mql5.com/en/code/18877 機能: チェックリスト20個まで入力できます。 表示位置 (左上 、 右上 、 左下 、 右下) の 指定 が可能 になります。 フォントサイズ の 変更が可能 になります。 チェックリストの幅を変更できます。 ドラッグ&ドロップでチェックリストを移動できます。 インストール方法: ファイル->データフォルダーを開く->MQL5フォルダー->Indicatorsフォルダー 配下にex5ファイルを置いてMT5を再起動してください。 チェックリストはマニュアルで入力が必要になります。入力後 保存しておいてください。 テンプレートで保存しておくと容易にチャートに適用できます。
FREE
TrendBar
Koji Kobayashi
5 (3)
パラボリックのデータをもとにトレンドの方向性を1分足から月足まで表示します。 1分足から 月足 まで表示されているので今どの方向に価格が動いているのかがすぐに分かります。 更新はティク毎ではなくディフォルトでは1秒毎、もちろん変更も可能なのでチャートの表示が遅くなるようなことはありません。 機能: どの通貨でも表示可能になります。 アイコンの色を指定することが可能になります。 表示位置(X軸、Y軸)が変更可能 になります。 表示位置 (左上 、 右上 、 左下 、 右下) が 指定 が可能 になります。 フォント を指定することが可能になります。 フォントサイズ が 変更可能 になります。 アイコンのサイズ が 変更可能 になります。 週足、 月足  の非表示 が 可能 になります。
FREE
多数の通貨を取引している場合、画面をカチャカチャ切り替えの際にどの通貨を見ているか 迷ったことはありませんか。 表示している通貨が大きく表示されるMT4用のインジケーターは あるのですがMT5用がなかったので作成しました。 機能: どの通貨でも表示可能になります。 表示位置 (左上 、 右上 、 左下 、 右下) の 指定 が可能 になります。 表示位置(X軸、Y軸)が変更可能 になります。 フォントの色を 変更可能 になります。 使用するフォント を指定することが可能になります。 フォントサイズ の 変更が可能 になります。 インストール方法: ファイル->データフォルダーを開く->MQL5フォルダー->Indicatorsフォルダー 配下にex5ファイルを置いてMT5を再起動してください。
FREE
RoundNum Readme (Traders Club) 特徴: このツールはDOWやNIKKEIなど500や1000ポイントがラウンドナンバーの 指数を取引する際に表示するように開発しました。 もちろんメジャー通貨でも表示はされます。 更新頻度を制限しているのでチャート表示が遅くなるということは ありません。 XMでDOWを取引される場合、Main Levelsを10000 Sub Levelsを5000にしてください。 各パラメータの説明: Number to display lines:表示するライン数を設定します。 Main Levels:メインレベルをポイントで指定します。 Main Line Color:メインラインの色を設定します。 Main Line Style:メインラインで使用されるラインを設定します。 Show Sub Lines:サブラインを表示するか設定します。 Sub Levels:サブレベルをポイントで指定します。 Sub Line Color:サブラインの色を設定します。 Sub Line Style:サブラインで使用され
FREE
パラボリックのデータをもとにトレンドの方向性を1分足から月足まで表示します。 1分足から 月足 まで表示されているので今どの方向に価格が動いているのかがすぐに分かります。 更新はティク毎ではなくディフォルトでは1秒毎、もちろん変更も可能なのでチャートの表示が遅くなるようなことはありません。 機能: どの通貨でも表示可能になります。 パラボリックの数値を変更することは可能になります。 上昇時と下降時のアイコンの色を指定することが可能になります。 表示位置(Y軸)が変更可能 になります。   表示位置 (左上 、 右上 、 左下 、 右下) が 指定 が可能 になります。 フォント を指定することが可能になります。 フォントサイズ が 変更可能 になります。 アイコンのサイズ が 変更可能 になります。 週足、 月足  の非表示 が 可能 になります。
FREE
特徴: このツールはDOWやNIKKEIなど500や1000ポイントがラウンドナンバーの 指数を取引する際に表示するように開発しました。 もちろんメジャー通貨でも表示はされます。 更新頻度を制限しているのでチャート表示が遅くなるということは ありません。 XMでDOWを取引される場合、Main Levelsを10000 Sub Levelsを5000にしてください。 各パラメータの説明: Number to display lines:表示するライン数を設定します。 Main Levels:メインレベルをポイントで指定します。 Main Line Color:メインラインの色を設定します。 Main Line Style:メインラインで使用されるラインを設定します。 Show Sub Lines:サブラインを表示するか設定します。 Sub Levels:サブレベルをポイントで指定します。 Sub Line Color:サブラインの色を設定します。 Sub Line Style:サブラインで使用されるラインを設定します。 Update Frequency(600
FREE
Time Line (Traders Club)  機能: 昨日高値、安値、本日始値、高値、安値の時間から線を引きます。 時間足により表示する時間が変わります。 1分、5分足では1時間ごとの表示 15分、30分足では4時間ごとの表示 1時間、4時間は12時間ごとの表示 日足以降は時間は表示されません。 高値安値は週足より下位足で表示されます。 各ラベルを変更可能になります。 更新頻度を変更できるのでチャート表示が 重くなることはありません。 各パラメータの説明: Difference hours form Server Time: サーバとの時間差を入力します。 Yesterday High Label:昨日高値のラベルを設定します。 Yesterday Low Label:昨日安値のラベルを設定します。 Show open line:true 始値の線を表示するかどうか Today Open Label:本日始値のラベルを設定します。 Today High Label:本日高値のラベルを設定します。 Today Low Label:本日安値のラベルを設定します。 Lim
特徴: MTF Moving Averageを8本一気に表示してくれるインジケータになります。 8本も必要ない場合にももちろん非表示にできます。 どの通貨でも使用可能になります。 それぞれのMTF Moving Averageの色や太さを変更できます。 各パラメータの説明: Method:MAの種類設定をします。 Applied price:MAで使用する価格を設定をします。 TimeFrame M5:使用するMAの時間足を設定します。 Period M5:使用するMAの期間を設定します。 ※ラベルに関係なく8本のMTF MAはどの時間足でも期間設定可能になります。 Update Frequency(seconds):MTF Moving Averageの再作成更新頻度を入力します。
MA cross AKT (Traders Club)  機能: MAゴールデンクロスで買いサイン、デットクロスで売りサインを表示します。 MAの期間は入力できます。 MAの種類を選択できます。(SMA、EMA、SMMA、LWMA) 適用する価格を選べます。(CLOSE,OPEN,LOW,HIGH,MEDIAN,TYPICAL,WEIGHTED) サインをアラートで通知します。 サイン発生をE-mailやSNSで通知します。 MAクロスの勝率を表示します。 ローソク足の本数を変更することにより過去何か月かの MAクロスの勝率をすぐに確認することができます。 これは各時間足、各通貨で確認することが出来ます。 判定するローソク足を3か所選ぶことが出来ます。 ディフォルトでは5本目、9本目、14本目となっています。 サインの表示をボタンで表示したり消したりできます。 表示するサインを変更することが出来ます。
このEAを使用することにより様々な条件で自動で決済することが可能になります。 詳細な情報はこちらにサイトがあります。 https://toushika.top/ea-takeaprofit/ 条件: 条件1:利確か損切で決済 条件2:利確か損切または反転MAで決済 (ディフォルトでは20MA反転で利確) 条件3:利確か損切またはゴールデンクロス、デットクロスで決済 条件4:利確か損切またはボリンジャーバンドにタッチで決済 条件5:利確か損切またはパラボリックで決済 条件6:利確か損切または設定した水平線で決済 <- 他の通貨で設定した水平線でも決済可能 重要:水平線で決済の際、買いポジションと売りポジションは同時に持てません。 買いポジションがある時に売りポジションを持つとすぐに決済されてしまいます。 反対に売りポジションがる時に買いポジションを持つとすぐに決済されてしまいます のでご注意ください。
PO-Plus Readme 機能: 3つのロジックでの買いサイン、売りサインを表示します。 各ロジックでの勝率を表示します。 サイン表示後、勝率を確認して高い勝率でBOやFXでエントリーすることが出来ます。 勝率の判定本数を変更できます。 Indicator Noを変えることによるこのインジケータを複数適用することができます。 これによりRCIの数値を変更して勝率を複数表示が可能になります。 その際は、ラベルの表示位置も変更してください。 ボタンを押すことによりラベルや買いサイン、売りサインを表示、非表示すことが出来ます。   注意:こちらのロジックはZigZag+ロジックでの勝率になりますので 勝率は実際のものより高めに表示されます。 エントリーする際は勝率60%以上のものを推奨します。 ZigZagベースなので価格が動く日本、欧州、NY時間の前半でのエントリしない ことを推奨します。 各パラメータの説明: ----------Basic Setting---------- Indicator No:インジケータNoを設定します。もし同じチャートに複数適用し
移動平均線クロス、ボリンジャーと移動平均線のクロス、移動平均線の角度でサイン表示 MT5インジケータ こちらに サイト とがあります。 このインジケータは3つのパターンでサインを表示(切り替え可能)します。 ①   移動平均線のクロス ②   ボリンジャーバンドと短期移動平均線とのクロス ③   ボリンジャーバンドと短期移動平均線とのクロスと、中期移動平均線と長期移動平均線の角度 移動平均線のクロス 指定した短期移動平均線と長期移動平均線のゴールデンクロスでは買いサイン、デットクロスでは売りサインを表示します。 ディフォルトでは短期は5,長期は20となっています。 もちろん変更可能になります。 移動平均線の種類をEMA(指数平滑移動平均線)やSMMA(平滑化移動平均)などに変更可能で適する価格も変更可能になります。 ボリンジャーバンドと短期移動平均線のクロス ボリンジャーバンド(以降BB)と短期移動平均線のクロスでサインを表示します。 ディフォルトではBB+1σと5MAのゴールデンクロスで買いサイン、BB-1σと5MAのデットクロスで売りサインでサインを表示します。 BBの期間や、B
このEAを使用することによりワンクリックによる決済、 決済したい通貨のチャートに適用しておけば様々な条件で自動で 決済することが可能になります。 パフォーマンスを考慮しているので動作が非常に軽いです。 新機能:Ver2.3 設定した利益以上になるとSLが建値(BE)に設定 新機能:Ver2.0 資金管理による買いや売りエントリ トレード毎に自動スクリーンショット取得 詳細な情報はこちらにサイトがあります。 https://toushika.top/tc-panel-for-mt5/ 機能: ワンクリックによる全通貨決済 ワンクリックによる表示上の通貨決済 分かりやすいPips表示 移動可能 全通貨での合計Pips表示 自動利確、損切り設定 設定以上のスプレッドになった場合には画面の色が変化 Break Evenラインの表示 チャート画像の保存 決済の通知機能(Email,SNS) パネル位置指定 Pips表示消去 他の通貨で設定した水平線で決済 下記に示した条件での利確 条件による決済: 条件1:利確か損切で決済 条件2:利確か損切また
Time Line for MT5 機能: 昨日高値、安値、本日始値、高値、安値の時間から線を引きます。 時間足により表示する時間が変わります。 1分、5分足では1時間ごとの表示 15分、30分足では4時間ごとの表示 1時間、4時間は12時間ごとの表示 日足以降は時間は表示されません。 高値安値は週足より下位足で表示されます。 各ラベルを変更可能になります。 更新頻度を変更できるのでチャート表示が 重くなることはありません。 各パラメータの説明: Server_Time:6 サーバとの時間差を入力 Yesterday_High_Label:昨日高値 Yesterday_Low_Label:昨日安値 Show_Open:true 始値の線を表示するかどうか Today_Open_Label:本日始値 Today_High_Label:本日高値 Today_Low_Label:本日安値 max_bar:true 使用するバーを制限するかどうか Maxbars:1500 制限を使用した場合に1分では5日分 UpdateFrequency:60 更新頻度、ディフォルトは60秒ご
MTF MA2 for MT5
Koji Kobayashi
3 (1)
MTF-MA2 for MT5 特徴: MTF Moving Averageを8本一気に表示してくれるインジケータになります。 8本も必要ない場合にももちろん非表示にできます。 パフォーマンスを考慮しているのでチャートが重くなるようなことは 無いはずになります。どの通貨でも使用可能になります。 それぞれのMTF Moving Averageの色や太さを変更できます。 各パラメータの説明: Method:MAの種類設定をします。 Applied price:MAで使用する価格を設定をします。 TimeFrame M5:使用するMAの時間足を設定します。 Period M5:使用するMAの期間を設定します。 ※ラベルに関係なく8本のMTF MAはどの時間足でも期間設定可能になります。 Limited bar?:表示に使用するバーを制限するかどうかを設定します。 ※ここをFalseにするとすべてのバーを読み込むことになるのでチャートが重く なるかもしれません。ご注意ください。 Max bars:使用するバーの本数を設定します。過去検証をする場合にはここの値を増やしてくだ
MTF-Candlestick (Traders Club) 特徴: このインジケータは上位足のローソク足を表示します。 この上位足のローソク足を表示のインジケータは特に1分足や 5分足トレーダ用に開発されたものになります。 現在のローソク足で上位足のローソク足を作成する部分 と過去の上位足のローソク足を作成する部分を 分けています。また、更新はティックごとではなく 指定した時間ごとになるので急な価格変動があった場合でも チャートがフリーズした状態には非常になりにくいということになります。 陽線や陰線の色を変更出来たり髭の太さを変更できるので非常に 見やすと思います。 各パラメータの説明: Indicator No:インジケータNoを設定します。もし同じチャートに複数適用したい場合には個々の数字を変更してください。 TimeFrame:表示する時間足を設定します。 Bullish candlestick color:陽線のローソク足の色の指定します。 Bearish candlestick color:陰線のローソク足の色の指定します。 Doji candles
ResiSupo (Traders Club)  このインジケータは直近の高値と安値を抜いたときに何ら方法で 知る方法はないかと思い開発されました。 機能: 指定したローソク足の本数で終値をベースに最高値と最安値の ラインを自動で引きます。 最高値と最安値のラインにタッチするとアラートで通知します。 通知はE-mailやSNSにも送信することができます。 最高値と最安値のラインを終値か高値または安値ベースにするかを選択できます。 Indicator Noを変えることによるこのインジケータを複数適用することができます。 これにより過去80本と20本などでの最高値と最安値のラインを引くことが可能になります。 現在のATRの値を画面に表示します。 これにより現在のボラリティーの状況が一目で分かります。 表示されているSLはディフォルトではATR値の1.5倍になっています。 この数値は現時点でのボラリティーの状況からの損切り幅の目安となります。 ATRのレベルにより表示の色が変わります。 ボタンを押すことによりアラートの通知を無効にできます。 ※ネットワークの不安定な環
新機能:Ver3.5 28通貨ペアの強弱も表示するようにしました。 監視ペアで最強、最弱の通貨ペアとなった場合、四つ葉のマークが出るように変更しました。 15分足、1時間足、4時間足単位での通貨ペアの強弱を表示するようにしました。 詳細な情報はこちらにサイトがあります。 https://toushika.top/tc-cs-plus-cfd/ 注:こちらはTitanのデモ口座で動作します。 XMで使用したい場合は こちらのでセットファイル を使用してください。 機能: 一目で現在の通貨の方向性と強弱が確認できます。 15M,1H,4Hでの方向性を表示します。 15M,1H,4Hでの方向が揃った場合にドットが表示されます。 通貨の相関が揃った場合にドットが表示されます。 ※相関はピアソン相関係数を使用しています。 より詳しい情報につきましてはこちらを参照してください。 https://www.mql5.com/ja/articles/5481 通貨の強弱を表示します。 現時点でのボラリティーの状況を表示します。 過去20日/過去5日/今日のボラリティーを表示しま
機能&特徴: ZigZagをもとに主要なレジスタンスとサポートラインを引きます。 各時間足で押し安値、戻り高値を簡単に把握できます。 現在何波目なのか簡単に把握できます。 ※ トレンド転換時はカウンターは1、継続時は2,3,4..となります。 ※ちなみにこちらはZigZagの谷山を数えています。エリオット波動数ではありません。 現在買い目線でいるべきなのか売り目線なのか簡把握できます。 過去2つのZigZagラインで静的にフィボナッチを引きます。 今の値動きで動的にフィボナッチを引きます。 逆フィボナッチ(静的なフィボナッチのみ)に変更することも可能になります。 ボタンにより以下の操作が可能になります。 1.ZigZagラインの表示、非表示 2.ノーマルフィボナッチ、逆フィボナッチの切り替え ※環境により表示に時間が掛かる場合があります。 3.1分足、5分足、15分足で1つ上のZigZagラインが引けるようになりました。 4.レジスタンスとサポートラインを再描写します。  トレンド継続や変換をアラートで通知します。 エリオット3波発生の
移動平均線クロス、ボリンジャーと移動平均線のクロス、移動平均線の角度でサイン表示 MT5インジケータ こちらに サイト があります。 このインジケータは3つのパターンでサインを表示(切り替え可能)します。 ① 移動平均線のクロス ② ボリンジャーバンドと短期移動平均線とのクロス ③ ボリンジャーバンドと短期移動平均線とのクロスと、中期移動平均線と長期移動平均線の角度 ⓸ ボリンジャーバンドと短期移動平均線とのクロス(サインを交互に表示) 移動平均線のクロス 指定した短期移動平均線と長期移動平均線のゴールデンクロスでは買いサイン、デットクロスでは売りサインを表示します。 ディフォルトでは短期は5,長期は20となっています。 もちろん変更可能になります。 移動平均線の種類をEMA(指数平滑移動平均線)やSMMA(平滑化移動平均)などに変更可能で適する価格も変更可能になります。 ボリンジャーバンドと短期移動平均線のクロス ボリンジャーバンド(以降BB)と短期移動平均線のクロスでサインを表示します。 ディフォルトではBB+1σと5MAのゴールデンクロスで買いサイン、BB-1σと5MAのデット
MT5インジケータ TC-Alerts 開発経緯: 実はFXで簡単に勝てる手法があるんです。 それは。。。 主要な(4時間足以上、4時間足、日足、週足)のレジスタンスとサポートラインの反発を狙う FXは一方向には進まず90%以上で 必ず、必ずと言っていいほど、 どこかで反発します 。そこは大抵主要なレジスタンスとサポートラインまたは主要なフィボナッチラインなのです。 なのでそこに水平線を引いて ただ待つ のです。そこに到達したら、1分足や5分足に落として 長いヒゲ、ダブルボトム、ダブルヘッド、トリプルボトム、トリプルヘッド、三尊、逆三尊などの反転の形成を確認してエントリーする。 または、こちらを使用して https://www.mql5.com/ja/market/product/53987 強弱が弱くなってきたのを確認してエントリーすればいいのです。 これだけです。シンプルです!! うまく行くと、長期足レベルでレジスタンスとサポートライン間、つまり頭から尻尾まで取れる可能性もありますし、リスクリワードが異常にいいです。 そのためには、チャートに主要なレジスタンスとサポートラインに
ボリンジャーバンドは、価格変動を分析するためのテクニカル分析の1つのツールになります。 ボリンジャーバンドには、中心線と2つのバンドがあります。 中心線は、一般的には移動平均線(通常は20日間の単純移動平均)として計算されます。この中心線は、一定期間の価格の平均値を表しています。 ボリンジャーバンドのバンドは、中心線の上と下に等間隔で配置されます。通常は中心線から2つの標準偏差分だけ離れた位置に設定されます。 拡大(Expansion)とは、ボリンジャーバンドが広がる状態を指します。 つまり、上下のバンドが中心線から離れ、価格の変動範囲が広がっていることを示します。拡大は、相場が活発になり、価格の大幅な変動が起こりやすいことを示すことがあります。 収縮(Contraction)とは、ボリンジャーバンドが狭くなる状態を指します。 つまり、上下のバンドが中心線に近づき、価格の変動範囲が狭まっていることを示し、相場が方向感を失い、一時的に価格変動が鈍化していることを示すことがあります。 ボリンジャーバンドの収縮と拡大は、価格変動のパターンや相場の特徴を捉えるために重要な指標になり
TC-Supportは手動取引とEA運用のために開発されたパネルになります。 このパネルでは、リスクリワード、リスク計算、リスク管理など資金管理、 トレーリングストップ機能、ブレークイーブンなどポジション管理が可能になります。 その他、便利な機能があります。 詳細な情報はこちらにサイトがあります。 デモ口座で動作するEAはこちらに置いてあります。   https://toushika.top/ mt5-tc-support / Disable Auto Trading  の 機能はMQL5では外部のDLLの利用は許可されませんので使用できません。 おもな機能一覧 資金管理 リスクリワード計算 ロット計算 損失金額計算 最大ロット数の設定 設定したリスクパーセンテージでヘッジポジション EA運用 最大損失金額またはパーセンテージによる強制クローズ EA運用 資金破綻回避  ポジション管理 成行、指値、Stop Limit注文に対応 ポジションを部分的にクローズ トレーリングストップ機能 一定の距離を超えてたらSLを移動 利確条件設定
Filtro:
Nessuna recensione
Rispondi alla recensione