Trend Follower LukaHo
- Indicatori
- Versione: 3.10
- Aggiornato: 5 ottobre 2026
- Attivazioni: 6

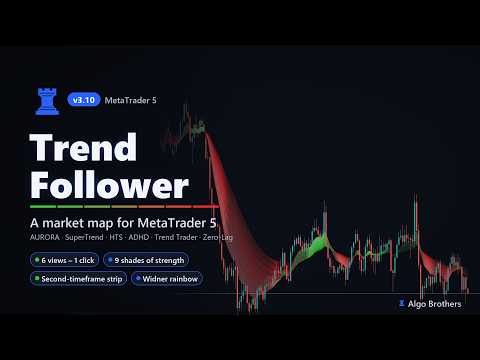
Trend Follower — a trend map for MetaTrader 5
Trend Follower does not tell you where to buy or sell. It shows where the market is: uptrend, downtrend or consolidation, and whether the current trend is gaining or losing strength. You read the map and make the decision.
HOW TO READ IT
- Green — uptrend. Red — downtrend.
- Shade — a full, strong color means the trend is in force. When momentum fades, the color fades step by step; in a consolidation it is at its palest. When the trend accelerates again, the full color comes back.
- Up to 9 shades with smooth transitions — no abrupt color jumps.
- By default the current candle is shown live; the optional closed-candle mode hides the forming candle, so nothing is redrawn.
SIX VIEWS OF THE SAME MARKET — one click on the chart
- AURORA — a rainbow trend ribbon of 8 moving averages (EMA 8–36 by default). Presets Fast, Standard, Slow and Widner rainbow (each line smooths the previous one — the smoothest ribbon). A band in the opposite color shows that the fast averages have already turned.
- HTS Bands — a fast band (teal) and a slow band (crimson) built from highs and lows; the saturation follows the trend strength.
- ADHD Scalp — a fast channel of highs and lows for short-term direction.
- Trend Trader — a fan of up to 10 moving averages, each with its own period, color and line style (Fibonacci, Guppy and Classic 20-50-100-200 presets).
- Zero-Lag — a low-lag average with slope detection (trend / flat) and one sensitivity setting: Fast, Normal or Slow.
- SuperTrend — the classic ATR trailing line with a cloud between price and the line.
Switch views with the buttons in the chart corner — no settings dialog needed. The selected view is remembered for every chart.
SECOND TIMEFRAME STRIP
A thin strip under the chart shows the same map calculated on another timeframe — by default the next higher one (M5/M15 → H1, H1 → H4, H4 → D1). Pick any of the 21 MetaTrader timeframes with the arrow buttons on the strip. The bell button plays a sound when the chart and the strip start to show the same direction.
CONSOLIDATION AND TREND PHASE
- Consolidation is detected from the price itself: a narrow range measured in ATR. Wide, fast swings are shown as trends, not as consolidation.
- The trend phase (strengthening / weakening) is read from price momentum in ATR units, so it works the same on gold, indices, currencies and crypto, on any timeframe. Settings were calibrated on 5 markets × 3 timeframes and checked on out-of-sample data.
ALERTS
Popup, push notification or sound when the market state changes on a closed candle: a new uptrend, a new downtrend and (optionally) the start of a consolidation.
DATA WINDOW
Market state (+1 / 0 / −1), trend phase (+1 strong / −1 fading / 0 flat), trend strength (0–100).
DETAILS
- 10 moving-average types: SMA, EMA, WMA, RMA, DEMA, TEMA, VWMA, HMA, LSMA, ZLSMA.
- Dark / light / automatic theme; the candles stay above the clouds.
- Smooth on any zoom: when you zoom far out, the clouds switch to a single shade automatically and return to full shading when you zoom in.
- Presets for AURORA, SuperTrend and Trend Trader — one choice instead of many numbers.
- Several copies on one chart: the first one keeps the buttons and the strip, the others draw only their map.
- No DLL, no WebRequest. Works on any symbol and timeframe.
The indicator is an analytical tool, not a trading system.