PriceRunner

5
Indicatore PriceRunner progettato per il rilevamento delle tendenze senza l'effetto di salti di prezzo accidentali.
Utilizza Price Series e alcune medie mobili per la riduzione del rumore.
Funziona su più tempi, anche M1.
Per aumentare l'efficacia, si consiglia di utilizzare i parametri predefiniti per la grafica M1 (vedi screenshot).
Puoi modificare le impostazioni per altri intervalli di tempo.
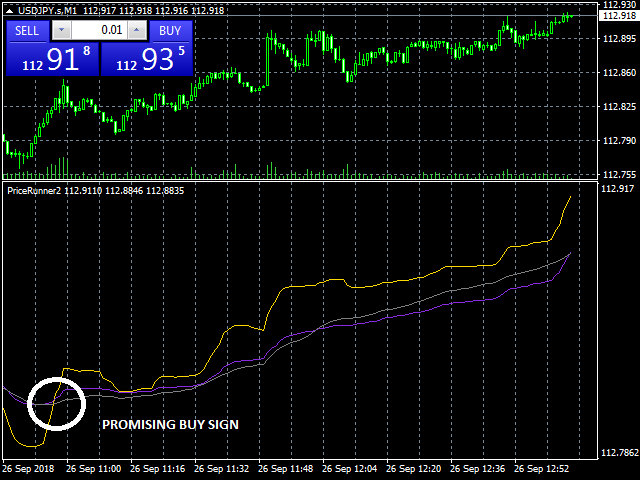
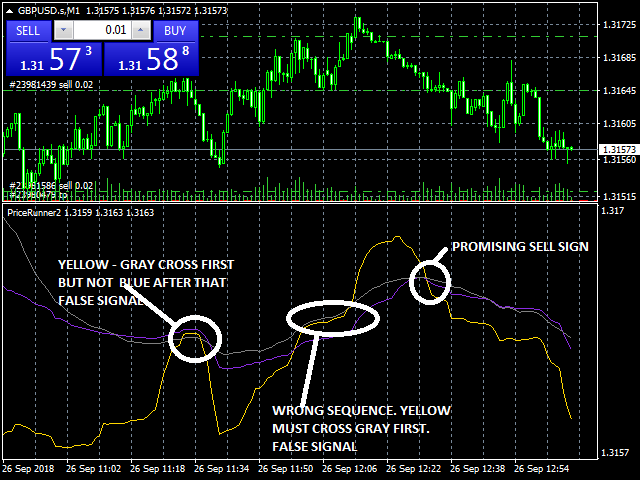
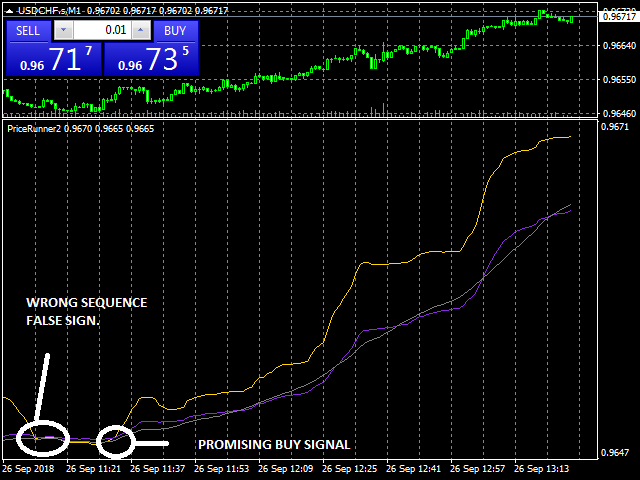
Esempio di utilizzo di questo indicatore: se l'oro attraversa il blu verso il basso e sia l'oro che il blu sotto il grigio, potrebbe essere un segnale di vendita promettente.

Per ottenere il segnale da questo indicatore (per utenti professionisti esperti): Oro: buffer nr. 0, Blu: tampone nr. 1, grigio: tampone nr. 2
Questo indicatore utilizza la stessa logica e calcola "l'indicatore TripleS" ma disegna in finestre separate non nella finestra del grafico. Se hai venduto "Indicatore TripleS" prima, non ti consiglio di vendere anche questo. Guarda lo screenshot e prova prima la demo.
Parametri di input
Periodo: periodo di ricerca, il valore predefinito è 10.
Period2: periodo di ricerca, il valore predefinito è 10.
Period3: periodo di ricerca, il valore predefinito è 21.
xfast: MA veloce, il valore predefinito è 2.
xfast2: MA veloce, il valore predefinito è 5.
xfast3: MA veloce, il valore predefinito è 8.
xslow: MA lento, il valore predefinito è 30.
xslow2: MA lento, il valore predefinito è 30.
xslow3: MA lento, il valore predefinito è 13.
Recensioni 1
Gino De Andrea Calvo
2473
Gino De Andrea Calvo 2018.10.30 21:59 
 

Great Indicator, it really helps for taking a short or long position combined with your own strategy,

Prodotti consigliati
Owl smart levels
Sergey Ermolov
4.24 (37)
Versione MT5  |  FAQ L' indicatore Owl Smart Levels   è un sistema di trading completo all'interno dell'unico indicatore che include strumenti di analisi di mercato popolari come i   frattali avanzati di Bill Williams , Valable ZigZag che costruisce   la corretta struttura a onde   del mercato, e i   livelli di Fibonacci che segnano i livelli esatti di entrata nel mercato e luoghi per prendere profitti. Descrizione dettagliata della strategia Istruzioni per lavorare con l'indicatore Consulente-
VR Cub
Vladimir Pastushak
VR Cub è un indicatore per ottenere punti di ingresso di alta qualità. L'indicatore è stato sviluppato per facilitare i calcoli matematici e semplificare la ricerca dei punti di ingresso in una posizione. La strategia di trading per la quale è stato scritto l'indicatore ha dimostrato la sua efficacia per molti anni. La semplicità della strategia di trading è il suo grande vantaggio, che consente anche ai trader alle prime armi di commerciare con successo con essa. VR Cub calcola i punti di apert
L'indicatore costruisce le quotazioni attuali, che possono essere confrontate con quelle storiche e su questa base fanno una previsione del movimento dei prezzi. L'indicatore ha un campo di testo per una rapida navigazione fino alla data desiderata. Opzioni: Simbolo - selezione del simbolo che visualizzerà l'indicatore; SymbolPeriod - selezione del periodo da cui l'indicatore prenderà i dati; IndicatorColor - colore dell'indicatore; HorisontalShift - spostamento delle virgolette disegnate d
The   Trendlines Oscillator   helps traders identify trends and momentum based on the normalized distances between the current price and the most recently detected bullish and bearish trend lines. The indicator features bullish and bearish momentum, a signal line with crossings, and multiple smoothing options. USAGE The   Trendlines Oscillator   works by systematically: Identifying pivot highs and lows. Connecting pivots to form bullish (support) and bearish (resistance) trendlines. Measuring
Trend PA
Mikhail Nazarenko
5 (3)
The Trend PA indicator uses   Price Action   and its own filtering algorithm to determine the trend. This approach helps to accurately determine entry points and the current trend on any timeframe. The indicator uses its own algorithm for analyzing price changes and Price Action. Which gives you the advantage of recognizing, without delay, a new nascent trend with fewer false positives. Trend filtering conditions can be selected in the settings individually for your trading style. The indicator
Trendiness Index
Libertas LLC
5 (3)
"The trend is your friend" is one of the best known sayings in investing, because capturing large trendy price movements can be extremely profitable. However, trading with the trend is often easier said than done, because many indicators are based on price reversals not trends. These aren't very effective at identifying trendy periods, or predicting whether trends will continue. We developed the Trendiness Index to help address this problem by indicating the strength and direction of price trend
Nuova versione più accurata dell'indicatore Xmaster. Più di 200 trader di tutto il mondo hanno condotto più di 15.000 test di diverse combinazioni di questo indicatore sui loro PC per ottenere la formula più efficace e precisa. E qui ti presentiamo l'indicatore "Xmaster formula indicator forex no repaint", che mostra segnali accurati e non ridipinge. Questo indicatore invia anche segnali al trader tramite e-mail e push. Con l'arrivo di ogni nuovo tick, analizza costantemente il mercato in base
MACD Display is a MACD disaplay and cross monitoring indicator,which can works on 6 timeframe at same time. Indicator advantage: 1. Deviation from the point can be drawn on the main picture and indicator drawing. It is convenient to observe and can be hidden or displayed by parameter setting. 2. Deviation from the entry point is clearly indicated by the arrow in the drawing. 3. Cross-cycle monitoring can simultaneously monitor the MACD deviation and the golden dead fork of the six-cycle framewor
Alpha Trend sign has been a very popular trading tool in our company for a long time. It can verify our trading system and clearly indicate trading signals, and the signals will not drift. Main functions: Based on the market display of active areas, indicators can be used to intuitively determine whether the current market trend belongs to a trend market or a volatile market. And enter the market according to the indicator arrows, with green arrows indicating buy and red arrows indicating se
Power Renko MT4
Pierce Vallieres
Power Renko is an indicator which plots Renko bricks underneath the chart using a histogram. You can select the brick size and the timeframe of the Renko bricks as well as whether or not to use the close price or the high/low price of the candles. Renko bricks are based on price alone, not time, therefor the Renko bricks will not be aligned with the chart's time. They are extremely useful for trend trading and many different strategies can be formed from them. Buffers are provided allowing you t
The indicator displays the data of the Stochastic oscillator from a higher timeframe on the chart. The main and signal lines are displayed in a separate window. The stepped response is not smoothed. The indicator is useful for practicing "manual" forex trading strategies, which use the data from several screens with different timeframes of a single symbol. The indicator uses the settings that are identical to the standard ones, and a drop-down list for selecting the timeframe. Indicator Paramet
Auto Fibo Pro m
DMITRII GRIDASOV
Indicatore "Auto FIBO Pro" Crypto_Forex: è un ottimo strumento ausiliario nel trading! - L'indicatore calcola e posiziona automaticamente sul grafico i livelli di Fibo e le linee di tendenza locali (colore rosso). - I livelli di Fibonacci indicano le aree chiave in cui il prezzo può invertirsi. - I livelli più importanti sono 23,6%, 38,2%, 50% e 61,8%. - Puoi usarlo per lo scalping di inversione o per il trading di zone grid. - Ci sono molte opportunità per migliorare il tuo sistema attuale us
Delta Fusion Pro
Francesco Secchi
5 (2)
Delta Fusion Pro – Analisi Avanzata del Flusso Ordini per il Trading Intraday Delta Fusion Pro è un indicatore professionale per MetaTrader 4 che rivela il flusso degli ordini aggressivi, mostrando in tempo reale l’intensità e la direzione della pressione istituzionale. A differenza dei classici indicatori volumetrici, analizza la differenza (delta) tra i volumi Ask e Bid per anticipare inversioni, confermare trend e individuare zone di interesse professionale. Caratteristiche Principali Siste
Based on MACD indicator waves with standard parameters Applies Fibonacci levels to the last two MACD waves, positive and negative respectively, if at the moment the MACD indicator runs out of negative Wave - the color is green, if at the moment the MACD indicator runs out of positive Wave - the color is red. The Wave termination criterion is two ticks with a different MACD sign. Applies trend lines on the last four MACD Waves. Works well with the expert Figures MACD   https://www.mql5.com/ru/mar
Nice Trade Point
Muhammed Emin Ugur
This    Nice Trade Point     indicator is designed for signal trading. This indicator generates trend signals. It uses many algorithms and indicators to generate this signal. It tries to generate a signal from the points with the highest trend potential. This indicator is a complete trading product. This indicator does not need any additional indicators. The indicator certainly does not repaint. The point at which the signal is given does not change.     Features and Suggestions Time Frame
PipFinite Trend PRO
Karlo Wilson Vendiola
4.88 (2249)
Breakthrough Solution For Trend Trading And Filtering With All Important Features Built Inside One Tool! Trend PRO's smart algorithm detects the trend, filters out market noise and gives entry signals with exit levels. The new features with enhanced rules for statistical calculation improved the overall performance of this indicator. Important Information Revealed Maximize the potential of Trend Pro, please visit www.mql5.com/en/blogs/post/713938 The Powerful Expert Advisor Version Automatin
Indicatore Crypto_Forex HTF Ichimoku per MT4. - L'indicatore Ichimoku è uno degli indicatori di tendenza più potenti. HTF significa - Higher Time Frame. - Questo indicatore è eccellente per i Trend Trader e anche in combinazione con le voci Price Action. - L'indicatore HTF Ichimoku consente di collegare Ichimoku da un timeframe più elevato al grafico corrente. - Trend rialzista: linea rossa sopra quella blu (ed entrambe le linee sono sopra la nuvola) / Trend ribassista: linea rossa sotto quell
Magic Balance
Daniil Evstratenko
The indicator shows which trading pairs, strategies, robots and signals that you use are profitable and which are not. The statistic of trades and balance graph are displayed in the account currency and pips - to switch simply click on the graph. button "$"(top left) - minimize/expand and move the indicator panel button ">"(bottom right) - stretching and resetting to the original size Statistic of trades 1 line - account balance, current profit and lot of open trades; 2 line - the number of all
Italo Trend Indicator
Italo Santana Gomes
4.76 (33)
BUY INDICATOR AND GET EA FOR FREE AS A BONUS + SOME OTHER GIFTS! ITALO TREND INDICATOR  is the best trend indicator on the market, the Indicator works on all time-frames and assets, indicator built after 7 years of experience on forex and many other markets. You know many trend indicators around the internet are not complete, does not help, and it's difficult to trade, but the Italo Trend Indicator is different , the Italo Trend Indicator shows the signal to buy or sell, to confirm the signal t
Extremum Search
Svyatoslav Kucher
Extremum Search is designed to search for extremes, places where the price is likely to reverse and the current trend is likely to change to the opposite. With certain settings, the indicator can be used to define the current trend. The indicator works with any symbol provided that you have sufficient history data for a timeframe the indicator is launched at. It is recommended to attach Extremum Search on the timeframes from M1 to D1. Its calculations use 19 methods, which are selected by a cert
Trendes
Andriy Sydoruk
The Trendes indicator works on all currency pairs and on all timeframes. The arrows indicate favorable moments and directions for entering the market. The probability of a successful trend is very high. Trendes can be used for both small pits and long-term trading. The indicator determines the entry points according to the methods described in the book "How to play and win on the stock exchange". Options LengthA  - The number of bars for calculating the first function; LengthB - The number of b
Trend Oscillator - è un indicatore Crypto_Forex personalizzato avanzato, uno strumento di trading efficiente! - Viene utilizzato un nuovo metodo di calcolo avanzato - 20 opzioni per il parametro "Prezzo per calcolo". - L'oscillatore più fluido mai sviluppato. - Colore verde per i trend al rialzo, colore rosso per i trend al ribasso. - Valori di ipervenduto: inferiori a 5, valori di ipercomprato: superiori a 95. - Ci sono molte opportunità per aggiornare anche le strategie standard con questo i
VSA Histogram
Richard Bystricky
VSA - P (Volume Spread Analysis) Period-Based Histogram is a tool that visually represents market volume dynamics using Volume Spread Analysis principles, with a focus on highlighting key volume changes over specific time periods. The histogram captures changes in volume and price spread relationships in real-time, enabling traders to detect early signals of accumulation, distribution, and shifts in buying or selling pressure. Indicator is non repainting and working with real-time on tick data.
Rainbow Price Visualizer v1.21 See where the market really breathes. Turns your MT4 chart into an ultra-precise heatmap that highlights price zones favored by big players. Why it matters 300 price levels at 0.2‑pip resolution — microscopic detail. 8 visual themes (Rainbow, Fire, Ocean…) for instant readibility. Smart opacity: low noise fades, real zones pop. Lightweight rendering with automatic cleanup. Fully customizable: saturation, opacity, resolution, history depth. Bands project into the f
Trend Ray
Andriy Sydoruk
The indicator shows the potential trend direction by cyclical-wave dependence. Thus, all the rays of the intersection will be optimal rays, in the direction of which the price is expected to move, taking into account the indicator period. Rays can be used as a direction for potential market movement. But we must not forget that the approach must be comprehensive, the indicator signals require additional information to enter the market.
Day Pattern
Oleksandr Martsynyshen
Description: - D ay Pattern - an indicator that helps to identify patterns of price changes for the development of trading algorithms and strategies. For whom this tool? - For developers of trading strategies and algorithms. - Medium- and long-term traders. Time frames H1-W1. Features of the indicator: - There is a function of exporting indicator values to a file of the csv format. - Using the information panel, you can conduct an express analysis of trading tool. - The indicator is sui
MarketProfile EForex
Veridiana Adorno Kendrick
Market Profile Shows where the price has spent more time, highlighting important levels that can be used in trading. It is a powerful tool which is designed to take the fundamental components which comprise every market; price/volume/time, and visually display their relationship in real-time as the market develops for a pre-determined time period. Very powerful tool!
Trade history MT4
Andriy Konovalov
5 (2)
The indicator plots charts of profit taken at the Close of candles for closed (or partially closed) long and short orders individually. The indicator allows to filter orders by the current symbol, specified expert ID (magic number) a nd the presence (absence) of a substring in a order comment , to set the start time and the periodicity of profit reset (daily, weekly or monthly) to calculate the profit chart. The indicator also displays the floating (not fixed) profit of the opened orders at the
[ZhiBiCCI] indicators are suitable for all cycle use, and are also suitable for all market varieties. [ZhiBiCCI] Green solid line is a reversal of bullish divergence. The green dotted line is a classic bullish divergence. [ZhiBiCCI] The solid line to the red is a reverse bearish divergence. The red dotted line is a classical bearish divergence. [ZhiBiCCI] can be set in the parameters (Alert, Send mail, Send notification), set to (true) to send instant signals to the alarm window, email, insta
AW Heiken Ashi
AW Trading Software Limited
AW Heiken Ashi — Indicatore intelligente di trend e livelli di TP. Indicatore avanzato basato sul classico Heiken Ashi, adattato ai trader, con maggiore flessibilità e chiarezza. A differenza dell'indicatore standard, AW Heiken Ashi aiuta ad analizzare il trend, a determinare gli obiettivi di profitto e a filtrare i falsi segnali, fornendo decisioni di trading più affidabili. Guida all'installazione e istruzioni - Qui / Versione MT5 - Qui Vantaggi di AW Heiken Ashi: Funziona su qualsiasi risorsa
Gli utenti di questo prodotto hanno anche acquistato
Volatility Trend System - un sistema di trading che fornisce segnali per le voci. Il sistema di volatilità fornisce segnali lineari e puntuali nella direzione del trend, nonché segnali per uscirne, senza ridisegnare e ritardi. L'indicatore di tendenza monitora la direzione della tendenza a medio termine, mostra la direzione e il suo cambiamento. L'indicatore di segnale si basa sui cambiamenti della volatilità e mostra gli ingressi nel mercato. L'indicatore è dotato di diversi tipi di avvisi. Pu
Smc Blast Signal
Mohit Dhariwal
5 (3)
Full Fledged EA and Alert plus for alerts will also be provided in this offer along with the purchase of Indicator. Limited copies only at this price and Ea too. Grab your copy soon Alert plus for indicator with set file is kept in comment section with the image  SMC Blast Signal with FVG, BOS and trend Breakout The SMC Blast Signal is a Precise trading system for Meta Trader 4 that uses Smart Money Concepts (SMC), including Fair Value Gaps (FVG) and Break of Structure (BOS), to identify high-pr
Scalper Inside PRO
Alexey Minkov
4.74 (69)
An exclusive indicator that utilizes an innovative algorithm to swiftly and accurately determine the market trend. The indicator automatically calculates opening, closing, and profit levels, providing detailed trading statistics. With these features, you can choose the most appropriate trading instrument for the current market conditions. Additionally, you can easily integrate your own arrow indicators into Scalper Inside Pro to quickly evaluate their statistics and profitability. Scalper Inside
Se acquisti questo indicatore, riceverai il mio Trade Manager Professionale   + EA  GRATUITAMENTE. Innanzitutto è importante sottolineare che questo sistema di trading è un indicatore Non-Repainting, Non-Redrawing e Non-Lagging, il che lo rende ideale sia per il trading manuale che per quello automatico. Corso online, manuale e download di preset. Il "Sistema di Trading Smart Trend MT5" è una soluzione completa pensata sia per i trader principianti che per quelli esperti. Combina oltre 10 indic
Dynamic Forex28 Navigator
Bernhard Schweigert
4.43 (7)
Dynamic Forex28 Navigator - Lo strumento di trading Forex di nuova generazione. ATTUALMENTE SCONTATO DEL 49%. Dynamic Forex28 Navigator è l'evoluzione dei nostri indicatori popolari di lunga data, che combinano la potenza di tre in uno: Advanced Currency Strength28 Indicator (695 recensioni) + Advanced Currency IMPULSE con ALERT (520 recensioni) + CS28 Combo Signals (Bonus). Dettagli sull'indicatore https://www.mql5.com/en/blogs/post/758844 Cosa offre l'indicatore di forza di nuova generazione?
First 25 copies at $80, after that price becomes $149 (3 copies left) Gold Signal Pro is a powerful MT4 indicator designed to help traders spot strong price reactions in the market. It focuses on clear wick rejections , showing when price strongly rejects a level and often continues in the same direction. Gold Signal Pro is mainly built for scalping gold (XAUUSD) and works best on lower timeframes like M5 and M15 , where timing matters most. That said, it can also be used on any forex pair, a
Trend indicator AI
Ramil Minniakhmetov
4.7 (80)
Trend Ai indicator è un ottimo strumento che migliorerà l'analisi di mercato di un trader combinando l'identificazione della tendenza con punti di ingresso utilizzabili e avvisi di inversione. Questo indicatore consente agli utenti di navigare nelle complessità del mercato forex con fiducia e precisione Oltre ai segnali primari, l'indicatore Ai di tendenza identifica i punti di ingresso secondari che si presentano durante i pullback o i ritracciamenti, consentendo ai trader di capitalizzare le
Attualmente 40% di sconto! La soluzione migliore per ogni principiante o trader esperto! Questo software per cruscotti funziona su 28 coppie di valute. Si basa su 2 dei nostri indicatori principali (Advanced Currency Strength 28 e Advanced Currency Impulse). Offre un'ottima panoramica dell'intero mercato Forex. Mostra i valori di forza delle valute avanzate, la velocità di movimento delle valute e i segnali per 28 coppie Forex in tutti i (9) timeframe. Immaginate come migliorerà il vostro tra
System Trend Pro
Aleksandr Makarov
5 (2)
System Trend Pro - This is the best trend trading indicator!!! The indicator no repaint!!!  The indicator has   MTF   mode, which adds confidence to trading on the trend (   no repaint   ). How to trade? Everything is very simple, we wait for the first signal (big arrow), then wait for the second signal (small arrow) and enter the market in the direction of the arrow. (See screens 1 and 2.) Exit on the opposite signal or take 20-30 pips, close half of it, and keep the rest until the opposite
Advanced Currency IMPULSE with ALERT
Bernhard Schweigert
4.91 (489)
ATTUALMENTE SCONTATO DEL 40%! La soluzione migliore per ogni principiante o trader esperto! Questo indicatore è uno strumento di trading unico, di alta qualità e conveniente perché abbiamo incorporato una serie di caratteristiche proprietarie e una formula segreta. Con un solo grafico fornisce avvisi per tutte le 28 coppie di valute. Immaginate come migliorerà il vostro trading perché sarete in grado di individuare l'esatto punto di innesco di una nuova tendenza o opportunità di scalping! Co
Advanced Supply Demand
Bernhard Schweigert
4.91 (297)
Speciale Trading- SCONTO DEL 40% La soluzione migliore per qualsiasi trader principiante o esperto! Questo indicatore è uno strumento di trading unico, di alta qualità e conveniente, perché abbiamo incorporato una serie di funzionalità proprietarie e una nuova formula. Con questo aggiornamento, potrai visualizzare doppie zone di timeframe. Non solo potrai visualizzare un TF più alto, ma anche entrambi, il TF del grafico e il TF più alto: MOSTRA ZONE ANNIDATE. Tutti i trader che operano con Of
Shogun Trade
Yuki Miyake
5 (2)
SHOGUN Trade - The Shocking Truth of 16 Years Unoptimized. Shogun Trading February Special Sale – Only $99 (Regular Price $199)! This special offer is available until February 28th . As we are dedicated to further product development and optimization , we are offering this discount in exchange for your valuable feedback. Your insights will directly influence our next round of updates and feature enhancements. Price: $99 (Special discount from $199) Requirement: Please leave a review and share
Pulse Scalping Line - an indicator for identifying potential pivot points. Based on this indicator, you can build an effective Martingale system. According to our statistics, the indicator gives a maximum of 4 erroneous pivot points in a series. On average, these are 2 pivot points. That is, the indicator shows a reversal, it is erroneous. This means that the second signal of the indicator will be highly accurate. Based on this information, you can build a trading system based on the Martingale
Presenting one-of-a-kind Gann Indicator for XAUUSD IQ Gold Gann Levels is a non-repainting, precision tool designed exclusively for XAUUSD/Gold intraday trading. It uses W.D. Gann’s square root method to plot real-time support and resistance levels, helping traders spot high-probability entries with confidence and clarity. William Delbert Gann (W.D. Gann) was an exceptional market analyst whose trading technique was based on a complex blend of mathematics, geometry, astrology, and ancient calcul
Questo cruscotto mostra gli ultimi pattern armonici disponibili per i simboli selezionati, in modo da risparmiare tempo ed essere più efficienti / versione MT5 . Indicatore gratuito: Basic Harmonic Pattern Colonne dell'indicatore Symbol : vengono visualizzati i simboli selezionati Trend: rialzista o ribassista Pattern: tipo di pattern (gartley, butterfly, bat, crab, shark, cypher o ABCD) Entry: prezzo di ingresso SL: prezzo di stop loss TP1: 1 prezzo di take profit TP2: 2 prezzo di take pr
FX Power MT4 NG
Daniel Stein
4.95 (21)
FX Power: Analizza la Forza delle Valute per Decisioni di Trading Più Intelligenti Panoramica FX Power è lo strumento essenziale per comprendere la reale forza delle principali valute e dell'oro in qualsiasi condizione di mercato. Identificando le valute forti da comprare e quelle deboli da vendere, FX Power semplifica le decisioni di trading e rivela opportunità ad alta probabilità. Che tu segua le tendenze o anticipi inversioni utilizzando valori estremi di Delta, questo strumento si adatta
RFI levels PRO
Roman Podpora
5 (1)
Indicatore in anticipo   determina i livelli e le zone di inversione del mercato , consente di attendere che il prezzo ritorni al livello ed entrare all'inizio di un nuovo trend, e non alla sua fine. Lui mostra   livelli di inversione   dove il mercato conferma un cambio di direzione e forma un ulteriore movimento. L'indicatore funziona senza ridisegnare, è ottimizzato per qualsiasi strumento e rivela il suo massimo potenziale quando abbinato al   LINEE DI TENDENZA PRO   indicatore. Scanner st
Trend Arrow Super
Aleksandr Makarov
5 (2)
Trend Arrow Super The indicator not repaint or change its data. A professional, yet very easy to use Forex system. The indicator gives accurate BUY\SELL signals. Trend Arrow Super is very easy to use, you just need to attach it to the chart and follow simple trading recommendations. Buy signal: Arrow + Histogram in green color, enter immediately on the market to buy. Sell signal: Arrow + Histogram of red color, enter immediately on the market to sell.
Un indicatore tecnico che struttura i grafici e identifica i movimenti ciclici dei prezzi. Può funzionare su qualsiasi grafico. Diversi tipi di notifiche. Ci sono altre frecce sul grafico stesso. Senza ridisegnare la storia, lavora sulla chiusura della candela. TF consigliati da M5 in su. Parametri facili da usare e configurare. Se si utilizzano 2 indicatori con parametri diversi, è possibile utilizzarli senza altri indicatori. Ha 2 parametri di input Ciclicità e durata del segnale Questi 2 pa
True SnD
Indra Lukmana
5 (1)
This Supply & Demand indicator uses a unique price action detection to calculate and measures the supply & demand area. The indicator will ensure the area are fresh and have a significant low risk zone. Our Supply Demand indicator delivers functionality previously unavailable on any trading platform. Trading idea You may set pending orders along the supply & demand area. You may enter a trade directly upon price hit the specific area (after a rejection confirmed). Input parameters Signal - Set
Meravith
Ivan Stefanov
5 (1)
L'indicatore analizza il volume da ogni punto e calcola i livelli di esaurimento del mercato per quel volume. È composto da tre linee: Linea di esaurimento del volume rialzista Linea di esaurimento del volume ribassista Una linea che indica la tendenza del mercato. Questa linea cambia colore per riflettere se il mercato è rialzista o ribassista. Puoi analizzare il mercato da qualsiasi punto di partenza tu scelga. Una volta che una linea di esaurimento del volume è raggiunta, identifica un nuovo
Beast Super Signal
Dustin Vlok
4.73 (89)
Alla ricerca di un potente indicatore di trading forex che possa aiutarti a identificare facilmente opportunità di trading redditizie? Non guardare oltre il Super Segnale Bestia. Questo indicatore basato sulle tendenze di facile utilizzo monitora continuamente le condizioni del mercato, cercando nuove tendenze in via di sviluppo o saltando su quelle esistenti. Il Beast Super Signal fornisce un segnale di acquisto o di vendita quando tutte le strategie interne sono allineate e sono al 100% in con
Atomic Analyst
Issam Kassas
5 (3)
Innanzitutto, vale la pena sottolineare che questo indicatore di trading non è repaint, non è ridisegno e non presenta ritardi, il che lo rende ideale sia per il trading manuale che per quello automatico. Manuale utente: impostazioni, input e strategia. L'Analista Atomico è un indicatore di azione del prezzo PA che utilizza la forza e il momentum del prezzo per trovare un miglior vantaggio sul mercato. Dotato di filtri avanzati che aiutano a rimuovere rumori e segnali falsi, e aumentare il pote
KATANA Scalper for MT4 Product Overview Click here for the simple version: https://www.mql5.com/en/market/product/161751 KATANA Scalper for MT4 is an advanced technical analysis indicator optimized for the MetaTrader 4 platform. It is designed to solve the two biggest challenges in short-term trading (scalping and day trading): "price noise" and "reaction lag." Using a unique signal processing algorithm, it eliminates superficial market fluctuations and extracts the "core momentum" with high
GOLD Impulse with Alert
Bernhard Schweigert
4.64 (11)
Questo indicatore è una super combinazione dei nostri 2 prodotti Advanced Currency IMPULSE with ALERT  +   Currency Strength Exotics . Funziona per tutti i time frame e mostra graficamente l'impulso di forza o debolezza per le 8 valute principali più un simbolo! Questo indicatore è specializzato nel mostrare l'accelerazione della forza delle valute per qualsiasi simbolo come oro, coppie esotiche, materie prime, indici o futures. Primo nel suo genere, qualsiasi simbolo può essere aggiunto all
Trend Screener
STE S.S.COMPANY
4.79 (95)
Indicatore di tendenza, soluzione unica rivoluzionaria per il trading di tendenze e il filtraggio con tutte le importanti funzionalità di tendenza integrate in un unico strumento! È un indicatore multi-timeframe e multi-valuta al 100% non ridipingibile che può essere utilizzato su tutti i simboli/strumenti: forex, materie prime, criptovalute, indici e azioni. OFFERTA A TEMPO LIMITATO: l'indicatore di screening di supporto e resistenza è disponibile a soli 50$ e a vita. (Prezzo originale 250$) (o
Quantum Entry is a powerful price action trading system built on one of the most popular and widely known strategies among traders: the Breakout Strategy! This indicator produces crystal clear buy and sell signals based on breakouts of key support and resistance zones. Unlike typical breakout indicators, it uses advanced calculations to accurately confirm the breakout! When a breakout occurs, you receive instant alerts. No lag and no repaint :  All signals are delivered in real-time, with no lag
Volatility Master for MetaTrader is a real-time dashboard tool that scans up to 56 symbols using up to 2 flexible dashboards on different charts to identify high-volatility, trending markets instantly. With clear bullish/bearish signals, customizable alerts, and a user-friendly interface, it helps you avoid range-bound conditions and focus on high-probability trades. Clarity leads to confidence. Trade confidently and protect your capital effectively with this powerful dashboard. Setup & Guide: 
Currency Strength Exotics
Bernhard Schweigert
4.88 (33)
ATTUALMENTE SCONTATO DEL 20%! La soluzione migliore per qualsiasi principiante o trader esperto! Questo indicatore è specializzato nel mostrare la forza della valuta per qualsiasi simbolo come coppie esotiche, materie prime, indici o futures. È il primo nel suo genere, qualsiasi simbolo può essere aggiunto alla nona riga per mostrare la vera forza della valuta di Oro, Argento, Petrolio, DAX, US30, MXN, TRY, CNH ecc. Si tratta di uno strumento di trading unico, di alta qualità e conveniente pe
Master head and shoulders patterns for better trading decisions A head and shoulders pattern is a chart formation that resembles a baseline with three peaks, the outside two are close in height and the middle is highest. It predicts a bullish-to-bearish trend reversal and is believed to be one of the most reliable trend reversal patterns. It is one of several top patterns that signal, with varying degrees of accuracy, that a trend is nearing its end.  [ Installation Guide | Update Guide | Troubl
Altri dall’autore
TripleS
Ahmet Metin Yilmaz
5 (1)
3S indicator  designed for trend detection without the effect of accidental price leaps. It uses Price Series and a few moving averages for noise reduction. It works on multiple timeframes, even M1. To increase effectiveness, it is recommended to use default parameters for M1 graphic (see screenshots). You can change settings for other time frames. Example of using this indicator : If  Gold  cross to  Blue  down and both gold and blue under the  Gray ,  it could be a promising sell signal . To
EwoMov
Ahmet Metin Yilmaz
L'indicatore EwoMov è utile per determinare un trend con un periodo più lungo di medie mobili dei prezzi (dovrebbe essere superiore a 200). Sto usando questo indicatore per lo swing trade sui grafici M5-M30. Questo indicatore utilizza diverse barre per il calcolo. Sono tutti salvati in parametri esterni. I valori corretti sono 5 - 13 - 34, ma è possibile modificarli. È pronto per tutti i tempi, ma fa del suo meglio per M5-H1. È progettato per essere ottimizzato per altri intervalli di tempo.
Mighty Scalper
Ahmet Metin Yilmaz
Mighty Scalper LightEA A Trend Friendly EA There are different and complex logic mixed in it It begins to work, simply with a BreakOut strategy and Works in PARTIAL CLOSE and CLOSE TIME LIMIT you had never seen before in the market expert... It opens an order and use partial close in a specific levels and close order within a specific time ( if order still live ) No Martingale and hedging It works any kind of broker, but lower spread gets more gain Fast optimization for strategy tester ( for n
ForexEA HMA
Ahmet Metin Yilmaz
This EA uses  Non-Repaint Hull Moving Averages calculation. You can find positive results with the correct optimization. Optimization should be adjusted according to the properties of the broker you are using and your trading institution. Default settings are optimized for AUDUSD in an ECN broker for M30 time frame. (Remember, it is necessary to re-optimize your brokers for the settings.) Test it before buying for your broker settings if it is ok, It is recommended use rental option to be sure.
GreatGigInTheSky
Ahmet Metin Yilmaz
The Great Gig In The Sky is an expert advisor and also a song from My favorite Rock Band's. Pink Floyd.  There is only one input parameter. Lots amount. You know what do you do in there. Try in a demo account from your real broker to test. Expert logic also includes stop loss and take profit transactions. Do not worry about them. The one-month rental period is only for you to try the experiment and is valid for limited copy. Tested and Preferred pairs are GBPJPY, CHFJPY,CADJPY. I am still contin
HMA Nrp
Ahmet Metin Yilmaz
Alan Hull's moving average, more sensitive to the current price activity than the normal MA. Reacts to the trend changes faster, displays the price movement more clearly. No Repaint Version on separate Windows shows the trend 1 and -1 . Improvement of the original version of the indicator by WizardSerg <wizardserg@mail.ru>. Suitable for all timeframes. Parameters Period - period, recommended values are from 9 to 64. The greater the period, the smoother the indicator. Method - method, suitable v
XLineBreak
Ahmet Metin Yilmaz
5 (1)
Questo indicatore rileva il breakout utilizzando la strategia di rilevamento delle barre dei parametri di input. È possibile utilizzare la funzione WaitForBarClosed per confermare i segnali (true) ma a volte viene attivata un po' più tardi di false. L'indicatore si apre in una finestra separata. Adatto a tutti i tempi e coppie. La linea blu mostra la direzione del trend. Collega l'indicatore a qualsiasi grafico Selezionare gli ingressi desiderati nella scheda degli ingressi dalla finestra di d
OneWayTicket
Ahmet Metin Yilmaz
OneWayTicket indicator is based on CCI indicator. In fact, it analyzes multiple CCIs from several timeframes. There are four Ways of OneWayTicket, read from left to right - 15 min, 30 min, 1 hour and 4 hours. The idea is to enter the market when all four CCIs agree on a trend. A trader chooses which timeframes to monitor. When all four ways of the OneWayTicket are green - Buy . When all four ways of the OneWayTicket are bright red - Sell . Original idea from the author: tageiger, revised for the
AccountInfo
Ahmet Metin Yilmaz
This Script Shows your Account & Symbol information which you use on your graphics. These are: Account Information Number Name Currency Server Leverage Stop Out Level Balance Information Balance Equity Margin Free Margin Symbol Information Symbol Lot Size Min.Lot Lot Step Max.Lot Tick Value Tick Size Spread Stop Loss Level Swap Long Swap Short Initial Margin Maint.Margin Required Margin Trade Allowed
Virtue
Ahmet Metin Yilmaz
"Virtue" is a fully automated Long term Expert Advisor. It calculates market condition itself and decides to enter a position. "Virtue" needs patience that is the why its name Virtue. Patience is a virtue. You must be patient to make some Money. You have to wait for it to find optimal conditions to open an order. It will be enough to just install it on the platform. No need to optimize many parameters. Expert is optimized for EURUSD H1 timeframe. First download demo and test it for your broker.
VirtueMultiLot
Ahmet Metin Yilmaz
Virtue Multi Lot   "Virtue" is a fully automated Long term Expert Advisor. It calculates market condition itself and decides to enter a position. This is the main position. After that position, it adds some small lots for scalping. You can select how many orders will be open extra. It depends on your account margin and risk managment. "Virtue" needs patience that is the why its name Virtue. Patience is a virtue. You must be patient to make some Money. You have to be wait it find optimal conditi
JapaneseBreakout
Ahmet Metin Yilmaz
Instructions Attach the indicator to any chart (advised H4) Use input tabs (defaults are 5 and false ) Press ok and continue trading. Description The indicator uses a kind of pattern breakout strategy to help your trading strategy. I am using this strategy on H4 charts for many of pairs with a trailing stop and default indicator settings. Better results are shown on USDJPY, EURJPY, CADJPY, EURGBP, EURUSD, USDCAD, USDCHF, NZDUSD and GBPUSD. Trailing stops should be different for each pair. The b
PivotSupportResistance This indicator plots horizontal lines at daily pivot levels R3, R2, R1, Pivot, S1, S2, S3, where R means Resistance and S means Support. This indicator can be applied to any chart period, although daily pivots on charts with long periods are meaningless (if you switch your chart timeframe greater than daily chart, you will get alert and indicator will not work). Labels are shown for the most recent day's levels. There are no external inputs, so it is easy to use. Please re
PriceChannel
Ahmet Metin Yilmaz
PriceChannel is designed for trend detection without the effect of accidental price leaps. It uses Price Series and a few moving averages for noise reduction. It works on multiple timeframes, even M1. To increase effectiveness, it is recommended to use 3 instances of PriceChannel with different parameters on one chart (see screenshots). You can use the following settings (for M1 charts): PriceChannel(10,2,30) Gold colour. PriceChannel(10,5,30) Blue colour. PriceChannel(21,8,13) Gray colour. Exa
VoMa
Ahmet Metin Yilmaz
Variation of Moving Averages indicator is calculated as the difference between different periods of moving averages. Obtained result filtered by another MA. It displays more precise signals of divergences between prices and the value of the indicator. It emphasizes price extremums more precisely, it moves faster. There are three inputs FastMA: Default is 13, shows MA period. SlowMA: Default is 21, shows MA period. SignalMA: Default is 8, shows MA period. It basically detects the trend, advised
Price Volume
Ahmet Metin Yilmaz
This indicator calculates price movement with the Volume. The Volume indicates the number of deals in the desired period, but does not show number of contracts per deal. From this point of view, the tick does not reflect the true volume. However it is a valuable demand indicator. Volume and price are calculated with a special formula. There are 3 input parameters EMAPeriod: Price and volume data are calculated using this period of Moving Average first. DEMAPeriod: Results of first EMA, recalcul
Doma
Ahmet Metin Yilmaz
Differences of Moving Averages This indicator plots short term trend with two moving averages difference and its signal line. Best result at 5 min chart in default parameters. There are 7 extern input parameters: MaShortPeriod: period of the first MA. MaLongPeriod: period of the second MA. ModeDoMA: DoMA method. ModePrc: MA price mode. SignalMaPeriod: Period of Signal MA. ModeSma: Signal MA mode. LabelLevel: Horizontal line level on display. Default parameters can be changed by user.
HighLowOpenClose
Ahmet Metin Yilmaz
HLOC Trend Indicator This indicator helps you to determine trend direction on your trade. Default parameters for H1 time frame. You can use this indicator both bigger time frame and smaller time frame to open a trade. The calculation is based on high, low, opening and closing price values of each bar in the selected time period. When the values found in the Indicator custom formula are exceeded, the buy or sell signal falls on the screen. There are two extern inputs; RiskFactor: Early but risky
HLOCTrend
Ahmet Metin Yilmaz
HLOC Trend Indicator This indicator helps you to determine trend direction on your trade. Default parameters for H1 time frame. You can use this indicator both bigger time frame and smaller time frame to open a trade. The calculation is based on high, low, opening and closing price values of each bar in the selected time period. When the values found in the Indicator custom formula are exceeded, the buy or sell signal falls on the screen. There are two extern inputs; RiskFactor: Early but risky
This indicator shows Linear Regression Line and it's channels which calculated with fibo numbers. You can use this indicator in different timeframes on your chosen timeframe chart. You only need to attach this indicator on the chart twice or more with a different colors to do this.  There are 6 input parameters; period      : you can choose regression timeframe independent of chart timeframe. linewidth : width of line on the chart. bars back regression begin : calculated regression bar count. LR
CurrencyAdviser
Ahmet Metin Yilmaz
This indicator examines the relative strengths of the currencies of 8 different countries and displays the one that has the potential to gain profit in the short term as a suggestion. The relative strength of each country's currency over the selected time period is shown on the graph as a percentage. The recommended currency according to BuyLevel and SellLevel determined by the user is shown in the bottom right section. The indicator also automatically brings up the 30-minute graph of the sugges
PriceActionSignals
Ahmet Metin Yilmaz
Price Action Signals generates buy and sell signals with price close and complex logic. You can use it different timeframes and pairs.  Best results are on M30 and H1 charts with default parameter. You can change this parameter ( nFrequency ) for other timeframes. ( except M1 timeframe ) There is only one extern input: nFrequency: It determines signal frequency. Default is 0.004. You can use this arrow for Expert Advisors. Upsignal: iCustom(......"PriceActionSignals", buffer nr:0 ) Downsignal :
ATR Channels
Ahmet Metin Yilmaz
ATR Channel is an indicator. It shows us ATR ( depends on selected period ) Line on main chart. It also draw 3 up ATR channels (ATRu) and 3 down ATR channels (ATRd) on the same window. All they helps you to trade with a ATR indicator. There are 6 extern inputs; PeriodsATR   : You can change ATR Period default is 13. MA_Periods   : Use for draw ATR channels MA periods. Default is 34. MA_Type       : You can change MA_method here. Default is Linear weighted. Mult_Factor1 : It is for first up and d
BuySellEA
Ahmet Metin Yilmaz
SrEwo Expert adviser designed and optimized for EURUSD. You may Optimize all other instruments. It is easy to use.  *** It uses only M5 chart graphic and you need to use M5. ( Both test and live ) Input Parameters: Lots: Base lot amount.Expert use this amount as referance.  crossfactorlimit: expert will open new order with this limit modifylimit & TP limit : order modify and another TP limit. targetprofit : expert calculates this number in its logic. crossfactor : next order lots multiply with t
TheGorillaEA
Ahmet Metin Yilmaz
Expert works H1 timeframe only There are two main criteria. Daily pivots and moving averages. To open a buy order, today's daily pivot must greather than the day before's daily pivots.  Moving averages for EURUSD pair as default. They can be changed for other pairs and also for EURUSD too. You can also change takeprofit and stoploss level. expert doesnt trade on mondays and before 2 hour on other trade days. You can test and optimize for all pairs with extern parameters. Do not purchase without
Psr1EA
Ahmet Metin Yilmaz
Psr1 EA is the one of Psr series EAs. It works on 5 minutes chart only. You can use this EA any currencies but you should optimize first. Default parameters belongs to my broker databases EURUSD M5 . It uses pivot  and 2 main moving averages.  Moving averages can be adjustable by user. ( for optimizing ) Input Parameters:  MagicNum: Expert will use this number to determine experts orders. Lots: Lots amount which you want to use. Default is 0.01 ( it can be cahnged by expert due to your broker's
Psr3EA
Ahmet Metin Yilmaz
Psr3 EA is the one of Psr series EAs. It works on 5 minutes chart only. You can use this EA any currencies but you should optimize first. Default parameters belongs to my broker databases EURUSD M5 . It uses pivot  and Support/Resistance Levels.  Stoploss and Takeprofit can be adjustable by user. ( for optimizing ) Input Parameters:  MagicNum: Expert will use this number to determine experts orders. Lots: Lots amount which you want to use. Default is 0.01 ( it can be cahnged by expert due to you
ColorCMI
Ahmet Metin Yilmaz
Indicator values are in the range 0-100. The greater is the indicator value, the greater is the market stability, so the more likely we have trend. The smaller is the indicator value - the less probable the trend is. Tips: Trading on unstable market:     Buy, when moving average (blue line) of the CMI indicator is below 40 and the histogram is red.     Sell when moving average (blue line) of the CMI indicator is below 40 and the histogram is green.     Close positions when CMI histogram is
Signaline
Ahmet Metin Yilmaz
SIGNALINE INDICATOR This indicator for all pairs and all timeframes I have just completed the M5 timeframe for deep optimization EURJPY yet. EURJPY M5 Optimization ( TP=150 , SL=130 , IndicatorPeriod=6 , Mov1=22 , Mov2=48 ) (*)Added 20.05.2019 You can find this signal page below https://www.mql5.com/en/signals/583477 Other optimizasyon results will be added on this signalpage. Input Parameters: IndicatorPeriod: Default is 8. Mov1               : Default is 21. Mov2               : Default is 48.
PureDailyEA
Ahmet Metin Yilmaz
Expert's signal link has been working on 25 different instruments since 09.07.2019. It will be stopped after a while. https://www.mql5.com/en/signals/605823 This expert advisor works well on daily charts. Opens a pending order based on daily price movements and may revise this pending order based on price movements during the day.  It can keep the current order by following the price movements and can open two different types of additional orders as soon as it sees the opportunity. If he sees t
Filtro:
Gino De Andrea Calvo
2473
Gino De Andrea Calvo 2018.10.30 21:59 
 

Great Indicator, it really helps for taking a short or long position combined with your own strategy,

Rispondi alla recensione