Three Line Strike Scanner 30 Instruments
- Indicatori
- FXsolutions
- Versione: 1.6
- Aggiornato: 6 ottobre 2019
- Attivazioni: 10
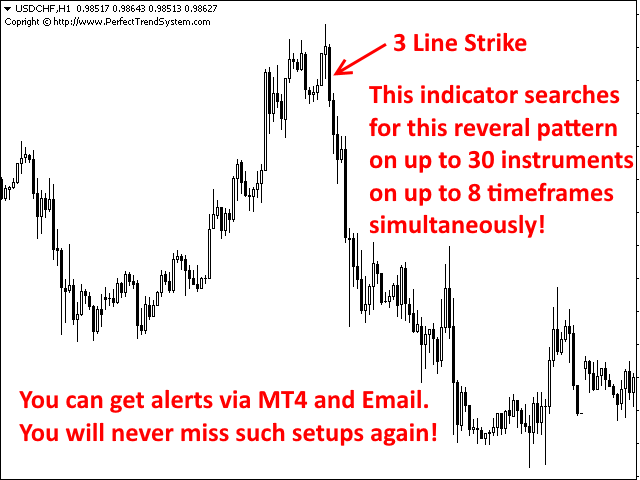
This indicator is designed to detect the best of all candlestick reversal patterns: Three Line Strike.
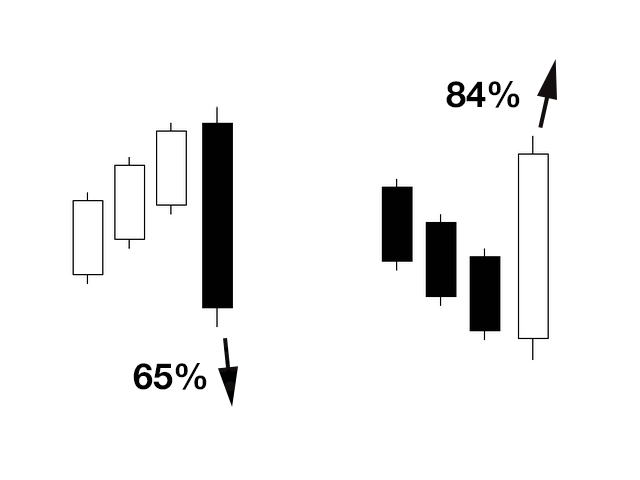
According to the bestselling author and candlestick guru Thomas Bullkowski, this pattern has a winning percentage between 65% and 84%.
This indicator scans for you up to 30 instruments (forex, indices or commodities) on up to 8 timeframes. You can get alerts via MetaTrader 4 and email if a Three Line Strike pattern occurs.
Please note: Higher timeframes bring the most reliable signals.
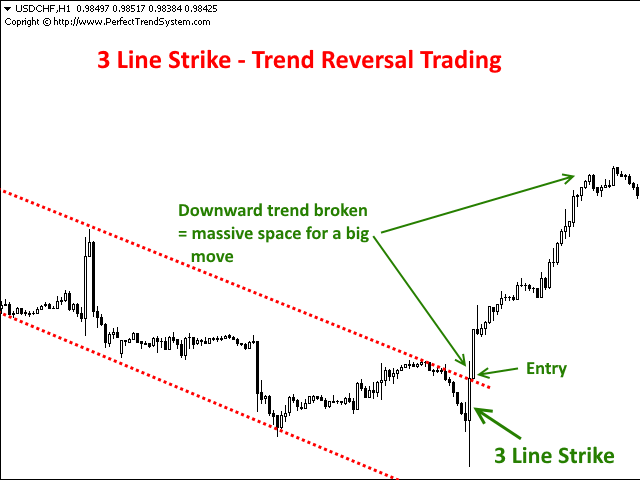
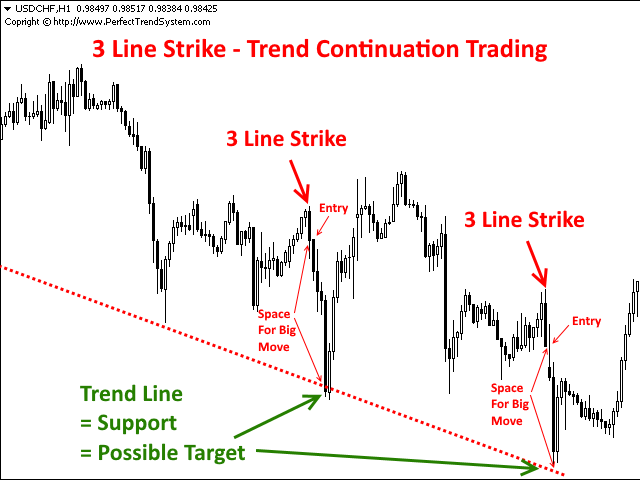
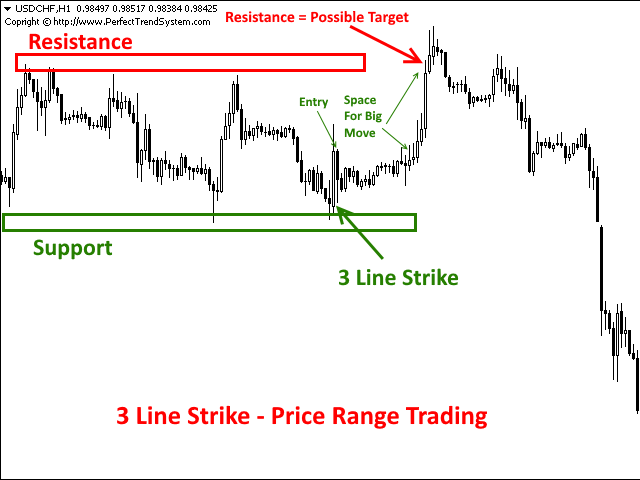
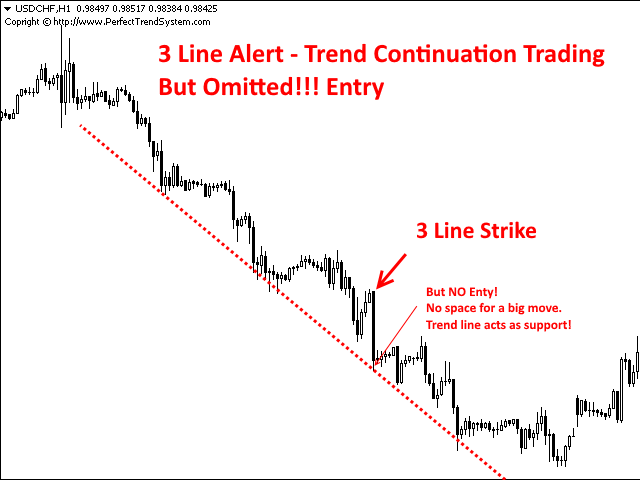
This indicator generates a signal if the engulfing candle has engulfed the bodies (not necessarily the wicks) of the three preceding candles. The most important part of this pattern is WHERE it occurs. In direction of the signal, there should be always enough room for a big subsequent move. These are the best setups. Good places are double tops and double bottoms for a trend reversal. The signal can also be used as a trend continuation entry within trends if the channel of the trend gives enough room for a big subsequent move. The screenshots below are explaining the different trading methods with this signal.
After a signal is alerted, you can click on the appropriate button on the chart (containing the name of the instrument). Then a chart of this instrument opens with the template which you configured. With this feature you can open relevant charts very quickly and make your entry.
Parameters
- alertsLong: True = Yes, False = No - if true, then the indicator alerts occurrences of "Three Line Strike" - signals for long entries
- alertsShort: True = Yes, False = No - if true, then the indicator alerts occurrences of "Three Line Strike" - signals for short entries
- alertsViaMT4: True = Yes, False = No - if true, then the indicator gives alerts via MetaTrader 4 popup
- alertsViaEmail: True = Yes, False = No - if true, then the indicator gives alerts via email
- alertsViaPush: True = Yes, False = No - if true, then the indicator gives alerts direct to your mobile phone
- alertsM1: True = Yes, False = No - if true, then the indicator searches for "Three Line Strike" - signals on M1
- alertsM5: True = Yes, False = No - if true, then the indicator searches for "Three Line Strike" - signals on M5
- alertsM15: True = Yes, False = No - if true, then the indicator searches for "Three Line Strike" - signals on M15
- alertsM30: True = Yes, False = No - if true, then the indicator searches for "Three Line Strike" - signals on M30
- alertsH1: True = Yes, False = No - if true, then the indicator searches for "Three Line Strike" - signals on H1
- alertsH4: True = Yes, False = No - if true, then the indicator searches for "Three Line Strike" - signals on H4
- alertsD1: True = Yes, False = No - if true, then the indicator searches for "Three Line Strike" - signals on D1
- alertsW1: True = Yes, False = No - if true, then the indicator searches for "Three Line Strike" - signals on W1
- templateName: - if you press a button on the chart (which contains the name of an instrument), then the appropriate chart will open and a template with the specified name will be attached
- checkEveryXSeconds - every X seconds the indicator checks the next instrument/timeframe for the occurence of a "Three Line Strike" signal
- i1-i30 - define up to 30 instruments, which will be monitored/checked for the occurence of a "Three Line Strike" signal
Lo he comprado por error, pero además, las señales no valen para nada. Desperdicio de dinero.