Trend Lines ZFS

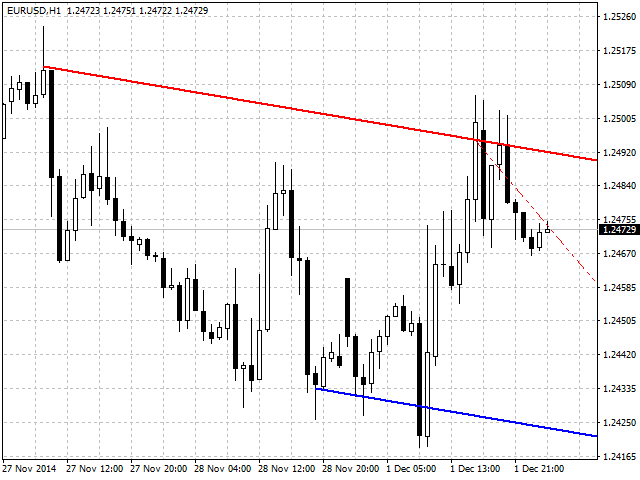
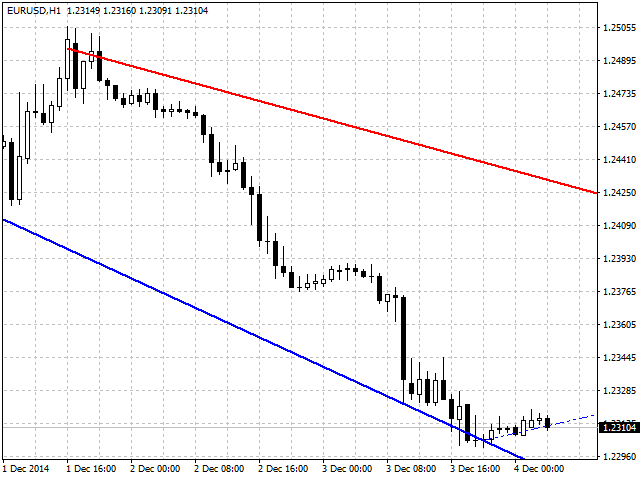
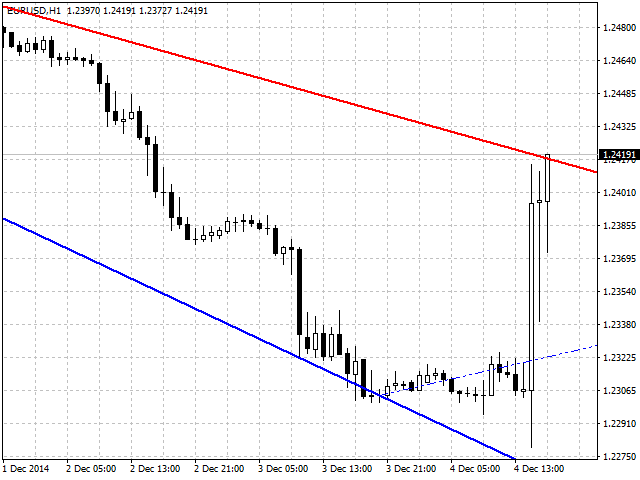
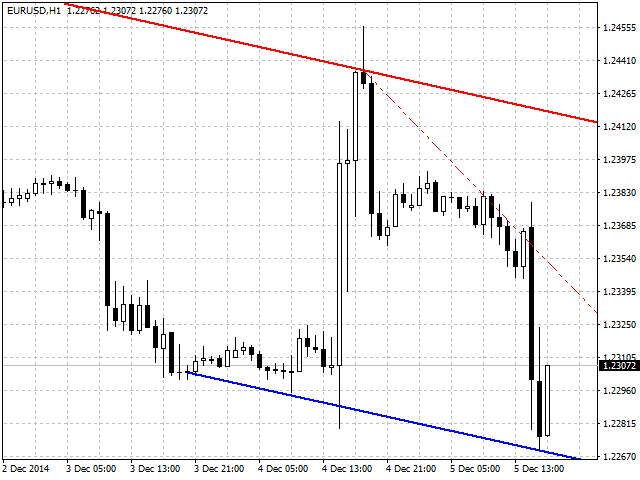
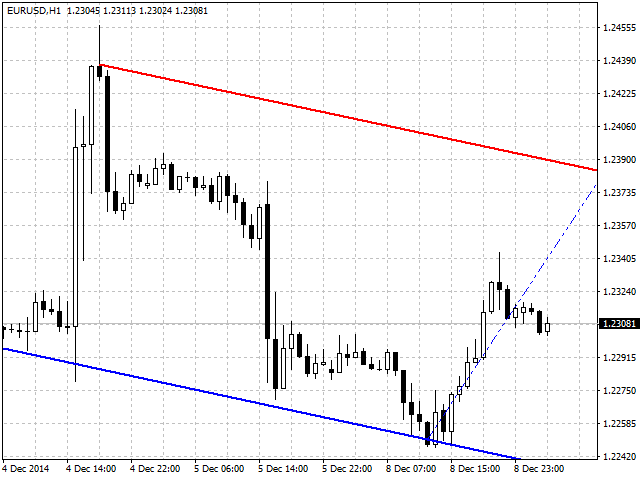
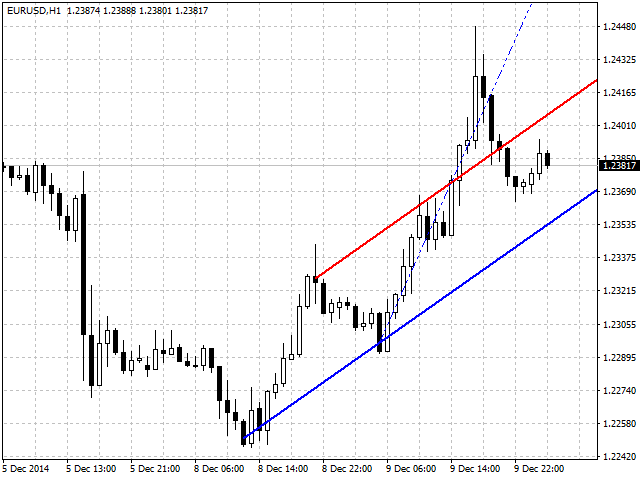
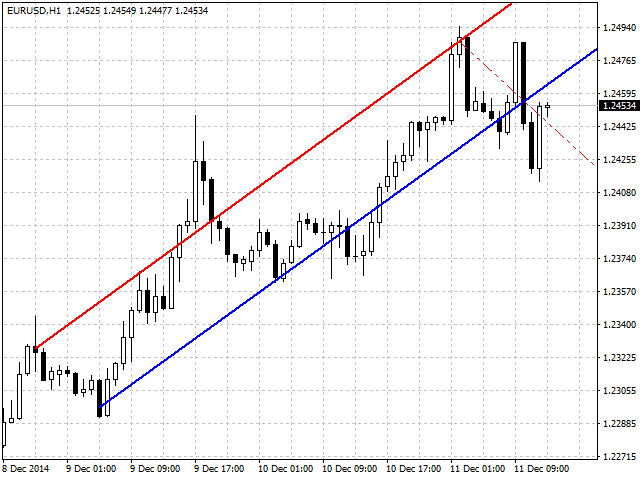
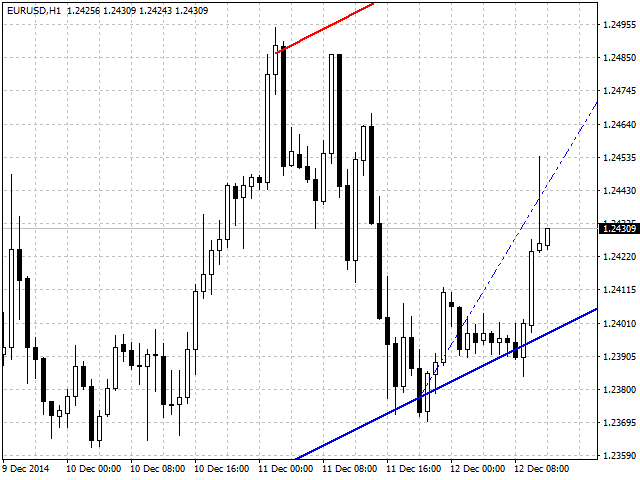
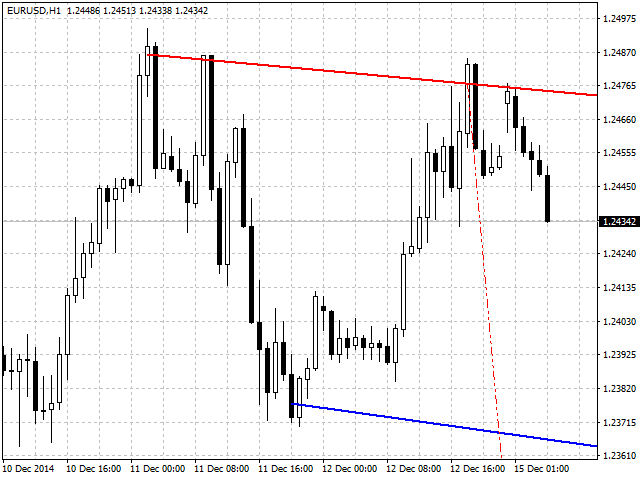
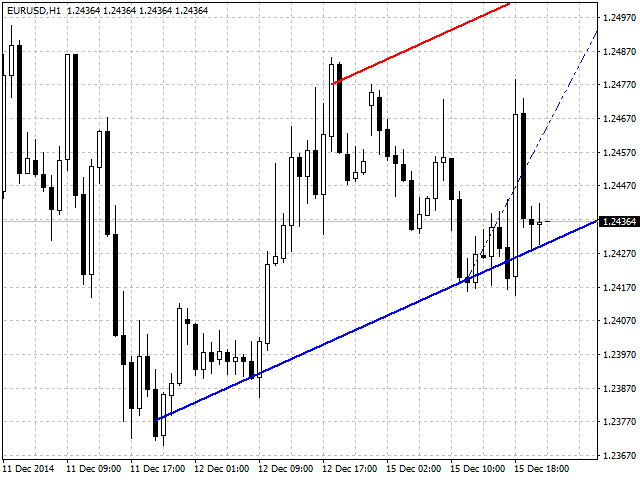
The indicator draws channels. The estimated movement of the price within the channel is shown with a dotted line.

The lines of the channel are the support and resistance lines. This allows using them in both rebound and breakout trading. The inclination of the channel allows determining the direction of the current trend, the channel width and angle allow estimating the current volatility.

The channels are based on fractal bars, determined using the author's original method, 4 dimensions from the first smallest to the fourth highest.


Indicator Parameters

  • swPriceMoveLine - toggle the lines of the estimated price movement direction in the channel.
  • swTrendLine1 - toggle the trend lines of the 1st dimension.
  • Width1 - thickness of the trend lines of the 1st fractal dimension.
  • colorDn1 - color of the lower line of the 1st fractal dimension.
  • colorUp1 - color of the upper line of the 1st fractal dimension.
  • swTrendLine2 - toggle the trend lines of the 2nd dimension.
  • Width2 - thickness of the trend lines of the 2nd fractal dimension.
  • colorDn2 - color of the lower line of the 2nd fractal dimension.
  • colorUp2 - color of the upper line of the 2nd fractal dimension.
  • swTrendLine3 - toggle the trend lines of the 3rd dimension.
  • Width3 - thickness of the trend lines of the 3rd fractal dimension.
  • colorDn3 - color of the lower line of the 3rd fractal dimension.
  • colorUp3 - color of the upper line of the 3rd fractal dimension.
  • swTrendLine4 - toggle the trend lines of the 4th dimension.
  • Width4 - thickness of the trend lines of the 4th fractal dimension.
  • colorDn4 - color of the lower line of the 4th fractal dimension.
  • colorUp4 - color of the upper line of the 4th fractal dimension.
Prodotti consigliati
Possible Price reversals levels - based on  Fibonacci + Support +  Resistance Levels Auto levels drawn based on input index (Bars Count )  ---->>> Price Over 50% Fibo line ---> UP TREND ---> BUY when price drop near Support Lines  ---->>> Price Down 50% Fibo line ---> DOWN TREND ---> SELL when price goes up  near Resistance Lines  --->>> The more close price levels ----> the more possibility for price reversals --->>> are you a scalper --> try it on M1 charts with big index like 5000 bars  or
Draw by Hand Tool
John Louis Fernando Diamante
This tool provides a freehand drawing method, to treat the chart space as a blackboard and draw by-hand. Drawings can be made to stick to the CHART (moves with chart scroll), or to stick to the WINDOW (does not move with chart scroll). Features: all drawings are individually styled, color, width show/hide each drawing type delete last drawing drawings, on chart and on window, remain through TF changes and terminal re-starts, until the indicator is removed Panel: stylable colors scalable in size
Visualizzazione delle operazioni di trading, distribuite per livelli di prezzo. Puoi impostare qualsiasi periodo per il calcolo: tra due linee verticali o un intervallo di tempo fisso. I livelli dell'istogramma sono relativi: una barra più larga significa un volume di trading maggiore. Gli estremi della distribuzione possono essere utilizzati come livelli di supporto e resistenza. Tutti gli stili, le dimensioni e i colori sono personalizzabili. Utilità multifunzionale : include 66+ funzioni  |
Channels Pro
Alexander Nikolaev
5 (3)
The indicator determines and plots price channels or lines, reading information from multiple timeframes (from current, second and third) simultaneously. Color and width of lines for each timeframe can be customized. It is also possible to set different distance between the Highs and Lows for plotting channels or lines. Parameters History - maximum number of bars to plot channels or lines; Distance - minimum distance from one High (or Low) to another when plotting lines; Shift - shift for sever
This is a trend-tracking indicator that determines the change in trend through changes in color. It can capture the big trend market and assist trend traders to enter and hold positions. A small rebound in the market will be filtered until the end of the trend. In the turbulent market, the horizontal line in the indicator can also be used as a support or pressure reference. More EA&Indicators click here https://www.mql5.com/en/users/chenshaofei/seller parameter Period - indicator period (large s
Ceres Trend
Valeriy Skachko
The Ceres Trend Indicator displays polynomial regression on history and in the current time. In the indicator settings: module - degree of regression (1 - linear, 2 - parabolic, 3 - cubic, etc.) koeff is the standard deviation channel multiplier. The main direction of application of this indicator is the ability to determine the likelihood of further growth. If there is an intersection of the linear regression line from below, then this indicates a trend inhibition and a possible reversal. Si
Pivot Points Classic PRO
Richard Bernard Parioleau
Titolo: maratoa201 Pivot Points Classic + Intermedi intermedi Descrizione breve: Indicatore dei pivot classici e intermedi per XAUUSD M5. Descrizione lunga: Questo indicatore mostra il pivot centrale (PP), le resistenze e i supporti classici (R1-R3, S1-S3) e i livelli intermedi 0.5, 1.5, 2.5. I label sono leggermente spostati per una migliore leggibilità sul grafico. Progettato per il trading su XAUUSD M5, ma adattabile ad altri simboli e timeframe. Compatibile con MT4 Build 2416. Autore: marat
The "One-Click" Breakout Monitor Never Miss a Breakout Again. Price Alert Line   is designed for traders who need speed and simplicity. Instead of navigating complex menus to set price alerts, this tool places a button directly on your chart. With a single click, you can deploy a horizontal line that monitors price action and alerts you immediately when the price crosses it. New Feature (Smart UI):   The control buttons now automatically adapt to match your line colors. If you set your resis
FREE
DMS Fibo
Diogo Mitsunaga Dos Santos
Fibonacci retracements are trend lines drawn between two significant points, usually between absolute lows and absolute highs, plotted on a chart. Intersecting horizontal lines are placed at the Fibonacci levels. Fibonacci retracements are useful tools that help traders identify support and resistance levels. With the information gathered, they can place orders, identify stop-loss levels, and set price targets. Although useful, traders often use other indicators to make more accurate assessments
Price Aleart
Kourosh Hossein Davallou
Price Alert indicator plays sound alerts when the price reaches certain levels that are set by the trader. If you use e-mail alert feature, don't forget to set the e-mail settings in your MetaTrader platform options window.   Input parameters: WhenPriceGoesAbovePIP - if the price exceeds the current one by a specified amount of Pips, the alert will be triggered. WhenPriceGoesBelowPIP - if the price goes below the current one by a specified amount of Pips, the alert will be triggered. WhenPriceIs
The indicator detects and displays the 5-0 harmonic pattern on the chart according to the scheme provided in the screenshot. The pattern is plotted by the extreme values of the ZigZag indicator (included in the resources, does not require additional installation). After detecting the pattern, the indicator notifies of that by the pop-up window, a mobile notification and an email. The indicator highlights not only the complete figure, but also the time of its formation. During the formation the f
Mint Channels
David Joseph Sidney Jonasson
A Clean and Easy to Use indicator, this indicator will Draw a Lightblue channel and a LightRed Channel that you can use as a signal when price touches these lines. it can also be used to set stop loss and take profit values / Hint: set stoploss outside the channels and TakeProfit inside the channels. this indicator is one part of a set of three and when combined creates a full Trading Strategy.  When used with Mint Channels and Mint RSi-CD you will take buy signals when price hits LightBlue uppe
Dynamic Levels
Svyatoslav Kucher
Dynamic Levels is a channel indicator of dynamic levels, designed for identification of the price extremums. It allows increasing the efficiency of any strategy due to advanced parameters, which in turn allow customizing it for personal trading style. Dynamic Levels does not change its values, it is suitable for any timeframe and currency pair. Indicator Parameters ChannelPeriod - period for the indicator calculation. ChannelSmoot - smoothing of values. ATRPeriod - volatility calculation period
"Gradient adaptive rsi mt4" - adaptive forex indicator RSI, which is displayed on the price chart as a gradient. This indicator helps the trader determine the direction of the current trend, the strength of the trend, trend reversal points. "Gradient adaptive rsi mt4" - created for the Metatrader4 platform and can work on all currency pairs and timeframes. With the help of settings, this "Gradient adaptive rsi mt4" indicator can be adapted to work with different trading strategies. The "Gradien
The Icarus Auto Dynamic Support and Resistance  Indicator provides a highly advanced, simple to use tool for identifying high-probability areas of price-action automatically - without any manual input whatsoever. .  All traders and investors understand the importance of marking horizontal levels on their charts, identifying areas of supply and demand, or support and resistance. It is time-consuming and cumbersome to manually update all instruments, across all timeframes, and it requires regular
Mood
Gevorg Hakobyan
This indicator is designed for trend trading and it helps in determining the best entry points. To identify the points, it is necessary to follow the signal line. Once the line crosses the zero level upwards - buy, and when it crosses downwards - sell. In addition to the signal line, the indicator also displays the so-called market "mood" in real time in the form of a histogram. The indicator works on all timeframes and with all instruments. The indicator operation required the Moving Average in
Marker Bands
Ramon Sobrevals Arce
4.5 (2)
This indicator consists in two different algorithms, in order to profit all fast movements created during noises of the market. First of all, it plots normalized trend bands to can filter the possible trades. The normalized trend bands are calcualted using an exclusive mathematical algorithm to has both the correct trend and the fast adaptability to the change of trends. With those bands you can know when you are inside the trend, or when you are outside. The second alhorithm uses a private fo
Point Trend Indicator - Un indicatore del livello superiore e inferiore del trend, che può determinare la direzione del trend e indicarne il rafforzamento. La direzione del trend è determinata da punti rotondi; se i punti sono sopra la linea dello zero, il trend è rialzista; se sotto, il trend è ribassista. L'aumento del movimento direzionale è indicato dalle frecce. Ha l'unico parametro per la regolazione manuale: durata della direzione del trend.   Possibilità Funziona su tutti gli intervalli
This is a well-known ZigZag indicator. But it differs by the fact that its plot is based on values of the middle line which is set by a user. It can display Andrews’ Pitchfork and standard or Bobokus Fibo levels. NO REPAINTING. Parameters Period МА — middle line period. Default value is 34. Minimum value is 4. Maximum value is set at your discretion. Used to calculate price - base price to calculate the middle line. The averaging method - method of smoothing the middle line. Turning pitchfork —
GMMA Trade X is an EA based on GMMA. GMMA parameters such as MovingAveragePeriod1-24, MovingAverageMAShift1-24, MovingAverageShift1-24 and CandlestickShift1-24 can be adjusted. GMMA Trade X applies BTN TECHNOLOGY's state-of-the-art intelligent technology to help you create optimal results for your trades. May your dreams come true through GMMA Trade X. Good luck. = == == Inquiries = == == E-Mail:support@btntechfx.com
This indicator is based on the classical indicator  Parabolic SAR  and will be helpful for those who love and know how to use not a visual, but digital representation of the indicator.  All TimeFrames PSAR MT5  indicator shows values from each timeframe (M1, M5, M15, M30, H1, H4, D1, W1 and MN1). You will be able to change the main input parameters for each Stochastic from every TF. Example for M1: sTF1 = M1 pStep1 = 0.02 pMax1 = 0.2
Trend Ray
Andriy Sydoruk
The indicator shows the potential trend direction by cyclical-wave dependence. Thus, all the rays of the intersection will be optimal rays, in the direction of which the price is expected to move, taking into account the indicator period. Rays can be used as a direction for potential market movement. But we must not forget that the approach must be comprehensive, the indicator signals require additional information to enter the market.
One of the powerful methods of analysis is the modeling of financial series using Levy processes. The main advantage of these processes is that they can be used to model a huge number of phenomena - from the simplest to the most complex. Suffice it to say that the idea of ​​the fractal price movement in the market is only a special case of Levy processes. On the other hand, with proper selection of parameters, any Levy process can be represented as a simple moving average. Figure 1 shows an exa
Introduction "Smart money" is money invested by knowledgeable individuals at the right time, and this investment can yield the highest returns. The concept we focus on in this indicator is whether the market is in an uptrend or downtrend. The market briefly takes a weak and reversal trend with "Minor BoS" without being able to break the major pivot. In the next step, it returns to its main trend with a strong bullish move and continues its trend with a "Major BoS". The "order block" beh
Fibonacci SR Indicator
Martin Eshleman
5 (1)
Fibonacci SR Indicator This indicator creates support and resistance lines. This indicator is based on Fibonacci Retracement and Extension levels. It will consider many combinations of the Fibonacci levels and draw support/resistance lines based on these. This indicator uses tops and bottoms drawn by the ZigZag indicator in its calculations. The ZigZag can also be drawn on the chart, if necessary. The indicator considers many combinations of past reversal points and Fibonacci ratio levels, and w
FREE
Gravity Trend
Svyatoslav Kucher
Determining the current trend is one of the most important tasks of a trader, regardless of the trading style. The Gravity Trend indicator will help you do this with a fairly high probability. Gravity Trend is a trend recognition indicator that uses the author's calculation algorithm. The indicator readings do not change under any conditions. The indicator is suitable for any currency pair, any timeframe. Indicator Parameters Main Settings: HistoryBars - the number of bars to display. FirstPe
Holy Renko PRO
Bianca Seara
3.5 (2)
About  Holy Renko is a trend identifier capable of identify small and long market movements. This indicator should be use in Renko Charts. VIDEO (information and tips) [HERE] How to install Renko Charts [HERE] Features Developed for Renko Charts Easy to analyze Fast signals Not repaint (when candle close)  Statistics panel Filters false signals Alerts, emails and push notifications  Advantages of Renko Chart Easy to install Easy to analyze Filter out the noise of wicks  Easy identification
Trend Hunter Pro
Yaroslav Varankin
The indicator is designed for opening trades for a long period. he is set up to get as many points from each trade as possible. he uses the scalping method... you can trade on any currency pairs indicator is already  you can trade at any time of the day but the preferred time of trading during the European American session. currency pairs eur / jpy, eur / usd currency pairs with high volatility then the results are much better.
Indicatore Crypto_Forex Consolidation Bar Pattern per MT4. Nessun ricalcolo, nessun ritardo. - L'indicatore "Consolidation Bar" è un indicatore molto potente focalizzato sui breakout per il trading Price Action. - Elevato rapporto rischio/rendimento (R/R). - L'indicatore rileva la fase di consolidamento del prezzo in un'area ristretta durante una barra e mostra: direzione del breakout, posizione degli ordini pendenti e posizione dello Stop Loss. - Barra di consolidamento rialzista: segnale con
Wolfe Wave
Kourosh Hossein Davallou
This particular methodology. Please note the odd sequence in counting, as you will see, it is necessary for the inductive analysis. By starting with a top we are assured of beginning our count on a new wave. (The reverse would apply for a bearish wave.) The 2 point is a top. The 3 point is the bottom of the first decline. The 1 point is the bottom prior to point 2 (top), that 3 has surpassed. The 4 point is the top of the rally after point 3. The 5 point is the bottom after point 4 and is likely
Gli utenti di questo prodotto hanno anche acquistato
Gann Made Easy
Oleg Rodin
4.83 (162)
Gann Made Easy è un sistema di trading Forex professionale e facile da usare che si basa sui migliori principi del trading utilizzando la teoria di mr. WD Gann. L'indicatore fornisce segnali ACQUISTA e VENDI accurati, inclusi i livelli di Stop Loss e Take Profit. Puoi fare trading anche in movimento utilizzando le notifiche PUSH. CONTATTAMI DOPO L'ACQUISTO PER RICEVERE GRATUITAMENTE LE ISTRUZIONI DI TRADING E OTTIMI INDICATORI EXTRA! Probabilmente hai già sentito parlare molte volte dei metodi d
M1 Sniper
Oleg Rodin
5 (22)
M1 SNIPER è un sistema di indicatori di trading facile da usare. Si tratta di un indicatore a freccia progettato per l'intervallo temporale M1. L'indicatore può essere utilizzato come sistema autonomo per lo scalping sull'intervallo temporale M1 e come parte del tuo sistema di trading esistente. Sebbene questo sistema di trading sia stato progettato specificamente per il trading sull'intervallo temporale M1, può comunque essere utilizzato anche con altri intervalli temporali. Inizialmente ho pro
Scalper Inside PRO
Alexey Minkov
4.74 (69)
Scalper Inside PRO – Since 2020. An exclusive indicator that utilizes an innovative algorithm to swiftly and accurately determine the market trend. The indicator automatically calculates opening, closing, and profit levels, providing detailed trading statistics. With these features, you can choose the most appropriate trading instrument for the current market conditions. Additionally, you can easily integrate your own arrow indicators into Scalper Inside Pro to quickly evaluate their statistics
KuKl
IGOR KIRIANEN
The indicator is built on a non-standard Zig Zag, it draws accumulations after which if the price leaves this zone and a test of this zone occurs, then a sound signal is given and an arrow appears - after the test candle closes.The indicator does not redraw its signals, it is very easy to use, there are only three settings 1- this is the zig zag parameter 2- this is the minimum price exit from the zone 3- this is the maximum price exit from the zone. The lower the parameter for Zig Zag, the more
PRO Renko System
Oleg Rodin
5 (30)
PRO Renko System è un sistema di trading altamente accurato appositamente progettato per il trading di grafici RENKO. Questo è un sistema universale che può essere applicato a vari strumenti di trading. Il sistema neutralizza efficacemente il cosiddetto rumore di mercato che consente di accedere a segnali di inversione accurati. L'indicatore è molto facile da usare e ha un solo parametro responsabile della generazione del segnale. Puoi facilmente adattare lo strumento a qualsiasi strumento di
Auto Optimized Parabolic RSI: Motore di Momentum 3D Avanzato La maggior parte degli indicatori per trader privati fallisce perché si affida a parametri statici che smettono di funzionare nel momento in cui la volatilità del mercato cambia. Auto Optimized Parabolic RSI risolve il problema dell'"obsolescenza dell'indicatore" ricalcolando continuamente il proprio vantaggio matematico, portando un adattamento quantitativo di livello istituzionale direttamente sul tuo terminale MT5. Il Vantaggio Prin
Quantum Breakout Indicator PRO
Bogdan Ion Puscasu
4.96 (26)
Presentazione       Quantum Breakout PRO   , l'innovativo indicatore MQL5 che sta trasformando il modo in cui scambi le zone di breakout! Sviluppato da un team di trader esperti con un'esperienza di trading di oltre 13 anni,   Quantum Breakout PRO   è progettato per spingere il tuo viaggio di trading a nuovi livelli con la sua strategia innovativa e dinamica della zona di breakout. Quantum Breakout Indicator ti fornirà frecce di segnalazione sulle zone di breakout con 5 zone target di profitt
Market Makers
Mohamed Hassan
5 (4)
After purchase, contact me privately to receive 1 month of free testing with EA Forex Proton! This advanced MT4 trading robot automatically executes signals from any MT4 indicator, including Market Makers. The latest version also includes AI integration, allowing each trade signal to be analyzed using Artificial Intelligence. Live Signal with EA Forex Proton: Click here Market Makers is a powerful price action trading system designed to identify high-probability Buy and Sell opportunities based
Atomic Analyst
Issam Kassas
5 (5)
Innanzitutto, vale la pena sottolineare che questo indicatore di trading non è repaint, non è ridisegno e non presenta ritardi, il che lo rende ideale sia per il trading manuale che per quello automatico. Manuale utente: impostazioni, input e strategia. L'Analista Atomico è un indicatore di azione del prezzo PA che utilizza la forza e il momentum del prezzo per trovare un miglior vantaggio sul mercato. Dotato di filtri avanzati che aiutano a rimuovere rumori e segnali falsi, e aumentare il pote
Apex Edge No Repaint Indicatore di trading professionale senza ricalcolo dei segnali per MT4 Apex Edge No Repaint è uno strumento di trading premium, pulito e affidabile, progettato per i trader di forex e criptovalute più esigenti che desiderano segnali chiari senza la frustrazione del ricalcolo dei segnali. Caratteristiche principali: 100% Nessun ridisegno: i segnali rimangono fissi una volta visualizzati sul grafico Sistema a doppio segnale: segnali RAW per opportunità precoci e segnali C
Questo indicatore funziona con la teoria delle onde di Elliott in due modi: Modalità automatica: In questa modalità, l'indicatore rileverà automaticamente le cinque onde motrici sul grafico in conformità alla teoria delle onde di Elliott. Fornirà previsioni e individuerà potenziali zone di inversione. Inoltre, avrà la capacità di generare avvisi e messaggi push per informare i trader sugli sviluppi importanti. Questa funzionalità automatica semplifica il processo di identificazione e analisi dei
Please send me Direct message on MQL5 CHAT after purchasing the Indicator for Training and Installation Support There are some additional files that is important to use with the Indicator . So be sure to contact me after purchasing the Indicator So that I can add you for training and support . If you find any difficulty with installation then send me Direct message here So that I can connect with you via Anydesk or Teamview for the product installation. " Smart Order Block Indicator " to find m
Segnale GoldRush Trend Arrow L'indicatore GoldRush Trend Arrow Signal fornisce un'analisi precisa e in tempo reale dei trend, pensata appositamente per gli scalper ad alta velocità e a breve termine nel mercato XAU/USD. Progettato specificamente per il timeframe di 1 minuto, questo strumento mostra frecce direzionali che indicano chiari punti di ingresso, consentendo agli scalper di navigare con sicurezza nelle condizioni di mercato volatili. L'indicatore è composto da frecce di avviso PRIMA
Se acquisti questo indicatore, riceverai il mio Trade Manager Professionale   + EA  GRATUITAMENTE. Innanzitutto è importante sottolineare che questo sistema di trading è un indicatore Non-Repainting, Non-Redrawing e Non-Lagging, il che lo rende ideale sia per il trading manuale che per quello automatico. Corso online, manuale e download di preset. Il "Sistema di Trading Smart Trend MT5" è una soluzione completa pensata sia per i trader principianti che per quelli esperti. Combina oltre 10 indic
L'indicatore " Dynamic Scalper System " è progettato per il metodo di scalping, ovvero per il trading all'interno di onde di trend. Testato sulle principali coppie di valute e sull'oro, è compatibile con altri strumenti di trading. Fornisce segnali per l'apertura di posizioni a breve termine lungo il trend, con ulteriore supporto al movimento dei prezzi. Il principio dell'indicatore. Le frecce grandi determinano la direzione del trend. Un algoritmo per generare segnali per lo scalping sotto fo
PZ Trend Trading
PZ TRADING SLU
4.8 (5)
Capture every opportunity: your go-to indicator for profitable trend trading Trend Trading is an indicator designed to profit as much as possible from trends taking place in the market, by timing pullbacks and breakouts. It finds trading opportunities by analyzing what the price is doing during established trends. [ Installation Guide | Update Guide | Troubleshooting | FAQ | All Products ] Trade financial markets with confidence and efficiency Profit from established trends without getting whips
GOLD Impulse with Alert
Bernhard Schweigert
4.67 (12)
Questo indicatore è una super combinazione dei nostri 2 prodotti Advanced Currency IMPULSE with ALERT  +   Currency Strength Exotics . Funziona per tutti i time frame e mostra graficamente l'impulso di forza o debolezza per le 8 valute principali più un simbolo! Questo indicatore è specializzato nel mostrare l'accelerazione della forza delle valute per qualsiasi simbolo come oro, coppie esotiche, materie prime, indici o futures. Primo nel suo genere, qualsiasi simbolo può essere aggiunto all
Day Trader Master è un sistema di trading completo per i day trader. Le systeme se compose de due indicatori. Un indicar est un signal fléché pour acheter et vendre. C'est l'indicateur de fleche que vous obtenez. Je vous fournirai le deuxième indicaur gratuitement. Le deuxième indicaur è un indicaur de tendance spécialement conçu pour être utilisé conjointement avec ces flèches. GLI INDICATORI NON SI RIPETONO E NON RITARDANO! Usare questo sistema è molto semplice. Devi solo seguire i segnali del
Advanced Supply Demand
Bernhard Schweigert
4.91 (300)
Speciale Trading- SCONTO DEL 40% La soluzione migliore per qualsiasi trader principiante o esperto! Questo indicatore è uno strumento di trading unico, di alta qualità e conveniente, perché abbiamo incorporato una serie di funzionalità proprietarie e una nuova formula. Con questo aggiornamento, potrai visualizzare doppie zone di timeframe. Non solo potrai visualizzare un TF più alto, ma anche entrambi, il TF del grafico e il TF più alto: MOSTRA ZONE ANNIDATE. Tutti i trader che operano con Of
Gold Scalper Super
Aleksandr Makarov
5 (2)
Gold Scalper Super is an easy-to-use trading system. The indicator can be used as a standalone scalping system on the M1 time frame, as well as part of your existing trading system. Bonus: when purchasing an indicator, Trend Arrow Super is provided free of charge, write to us after purchase. The indicator 100% does not repaint!!! If a signal appears, it does not disappear! Unlike indicators with redrawing, which lead to the loss of a deposit, because they can show a signal and then remove it.
PZ Support Resistance
PZ TRADING SLU
3.33 (3)
Unlock key market insights with automated support and resistance lines Tired of plotting support and resistance lines? This is a multi-timeframe indicator that detects and plots supports and resistance lines in the chart with the same precision as a human eye would. As price levels are tested over time and its importance increases, the lines become thicker and darker, making price leves easy to glance and evaluate. [ Installation Guide | Update Guide | Troubleshooting | FAQ | All Products ] Boos
Trend Screener
STE S.S.COMPANY
4.79 (95)
Indicatore di tendenza, soluzione unica rivoluzionaria per il trading di tendenze e il filtraggio con tutte le importanti funzionalità di tendenza integrate in un unico strumento! È un indicatore multi-timeframe e multi-valuta al 100% non ridipingibile che può essere utilizzato su tutti i simboli/strumenti: forex, materie prime, criptovalute, indici e azioni. OFFERTA A TEMPO LIMITATO: l'indicatore di screening di supporto e resistenza è disponibile a soli 65$ e a vita. (Prezzo originale 250$) (o
Super Signal – Skyblade Edition Sistema professionale di segnali di tendenza senza repaint / senza ritardo con tasso di vincita eccezionale | Per MT4 / MT5 Funziona meglio su timeframe più bassi, come 1 minuto, 5 minuti e 15 minuti. Caratteristiche principali: Super Signal – Skyblade Edition è un sistema intelligente di segnali progettato specificamente per il trading di tendenza. Utilizza una logica di filtraggio multilivello per identificare esclusivamente i movimenti direzionali forti, supp
They say history repeats itself. What if you could prove it in real-time? The Propfolio Ghost Pattern is an advanced algorithmic pattern-matching engine. It empowers you to select any current price action structure on your chart and instantly scan thousands of historical candles to find the exact moment in the past where the market did the exact same thing. Once it finds the highest probability match, it projects the historical outcome into the future as "Ghost Candles"—giving you a highly calcu
ATTUALMENTE SCONTATO DEL 26%!! Questo indicatore è una super combinazione di entrambi i nostri indicatori principali ( Advanced Currency Strength 28   &  Advanced Currency IMPULSE with ALERT  ). Mostra i valori di forza della valuta per unità di TICK e segnali di allerta per 28 coppie Forex. È possibile utilizzare 11 diverse unità di Tick. Si tratta di 1, 2, 3, 4, 5, 6, 10, 12, 15, 20 e 30 secondi. La barra dell'unità di tick nella finestra secondaria verrà mostrata e spostata a sinistra quand
Contattami dopo l'acquisto per ottenere un EA bonus basato su questo indicatore. La Self Optimizing Double MA Strategy è uno strumento di trading di livello professionale progettato per eliminare le congetture sui parametri. Alimentato da un motore di auto-ottimizzazione integrato, si adatta continuamente alle mutevoli condizioni di mercato simulando migliaia di combinazioni di parametri in background per mantenere un vantaggio statistico. Invece di fare affidamento su impostazioni statiche e o
Bull versus Bear
Mohamed Hassan
4.5 (18)
Send us a message after your purchase to receive more information on how to get your  BONUS  for FREE  that works in great combination with Bull vs Bear ! Bull versus Bear is an easy-to-use Forex indicator that gives traders clear and accurate signals based on clear trend retests . Forget about lagging indicators or staring at charts for hours because  Bull vs Bear provides real-time entries with no lag and no repaint, so you can trade with confidence. Bull vs Bear  helps you enter trades during
ATTUALMENTE SCONTATO DEL 40% La soluzione migliore per ogni principiante o trader esperto! Questo indicatore è uno strumento di trading unico, di alta qualità e conveniente perché abbiamo incorporato una serie di caratteristiche proprietarie e una nuova formula. Con un solo grafico è possibile leggere la forza delle valute per 28 coppie Forex! Immaginate come migliorerà il vostro trading perché sarete in grado di individuare l'esatto punto di innesco di una nuova tendenza o di un'opportunità
Un indicatore tecnico che struttura i grafici e identifica i movimenti ciclici dei prezzi. Può funzionare su qualsiasi grafico. Diversi tipi di notifiche. Ci sono altre frecce sul grafico stesso. Senza ridisegnare la storia, lavora sulla chiusura della candela. TF consigliati da M5 in su. Parametri facili da usare e configurare. Se si utilizzano 2 indicatori con parametri diversi, è possibile utilizzarli senza altri indicatori. Ha 2 parametri di input Ciclicità e durata del segnale Questi 2 pa
Special offer : ALL TOOLS , just $35 each! New tools   will be   $30   for the   first week   or the   first 3 purchases !  Trading Tools Channel on MQL5 : Join my MQL5 channel to update the latest news from me Il Fibonacci Confluence Toolkit Multi-Timeframe è uno strumento avanzato di analisi tecnica progettato per trader professionisti, che aiuta a identificare potenziali zone di inversione del prezzo combinando segnali e modelli chiave del mercato. Con capacità di visualizzazione multi-timef
Altri dall’autore
The indicator displays the resistance/support levels based on the history data of price action. It requires a depth of history to calculate the levels. The tool has been developed using an original proprietary technique. The resistance and support levels indicate the accumulations of orders. Indicator Parameters Start Data/Time - initial date/time of the history data for calculation of levels Width of Lines Resistance/Support in Points - thickness (density) of lines in points, it is recommended
The main function of the indicator is to draw the target lines (support and resistance lines). The lines are plotted according to a special fractal algorithm. The lines are calculated with consideration of the zero bar. A different, more complicated calculation algorithm is used on the zero bar, in contrast to the other bars. This allows reacting to the market situation in real time, but on the other hand, redrawing is possible on the zero bar. If necessary, the zero bar can be omitted from calc
Пинбар — это лишь 1 свечка или бар, представляющая собой цену, что отскочила от максимального или минимального ценового уровня. Свечка открылась, цена пошла в одном направлении и затем резко развернулась за период свечи — так формируется пинбар. Пинбар легко заметить — длинная тень (хвост), маленькое тело. Запомните: не все свечи с длинным хвостом являются пинбарами. Только когда хвост намного больше тела свечи, формируется пинбар. Как правило, рынок при этом закрывается там, где открылся или по
A regression channel based on roughened fractals. Parameters: Period ReCalculate - indicator calculation period switch Zero (Last) Bar-count the last open bar? switch Push notifications when changing the position of the rounded price relative to the channel Line Risk-displaying the risk line Coeff Risk,% - the maximum percentage in the transaction as a percentage The channel allows you to evaluate the trend and its strength in the market and correctly place a request for a transaction with the r
Indicatore grafico per l'analisi del risultato del trading, indicatori di direzione, lavoro del consulente, sviluppo della strategia di trading. Un parametro principale è la percentuale minima di profitto. L'indicatore mostra tutte le tendenze su qualsiasi grafico, tenendo conto della barra chiusa e del frattale, calcola la percentuale massima di profitto in ogni tendenza. Inoltre calcola la percentuale media del profitto dello strumento. Una percentuale maggiore tra gli strumenti indica l'a
Filtro:
Nessuna recensione
Rispondi alla recensione