THV Harmonic Patterns MT5
- Indicatori
-
Trong Khanh Phan
 About Me:
I am a professional trader and MQL5 developer with years of experience creating automated trading systems and indicators for the global trading community. My focus is on building reliable, efficient, and easy-to-use tools for traders of all levels. - Versione: 1.0
- Attivazioni: 5
Overview
THV Harmonic Pattern MT5 is a technical analysis indicator designed to automatically identify potential Harmonic Chart Patterns and display their structures directly on your MetaTrader 5 chart.
Using swing high and swing low detection combined with Fibonacci ratio analysis, the indicator identifies potential harmonic formations such as Gartley, Bat, Butterfly, Crab, and AB=CD patterns.
It also incorporates an RSI filter to help identify potential bullish and bearish trading opportunities, while automatically plotting projected Take Profit and Stop Loss levels for visual trade planning.
Whether you trade Gold, Forex, indices, or cryptocurrencies, THV Harmonic Pattern MT5 provides a convenient way to analyze harmonic price structures without manually measuring every swing and Fibonacci ratio.
Key Features
1. Automatic Harmonic Pattern Detection
The indicator identifies potential harmonic patterns based on swing points and Fibonacci relationships.
Supported patterns include:
-
Gartley: Identifies potential reversal structures based on specific Fibonacci retracement and extension ratios.
-
Bat: Detects harmonic formations characterized by their retracement and completion ratios.
-
Butterfly: Identifies extended harmonic structures that may signal potential reversal areas.
-
Crab: Detects harmonic formations characterized by deeper price extensions.
-
AB=CD: Recognizes price structures where the AB and CD legs have approximately equal lengths.
2. Dual Swing Detection
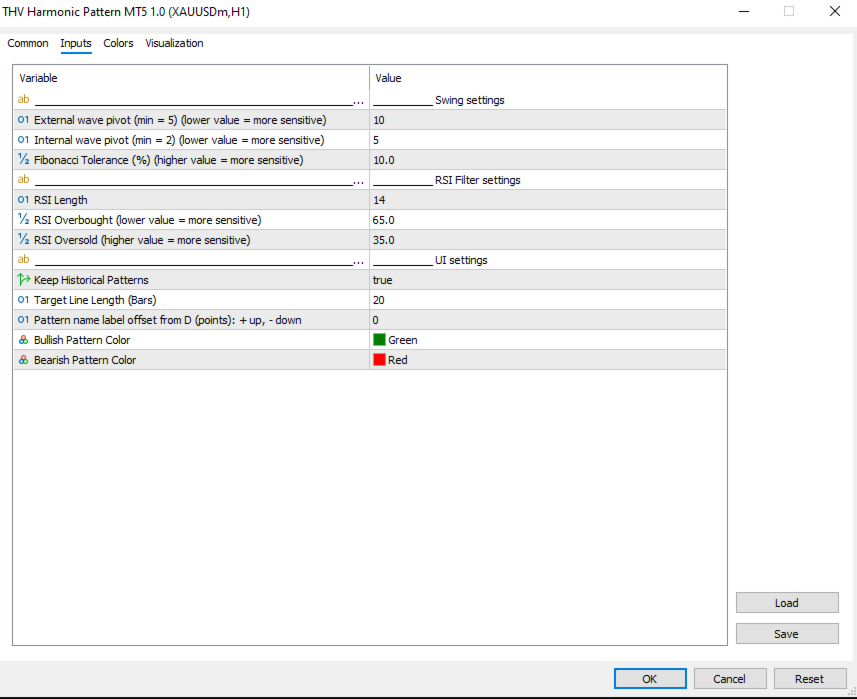
The indicator uses two swing detection settings to analyze price movements at different scales.
-
External Swing: Identifies broader price movements and larger structural patterns.
-
Internal Swing: Detects smaller price movements and more sensitive pattern formations.
Adjust the swing periods to control detection sensitivity. Lower values generally detect more frequent turning points, while higher values focus on broader price movements.
3. Fibonacci Tolerance Settings
Harmonic patterns rely on specific Fibonacci ratios. However, real market movements rarely match theoretical ratios perfectly.
The adjustable Fibonacci Tolerance setting allows you to control how closely price structures must match the target ratios.
-
Lower tolerance: Stricter pattern matching.
-
Higher tolerance: More flexible pattern matching.
This setting helps you adapt the indicator to different instruments and market conditions.
4. RSI Confirmation Filter
The indicator integrates the Relative Strength Index (RSI) to help evaluate potential bullish and bearish reversal opportunities.
-
Bullish Setup: Looks for RSI conditions around the oversold threshold.
-
Bearish Setup: Looks for RSI conditions around the overbought threshold.
-
Customizable RSI Period: Adjust the RSI calculation length.
-
Adjustable Overbought and Oversold Levels: Configure the thresholds to suit your trading approach.
The RSI filter is designed to complement harmonic pattern analysis rather than replace price-action confirmation.
5. Automatic Pattern Visualization
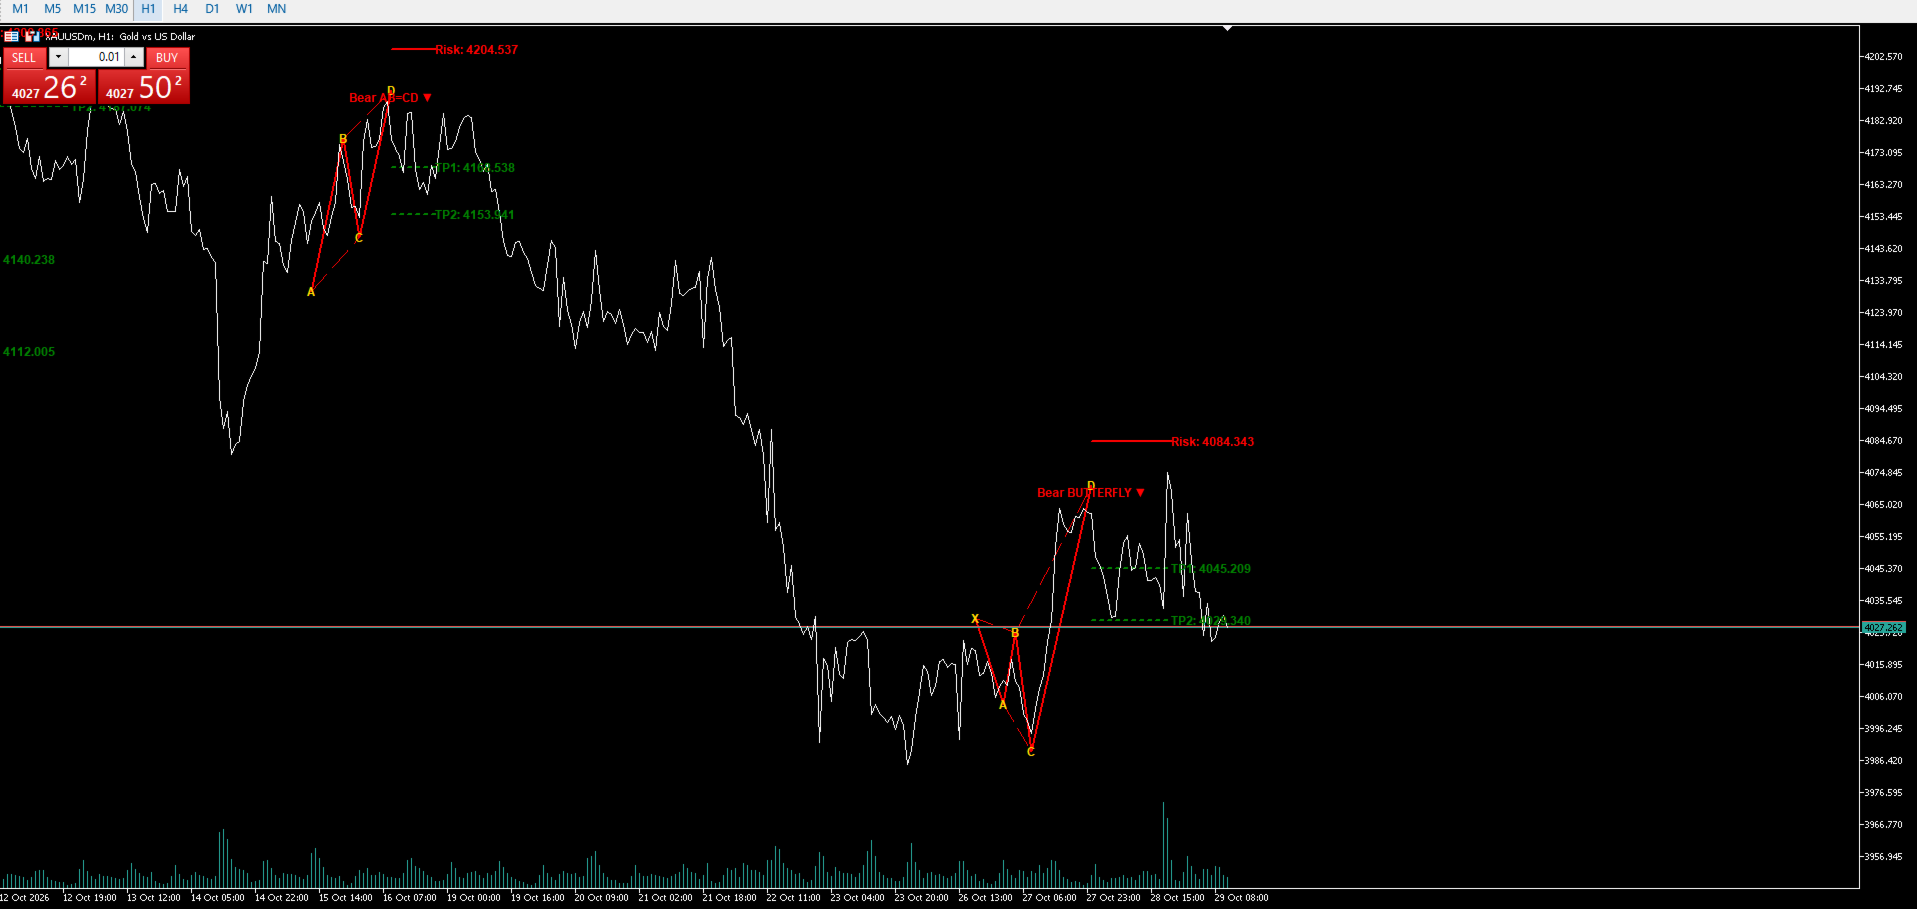
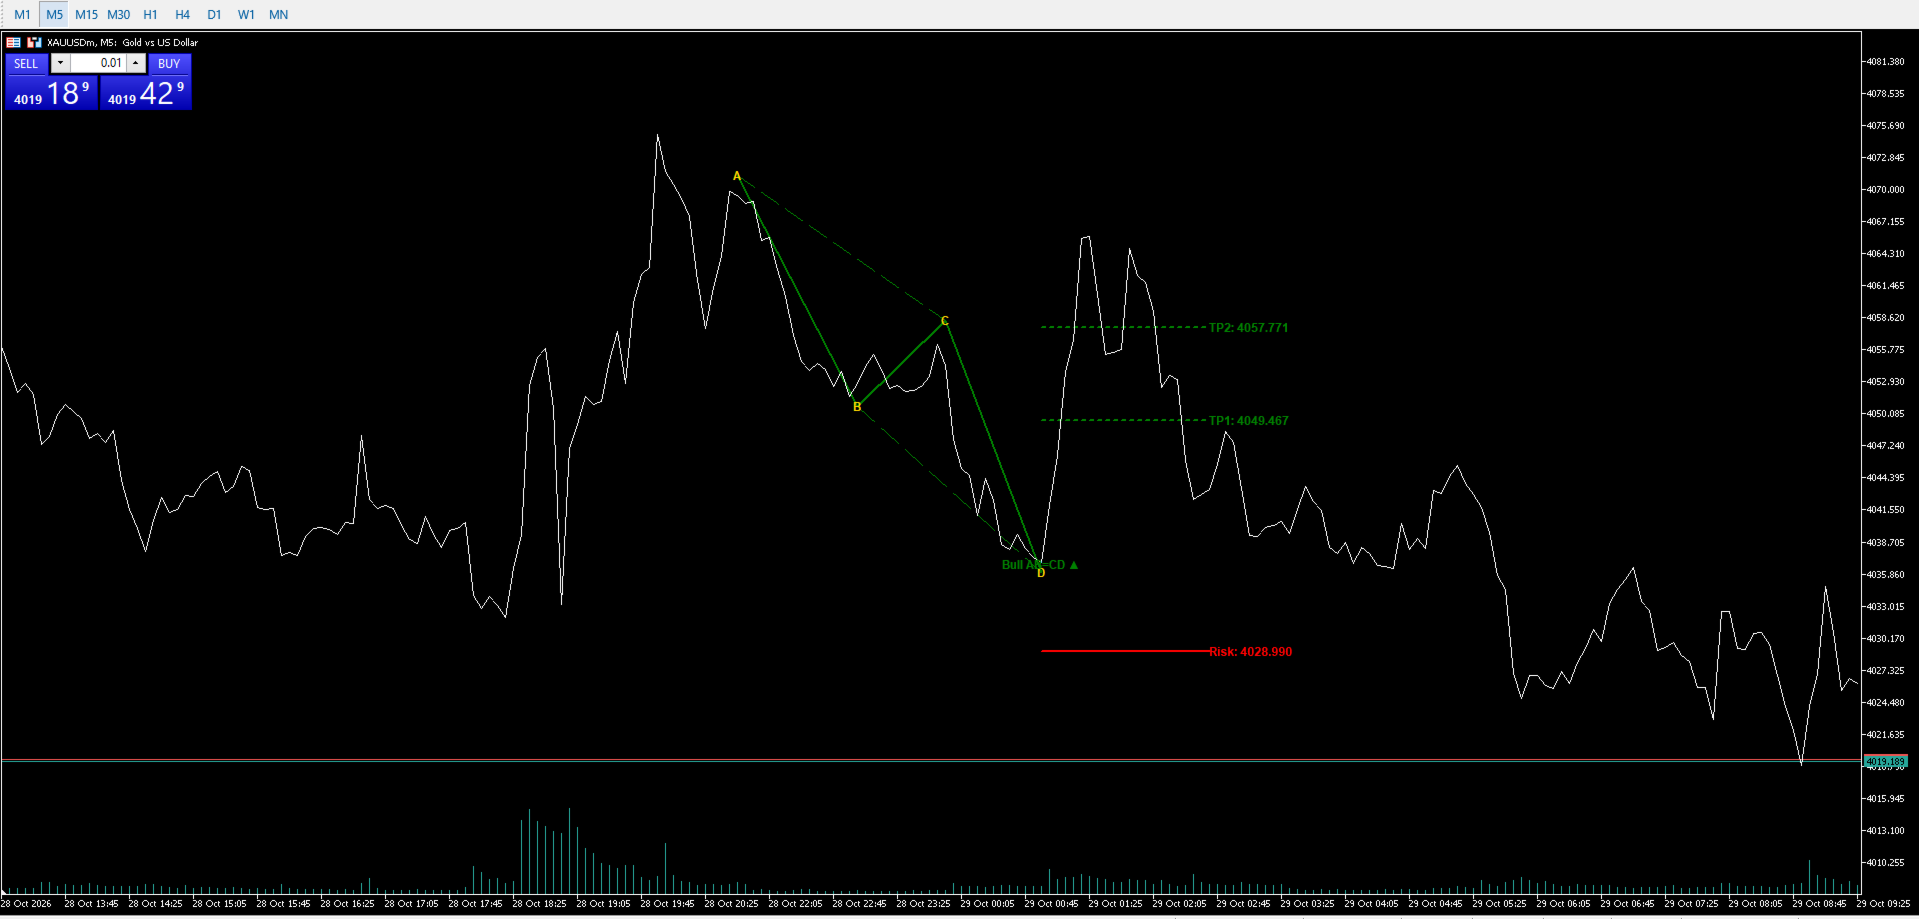
When a qualifying pattern and RSI condition are identified, the indicator automatically draws the pattern structure on your chart.
The display includes:
-
Clearly marked X, A, B, C, and D swing points when applicable.
-
Connecting lines between the pattern's structural points.
-
Dashed lines highlighting internal pattern relationships.
-
Pattern names with bullish or bearish directional labels.
-
Different colors for bullish and bearish setups.
This visual presentation makes it easier to inspect the pattern structure and understand the potential trade direction.
6. Automatic Take Profit and Stop Loss Levels
The indicator calculates and displays projected trade management levels based on the detected pattern's price structure.
-
TP1: A projected target based on a 38.2% retracement of the AD distance.
-
TP2: A projected target based on a 61.8% retracement of the AD distance.
-
Stop Loss: A reference level calculated using a 20% extension of the AD distance beyond point D.
The target and risk levels are displayed directly on the chart with horizontal projection lines and price labels.
These levels are intended for visual planning and should be reviewed against market structure, volatility, and your own risk management rules.
7. Customizable Chart Display
Configure the indicator to match your trading preferences.
-
Enable or disable historical pattern display.
-
Adjust the projected target line length.
-
Customize bullish and bearish pattern colors.
-
Adjust the pattern label position.
-
Modify swing sensitivity and Fibonacci tolerance.
-
Configure RSI period and overbought/oversold thresholds.
The flexible settings allow you to balance pattern sensitivity and chart readability.
How to Use
A suggested workflow for using THV Harmonic Pattern MT5 is:
-
Attach the indicator to your MetaTrader 5 chart.
-
Configure the external and internal swing periods.
-
Adjust Fibonacci tolerance to control pattern detection sensitivity.
-
Set the RSI period and overbought/oversold thresholds.
-
Wait for a qualifying harmonic pattern and RSI condition to appear.
-
Examine the pattern's structure, especially point D, for a potential reversal area.
-
Review the projected TP1, TP2, and Stop Loss levels before making a trading decision.
For additional confirmation, consider combining the indicator with support and resistance, market structure, candlestick patterns, or other technical analysis tools.
Suitable For
THV Harmonic Pattern MT5 is suitable for traders who use:
-
Harmonic Pattern Trading.
-
Fibonacci Retracement and Extension Analysis.
-
Price Action and Reversal Trading.
-
RSI-Based Confirmation.
-
Intraday Trading and Swing Trading.
It can be applied to Gold (XAUUSD), Forex pairs, indices, and cryptocurrencies, depending on your broker's available instruments and market data.
Important Notes
-
The indicator is an analytical tool and does not automatically execute trades.
-
Detected patterns represent potential harmonic structures, not guaranteed reversals.
-
Swing points and the current pattern structure may change as new price data arrives.
-
Fibonacci tolerance affects detection sensitivity and may influence the number of patterns identified.
-
Take Profit and Stop Loss levels are calculated reference levels, not recommendations tailored to your account balance or risk tolerance.
-
Always test the indicator on a demo account and apply appropriate risk management before trading with real funds.
Happy trading !