Wick Map

  • Indicatori
  • Anna Makwana
    Anna Makwana
    MetaTrader tools and indicators that measure the odds on your own chart: how often levels were reached, how far days and sessions usually run, and what followed past signals. Every figure comes from the symbol’s own price history and uses closed bars only, so nothing repaints. Questions are welcome
  • Versione: 1.0

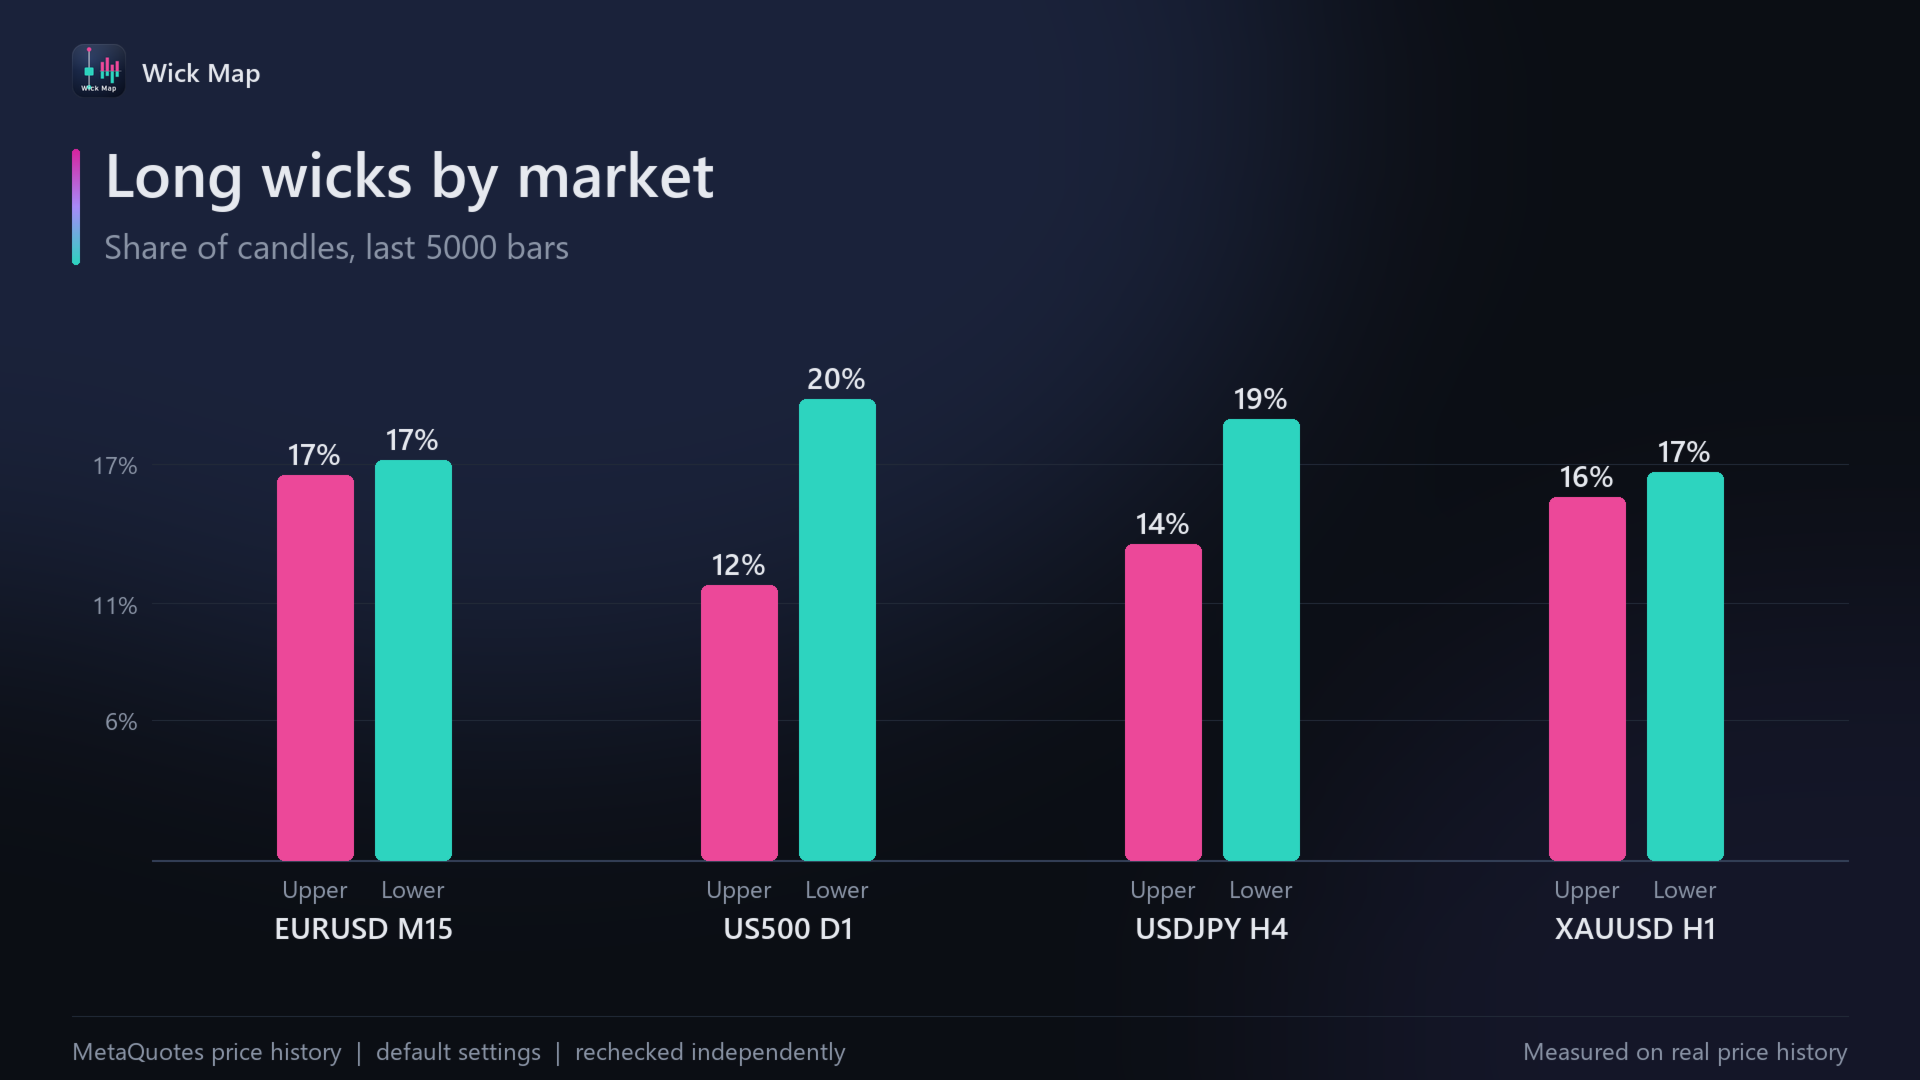
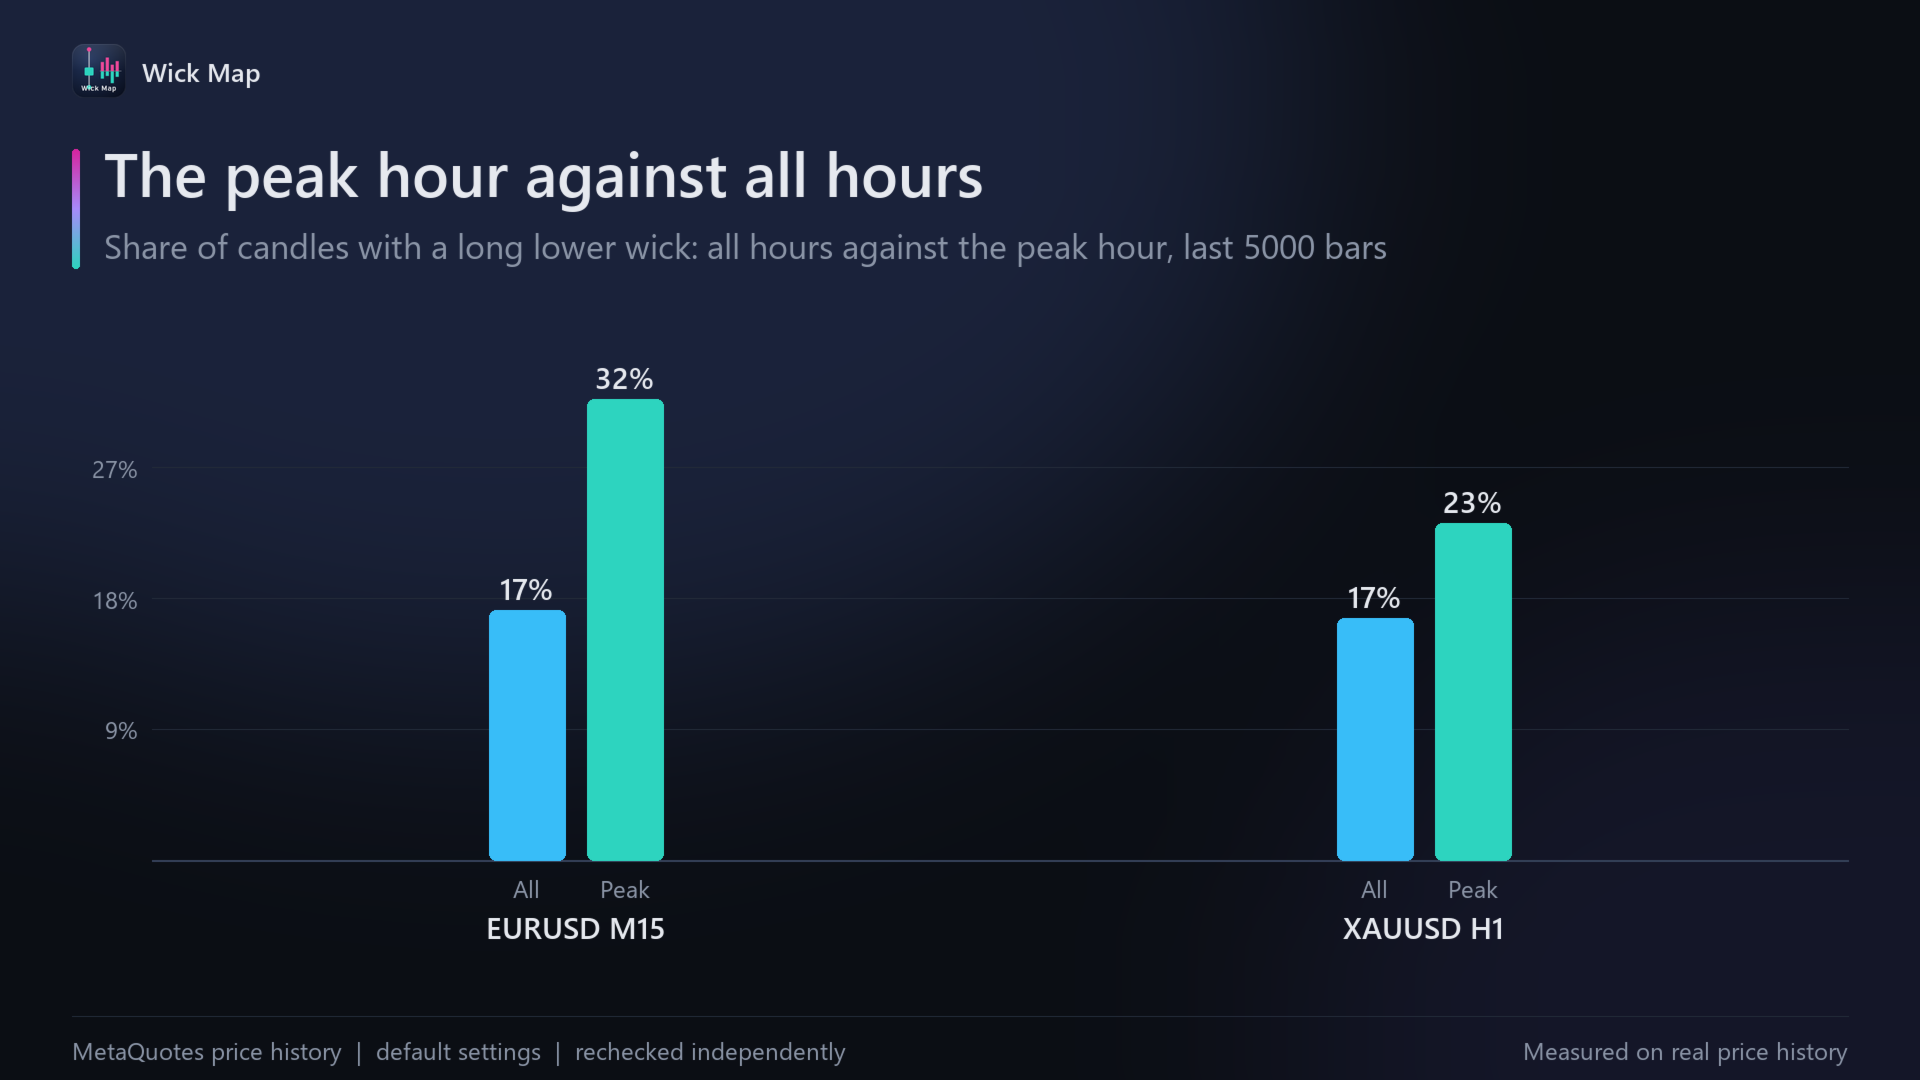
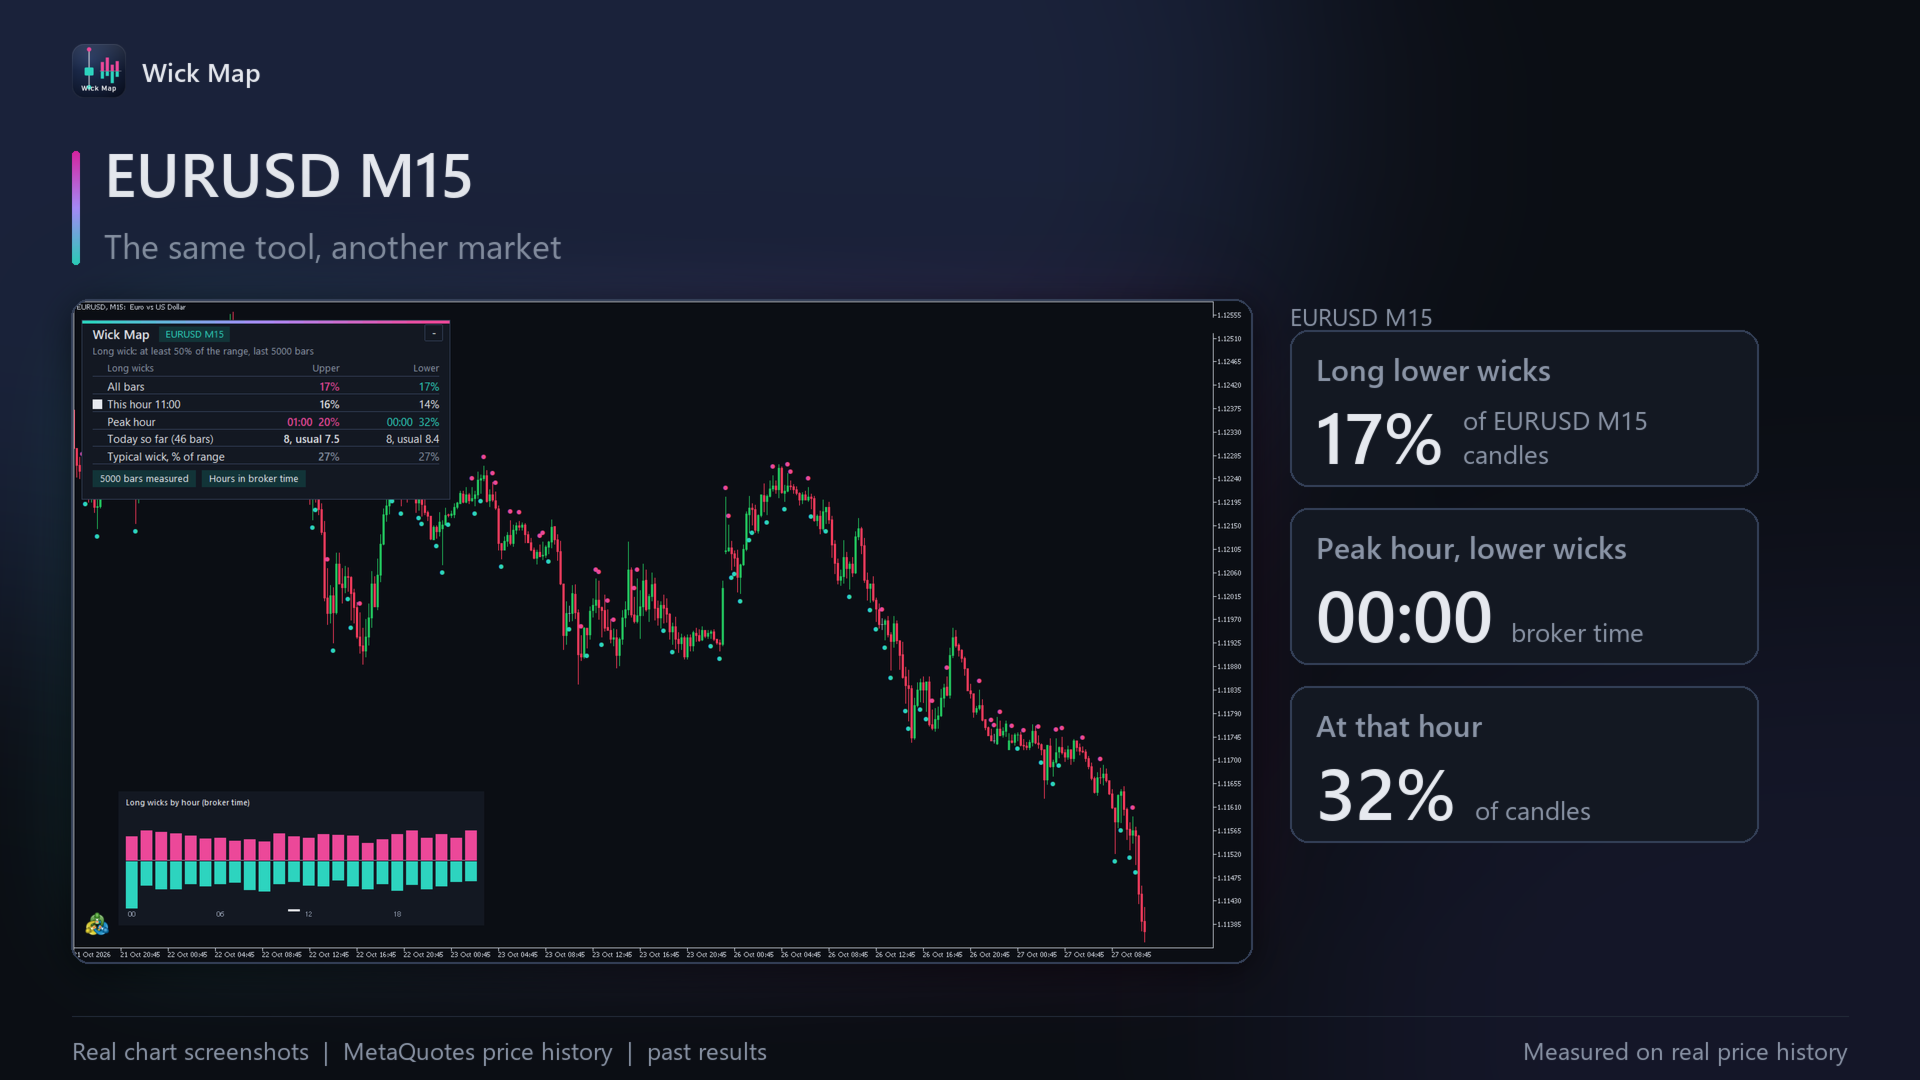
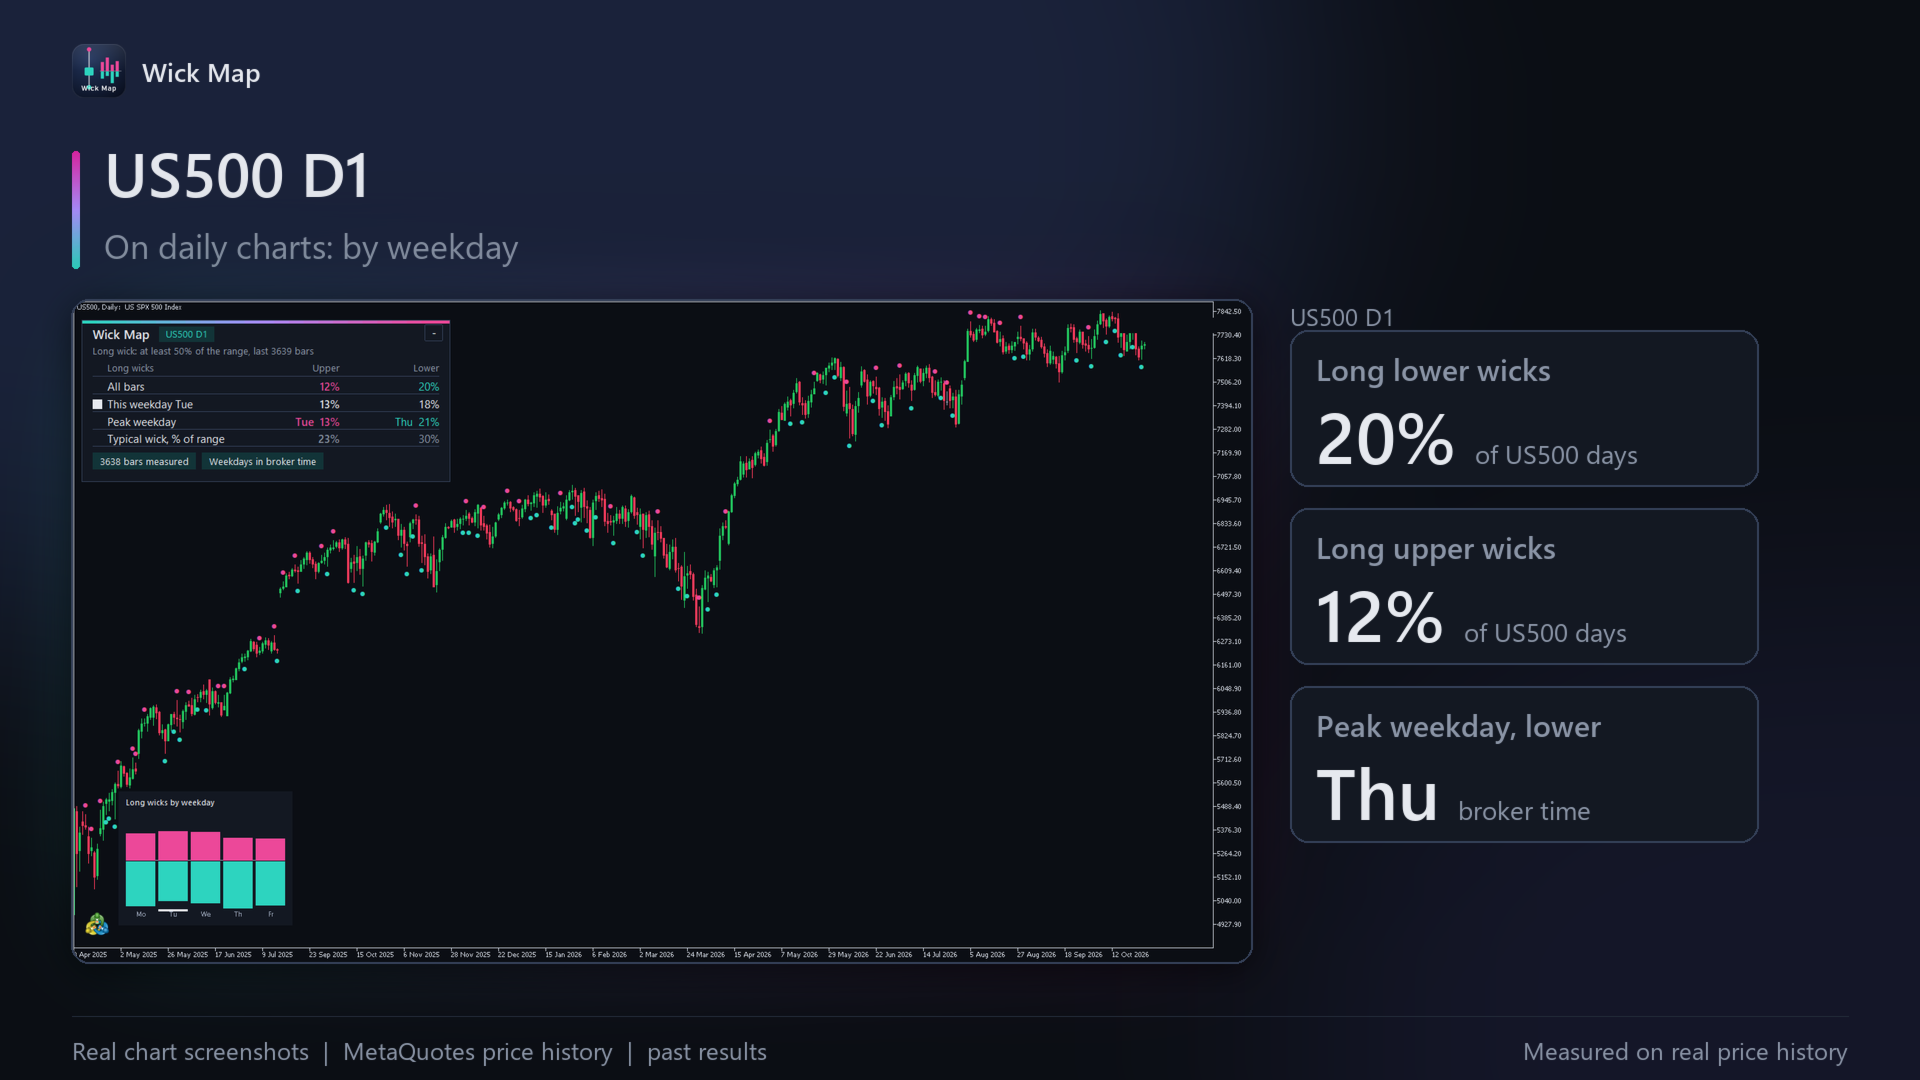
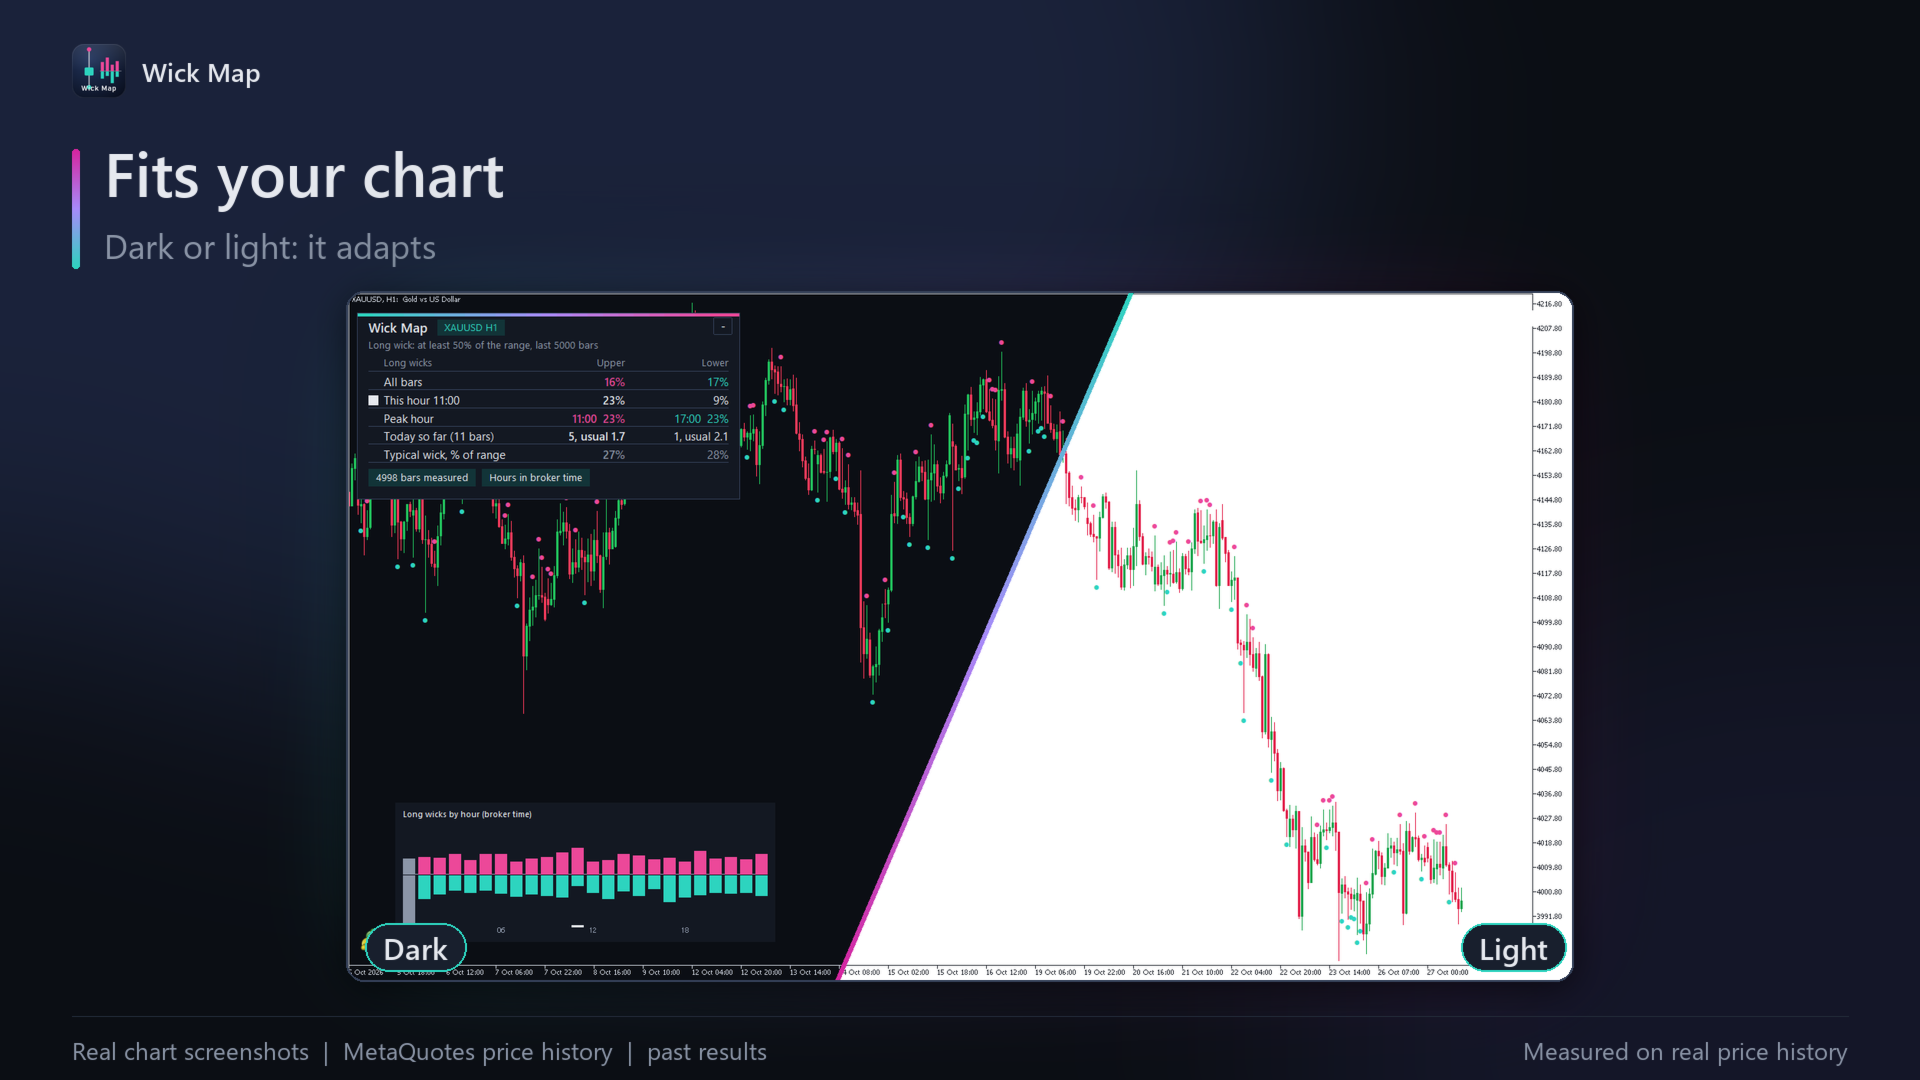
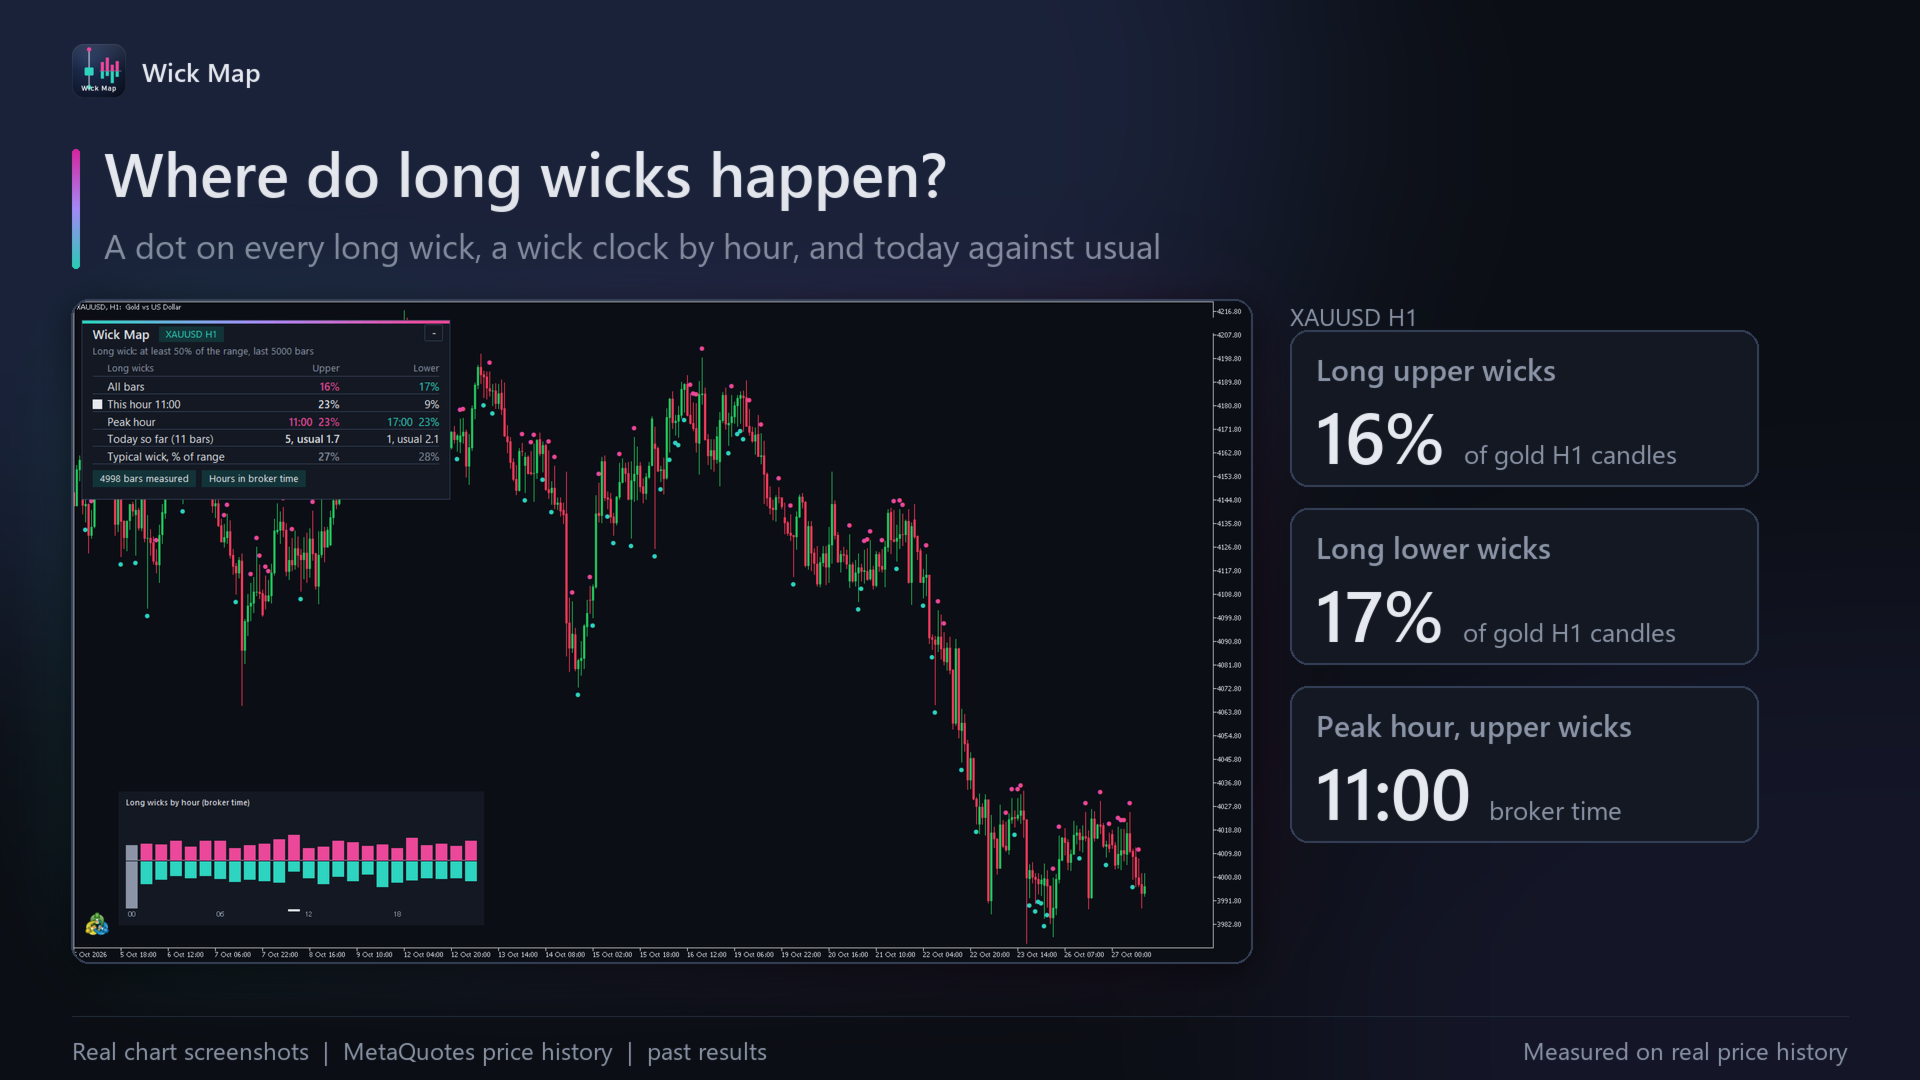
Wick Map shows where long wicks happen on your symbol: a dot on every long upper and lower wick, a wick clock that splits them by hour of the day, and today's long wicks against the usual for the same hours. On EURUSD M15, 32% of the candles opening at 00:00 broker time had a long lower wick, against 17% over all hours. On US500 D1, long lower wicks came on 19.8% of days and long upper wicks on 11.8%. Closed bars only, so it never repaints. Every number is verified against a separate implementation before each release.

What it does

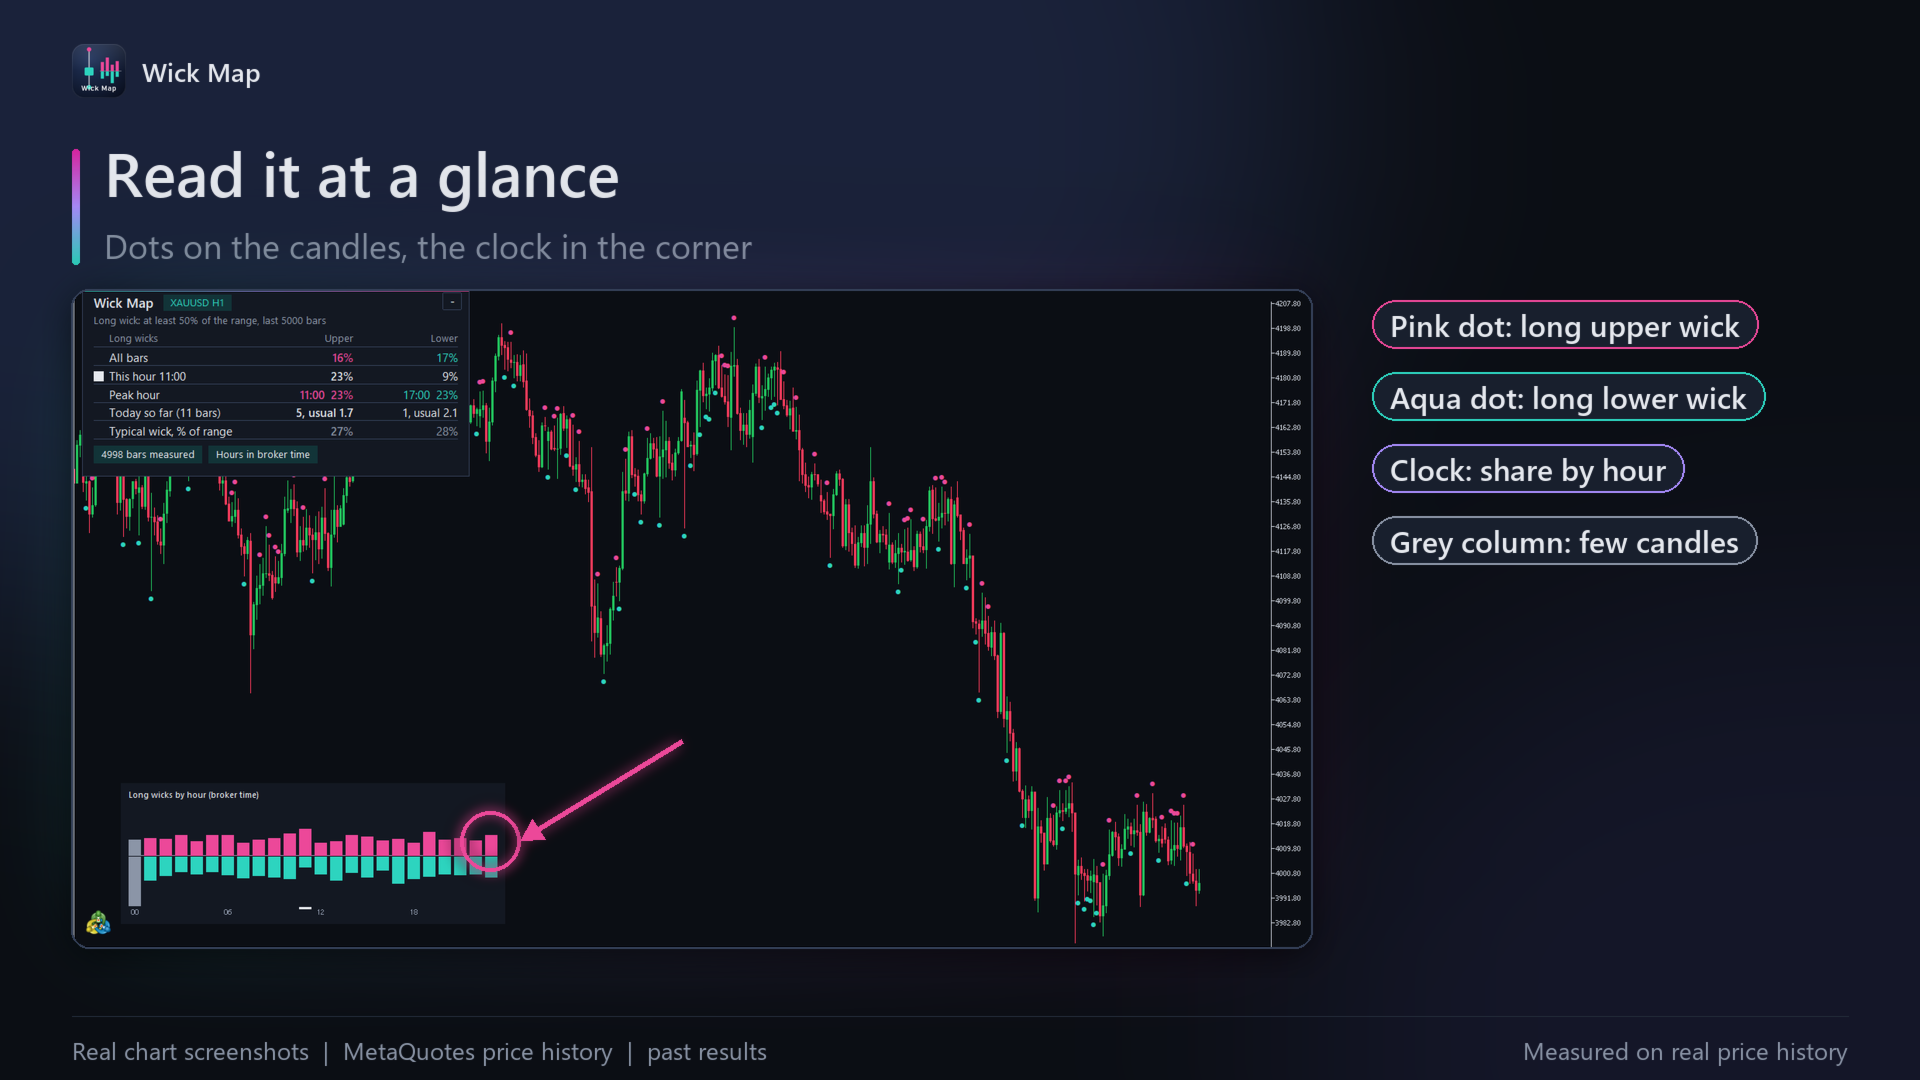
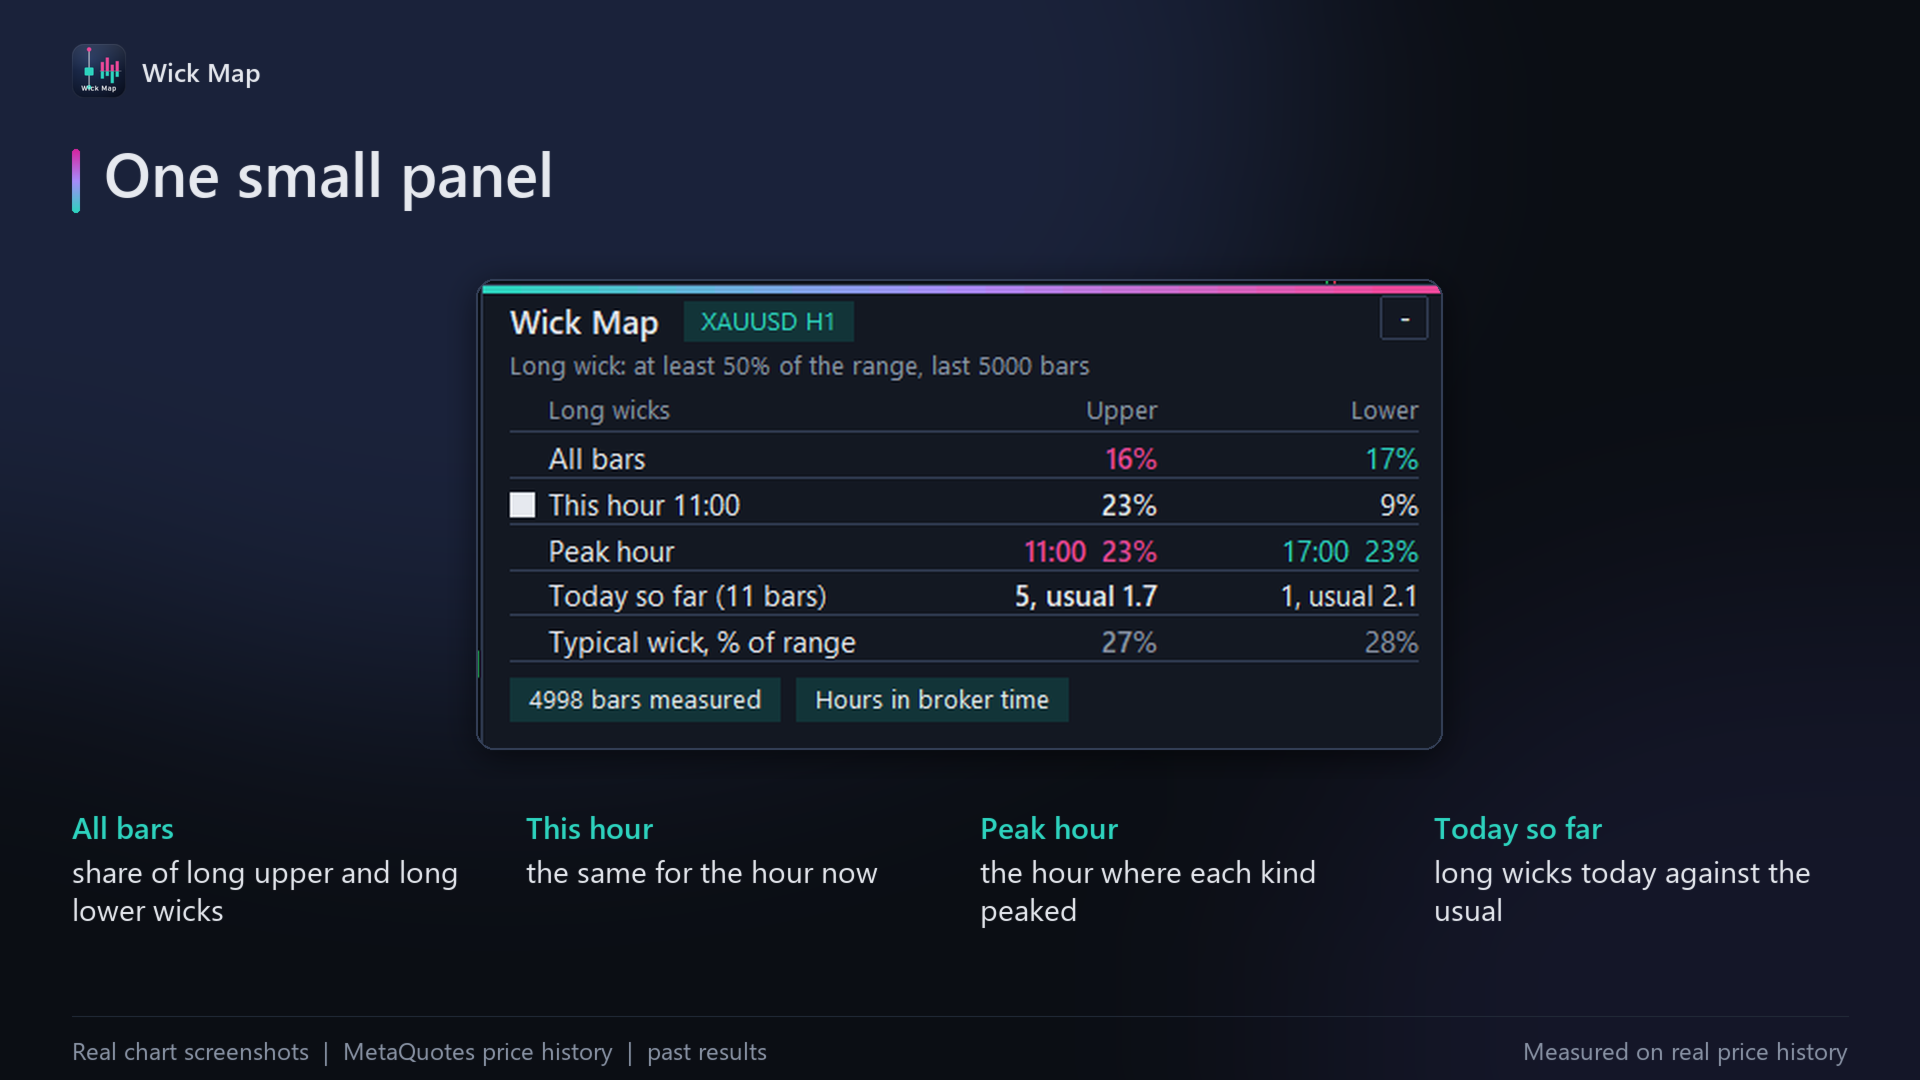
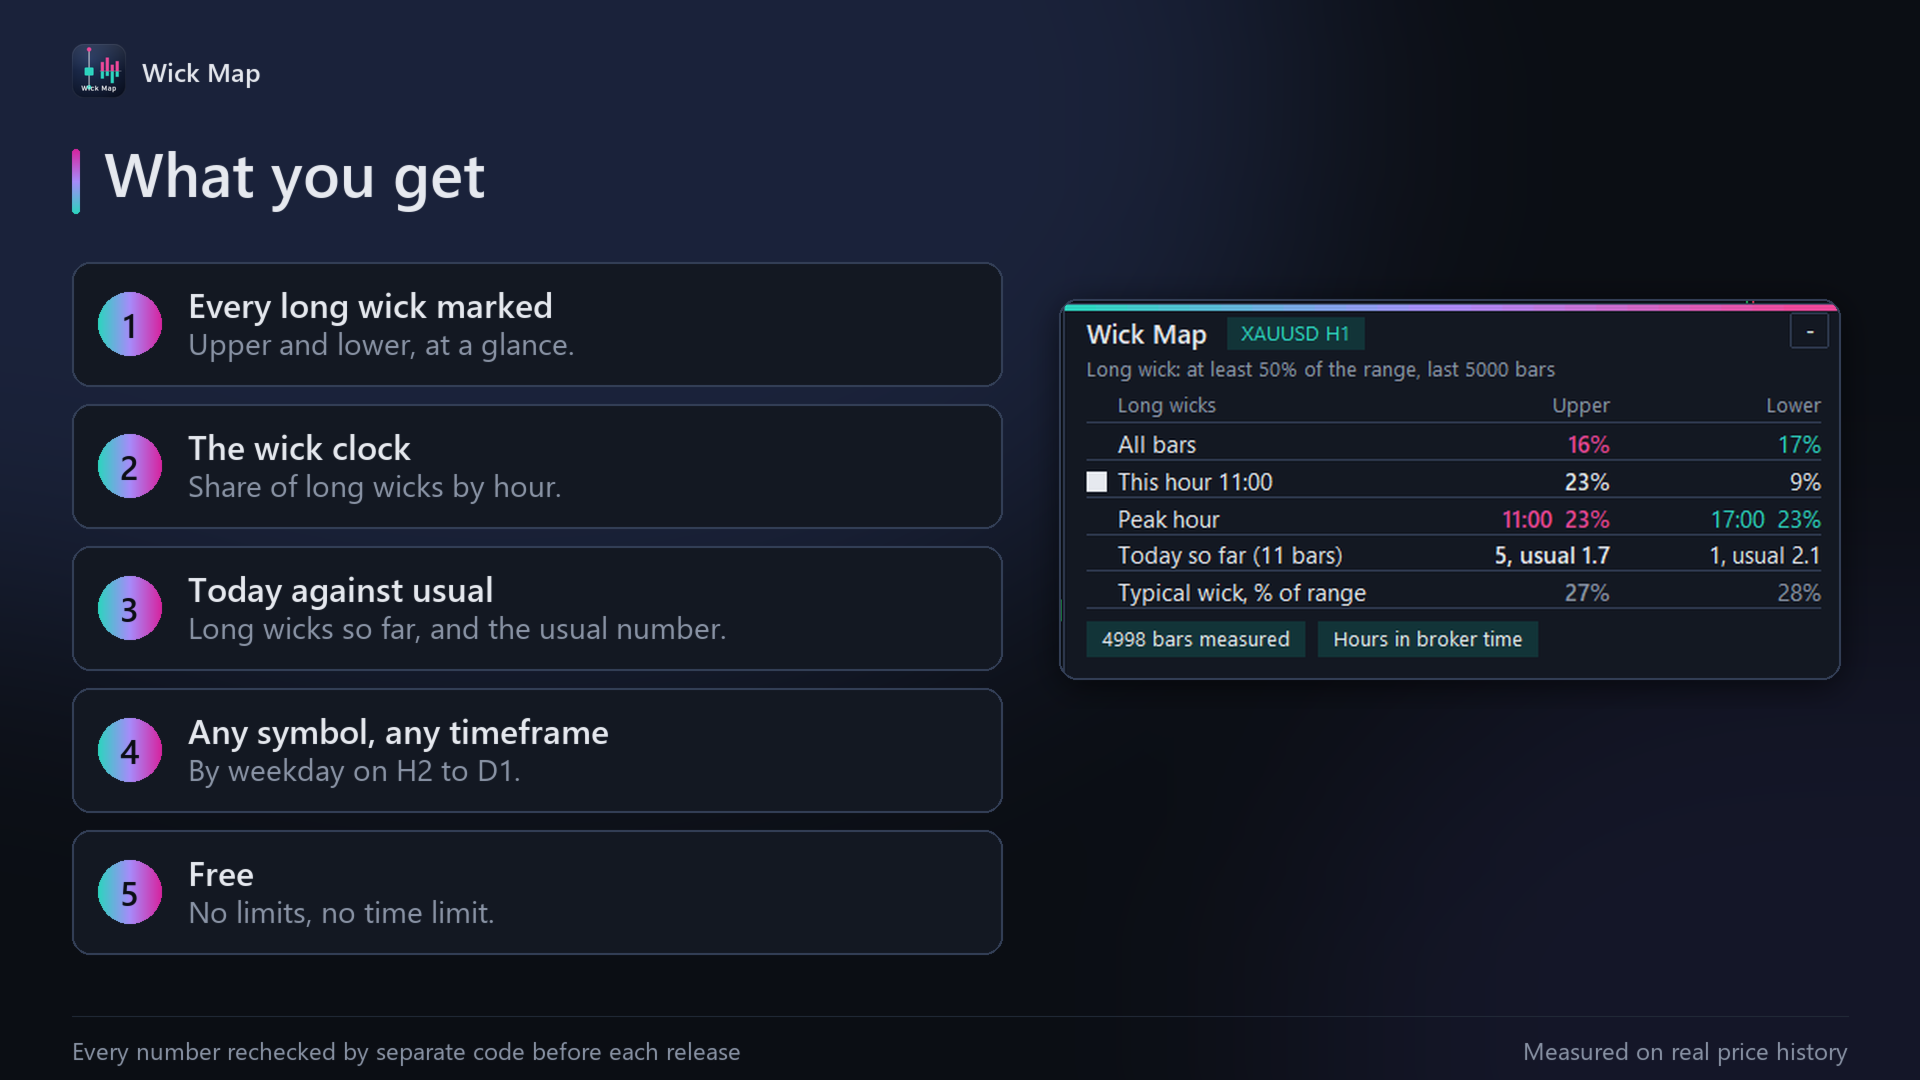
A small dot marks the tip of every long wick on the price chart: pink above the candle for a long upper wick, aqua below it for a long lower wick. The wick clock in the lower-left corner has one column per hour of the day (broker time): the pink bar above the line is the share of candles in that hour with a long upper wick, the aqua bar below it the share with a long lower wick, and the hour now is underlined. On H2 to D1 charts the clock has one column per weekday instead. A small panel shows the share of long upper and lower wicks over all bars and for the hour now, the peak hour for each, today's long wicks so far against the usual number for the same hours, and the typical wick as a share of the candle's range.

How it works

A wick is long when it covers at least half of the candle's range, high to low (you can set 20% to 90%). Every finished candle in the last 5000 bars is measured by default; candles with no range are left out. Hours and weekdays come from each candle's open time on your broker's server, so the clock matches your chart. Hours with fewer than 20 candles are shown in grey.

How it was tested

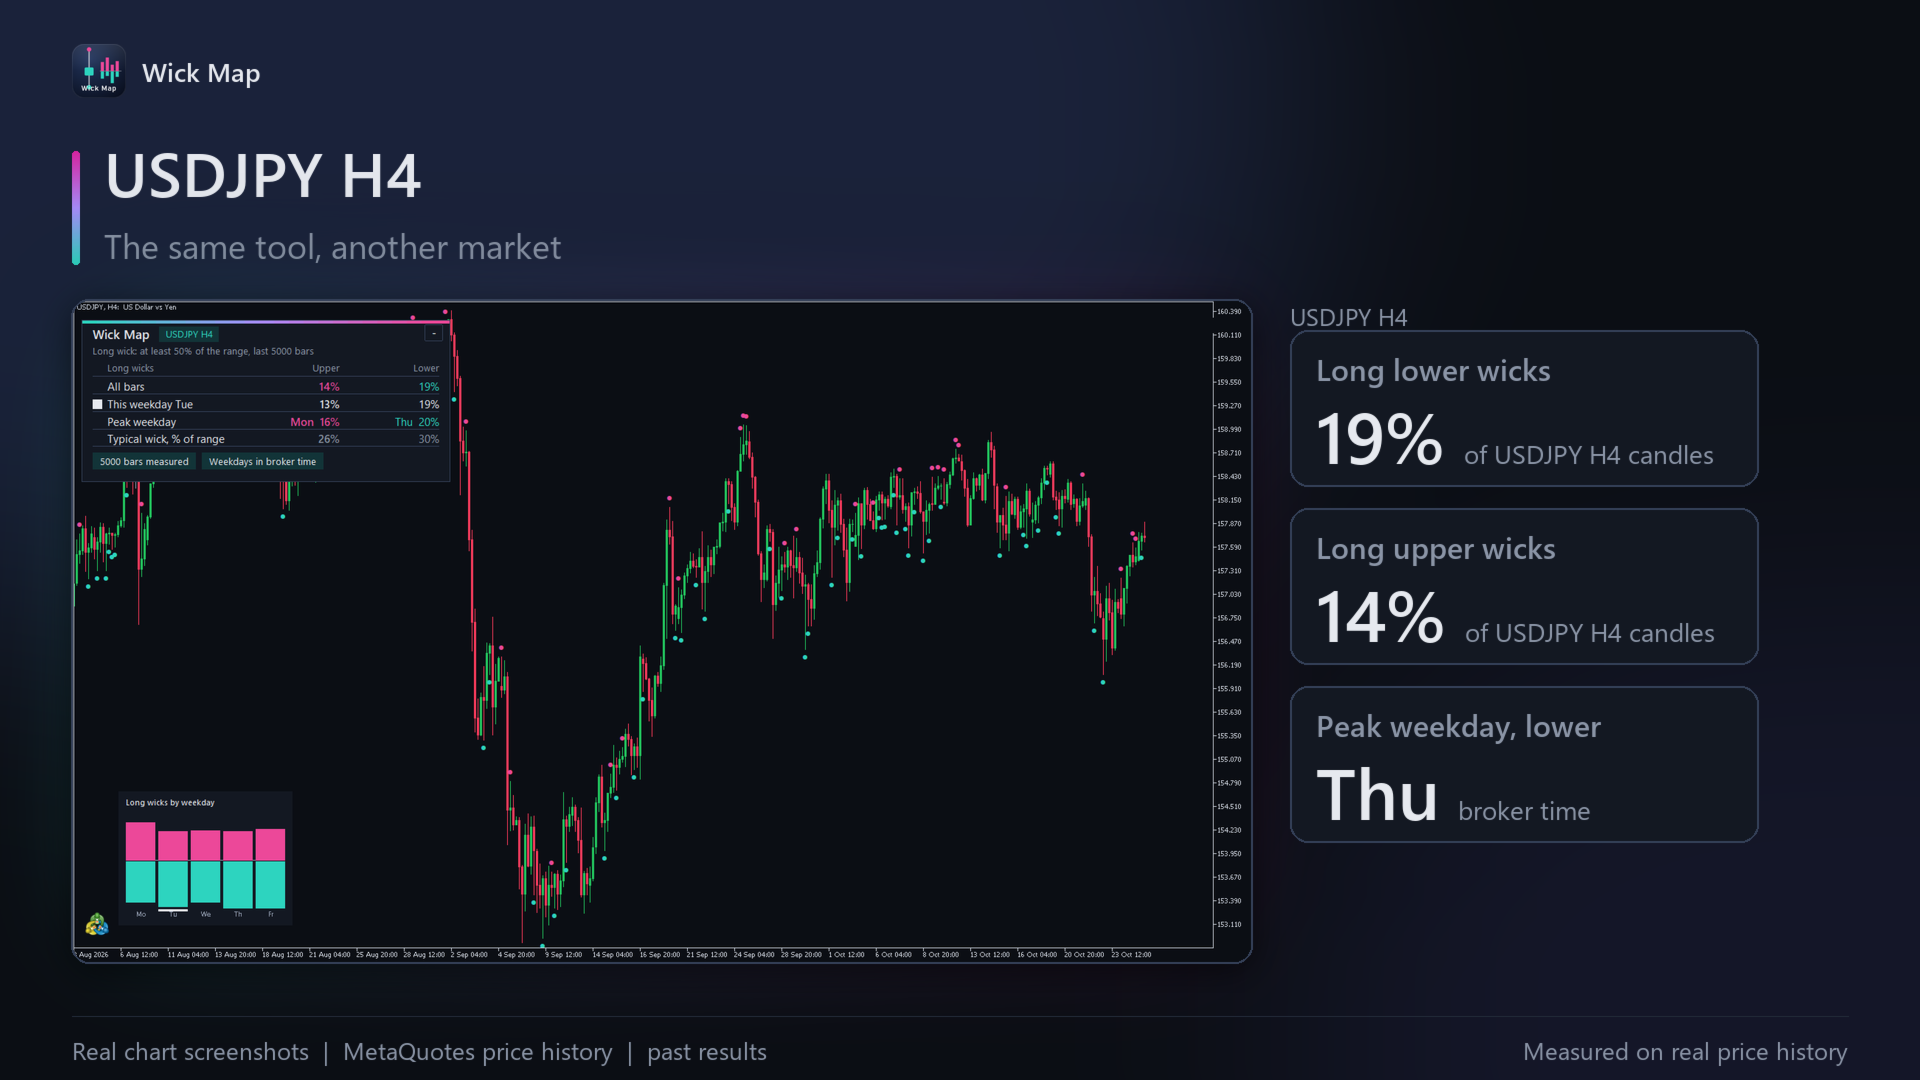
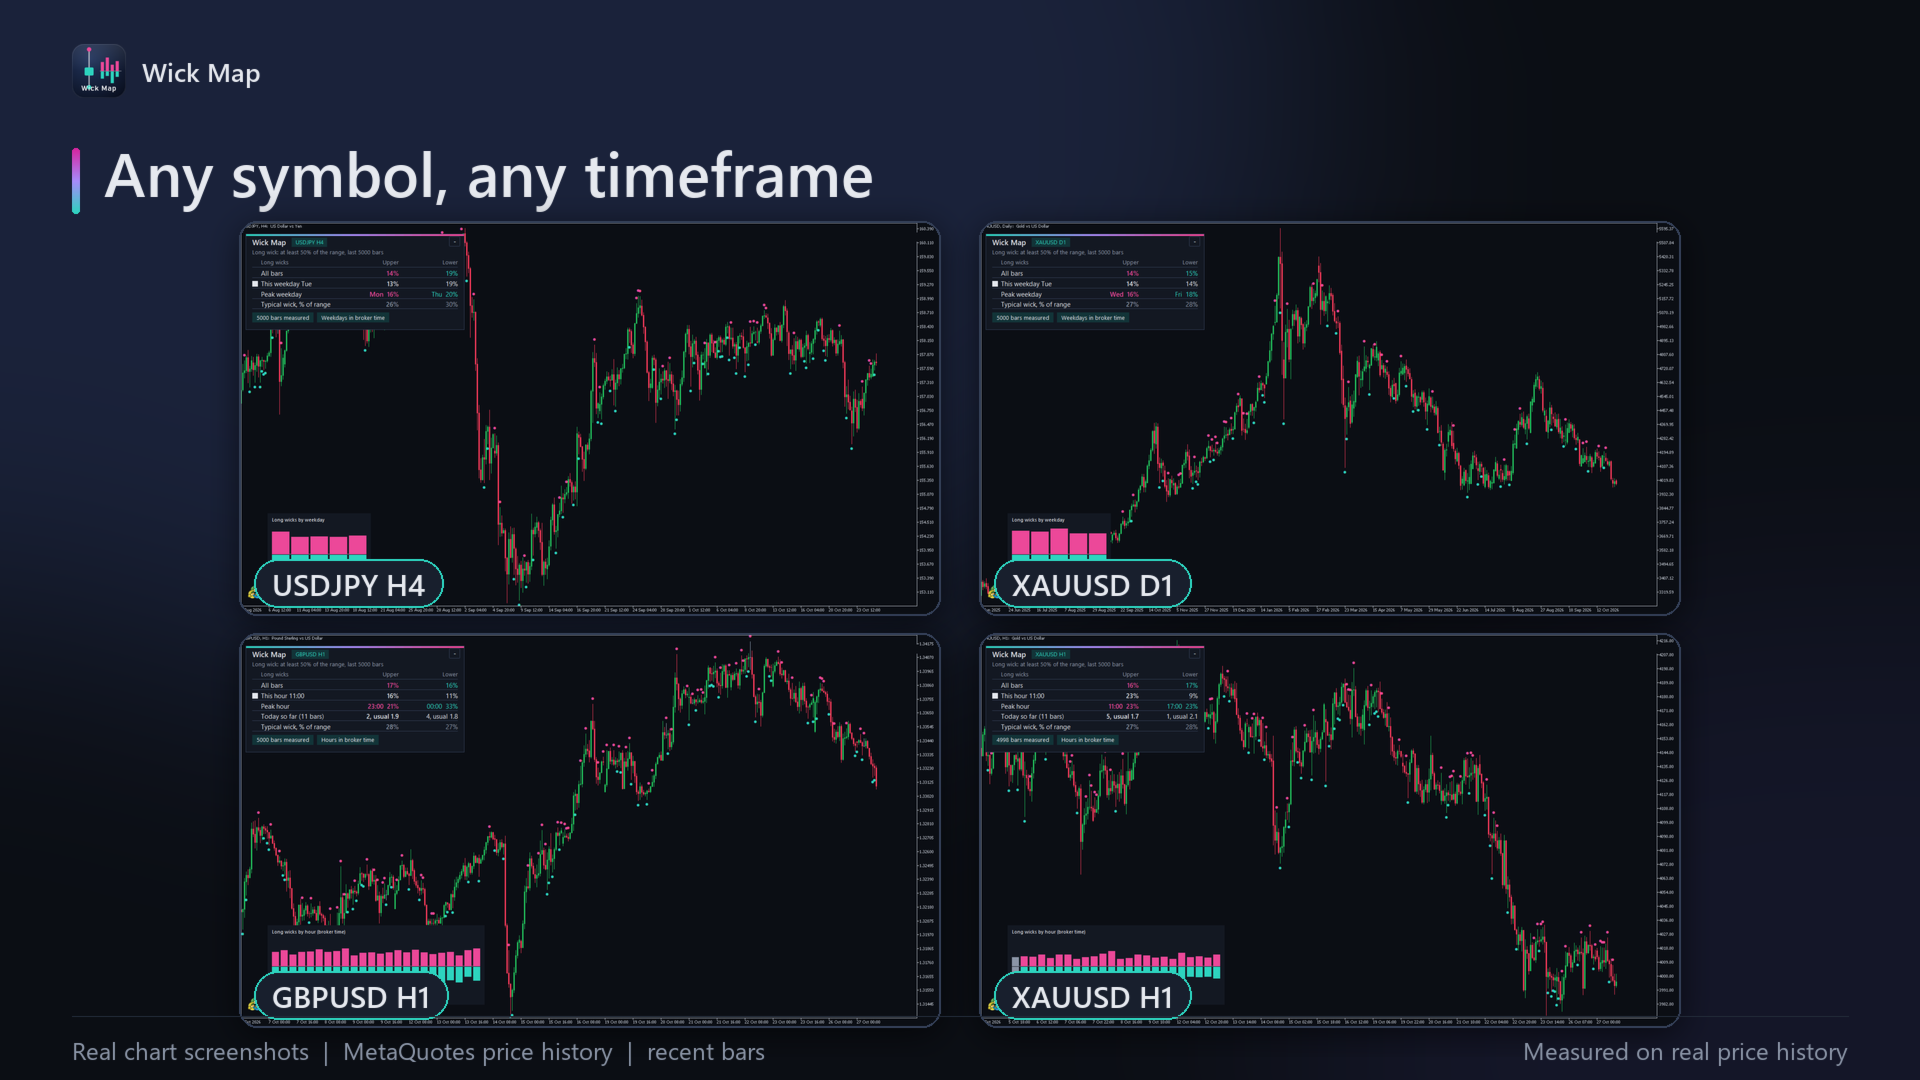
Every figure (each candle's marks, the counts and shares for each hour or weekday, the peak hours, today's counts and the usual numbers) is recomputed by a separate implementation from the same broker data and matches it to the last decimal, on gold, EURUSD, US500 and USDJPY across H1, M15, D1 and H4, at long-wick settings from 30% to 70% and several history lengths.

Results and risks

Over the last 5000 bars: on gold H1, 15.6% of candles had a long upper wick and 16.7% a long lower wick, and the peak hour for upper wicks was 11:00 broker time at 23%. On EURUSD M15, 32% of the 00:00 candles had a long lower wick, against 17% over all hours. On US500 D1, long lower wicks came on 19.8% of days and long upper wicks on 11.8%. These describe past candles, not the future, and hours depend on your broker's server time.

Recommended use

Any symbol and any timeframe, from M1 to monthly, with at least 100 finished candles; the wick clock by hour works on M1 to H1. Typical uses: seeing at a glance which hours of the day tend to leave long wicks on this symbol, noticing when today has had more long wicks than usual, and finding past long-wick candles on the chart.

Inputs

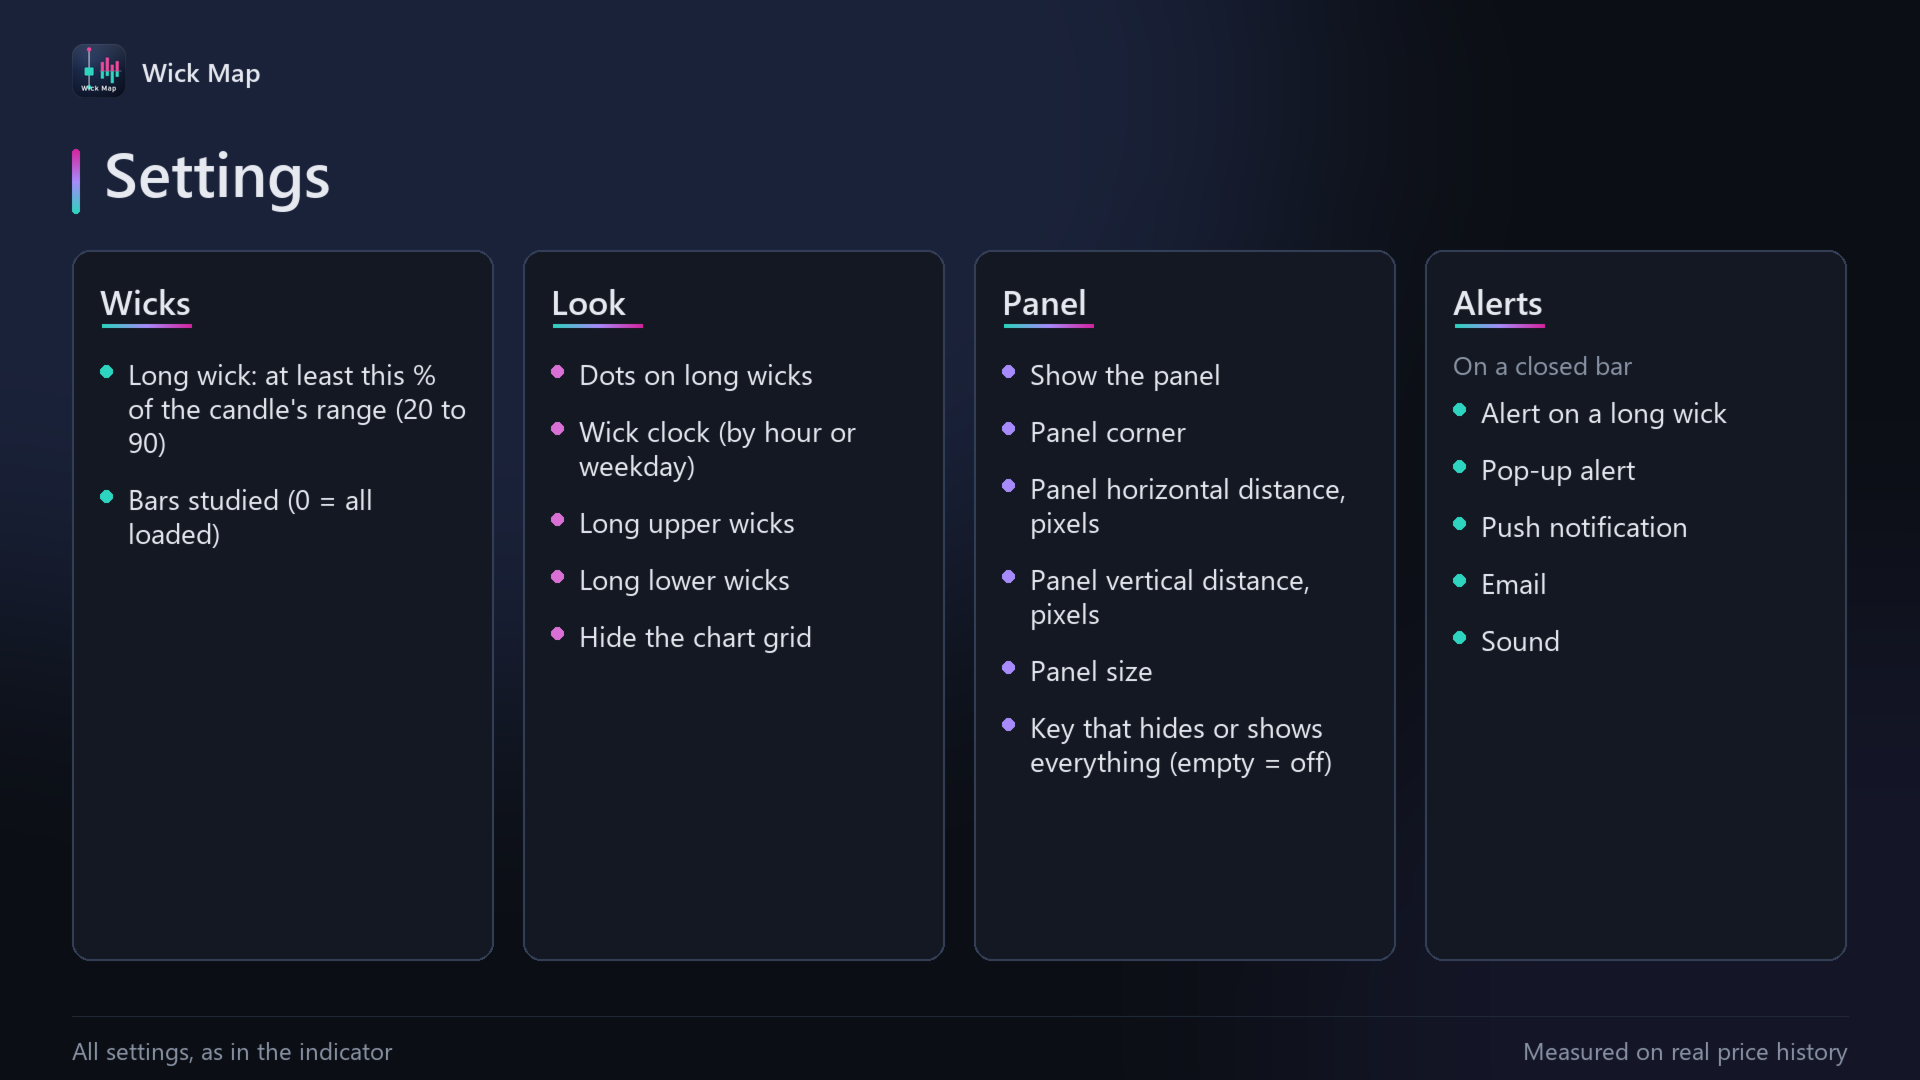
  • Long wick: at least this share of the candle's range (50% by default, 20% to 90%).
  • Bars studied: 5000 by default; 0 uses all loaded history.
  • Dots on long wicks and the wick clock: each can be switched off.
  • Colours for long upper and long lower wicks.
  • Panel: show or hide, any chart corner, distance from the edges in pixels, and size (small, normal, large). One key (H by default) hides or shows everything the indicator draws.
  • Alert on a long wick: pop-up, push, email or sound, on a closed bar.
  • Hide the chart grid: on by default.

Risk notice

Trading forex, metals, indices and other leveraged products carries a high risk of loss. Wick Map is an analysis tool: it does not give investment advice or trading recommendations, and it does not guarantee any result. All figures describe past data, and past behaviour does not guarantee future behaviour. You are responsible for your own trading decisions.

Support

Questions? Message me through MQL5 chat.

Useful? A short review helps other traders find it.

A full guide with pictures: https://www.mql5.com/en/blogs/post/778547
Prodotti consigliati
CosmiCLab SMC FIBO CosmiCLab SMC FIBO is a professional trading indicator designed for traders who use Smart Money Concepts (SMC), market structure analysis and Fibonacci retracement levels. The indicator automatically detects market swings and builds Fibonacci levels based on the latest impulse movement. It also identifies market structure changes such as BOS (Break of Structure) and CHOCH (Change of Character), helping traders understand the current market direction. CosmiCLab SMC FIBO also pr
RRtoolBox
David Ruiz Moreno
RRtoolbox - Professional Tools: Risk:Reward Trading Tool (SL/TP Horizontals + Pending orders + Diagonals), Alerts set on trend lines (for alerts on diagonal levels), SelfManagement (BE, partials...), close/cancelling by time, Statistics, Info and trading on chart. One-Click Trading with Visual Risk:Reward Management RRtoolbox is a comprehensive trading panel that combines one-click order execution,  statistics and  powerful visual Risk:Reward tools, alerts set with trendlines, on chart butt
DCA Buddy
Karim Abdelwahab
DCA Buddy is a utility indicator for MetaTrader 5 designed to calculate and display the break-even levels, profit targets, and recovery thresholds for open positions on the current chart. The indicator supports both single-direction baskets (buys only or sells only) and hedged positions (simultaneous buy and sell trades). Calculations use the native MetaTrader 5 profit calculation engine to account for contract specifications, broker tick values, and optional trading fees (swaps and commissions)
MSnR Lines
Pierre Paul Amoussou
MSnR Lines è un indicatore personalizzato progettato per visualizzare i livelli di supporto e resistenza su un grafico. Questi livelli si basano sulla teoria del supporto e della resistenza malese, che definisce i livelli non come aree, ma come specifici livelli di prezzo derivati dai picchi e dai valli del grafico a linee. Caratteristiche: Tre tipi di livelli: A-Level, V-Level e Gap Level. Indicazione di freschezza per i livelli: i livelli freschi sono più significativi dei livelli non freschi.
Fvg Edge
Ahmad Meftah Abdulsalam Alawwami
5 (3)
FVG Smart Zones – Edizione Gratuita Indicatore di Rilevamento dei Gap di Valore Equo per MetaTrader 5 (MT5) Cerchi uno strumento di trading reale – non solo un altro indicatore casuale? FVG Smart Zones – Edizione Gratuita fornisce una visione professionale del mercato rilevando automaticamente i Fair Value Gap (FVG) e evidenziando zone di trading ad alta probabilità direttamente sul grafico. Ideato per trader che seguono: Smart Money Concepts (SMC) ICT Trading Concepts Price Action
FREE
RBreaker
Zhong Long Wu
RBreaker Gold Indicators is a short-term intraday trading strategy for gold futures that combines trend following and intraday reversal approaches. It not only captures profits during trending markets but also enables timely profit-taking and counter-trend trading during market reversals. This strategy has been ranked among the top ten most profitable trading strategies by the American magazine   Futures Truth   for 15 consecutive years. It boasts a long lifecycle and remains widely used and st
Fibonacci Auto
Makarii Gubaydullin
Traccia automaticamente i livelli di Fibonacci, basati sui prezzi Massimo e Minimo del timeframe specificato Più barre   possono essere unite: ad esempio, puoi ottenere un Fibonacci basato sui Massimi e Minimi di 10 giorni Il mio   #1   Strumento : 66+ funzionalità, incluso questo indicatore  |   Contattami  per qualsiasi domanda  |    Versione MT4 Aiuta a identificare potenziali livelli di inversione; I pattern formati ai livelli di Fibonacci tendono a essere più forti; Riduce   notevolmente  
Free automatic Fibonacci is an indicator that automatically plots a Fibonacci retracement based on the number of bars you select on the BarsToScan setting in the indicator. The Fibonacci is automatically updated in real time as new highest and lowest values appears amongst the selected bars. You can select which level values to be displayed in the indicator settings. You can also select the color of the levels thus enabling the trader to be able to attach the indicator several times with differe
FREE
MACD Sniper Pro
Noppawat Tumjai
MACD Sniper Pro is an advanced automated trading system designed for traders seeking high-precision entries and robust risk management. By combining the classic momentum of MACD Crossover with a strict ADX Volatility Filter and Dynamic ATR Management , this EA completely eliminates emotional trading and filters out dangerous flat/sideways markets. Unlike standard MACD indicators that suffer during consolidation, MACD Sniper Pro verifies trend strength before entering and protects your capital us
Somewhere over the rainbow It is a system that tries to operate the market from the exhaustion of the trend with a correction algorithm that tries to cut losses at the cost of increasing the margin This system makes all the adjustments automatically, analyzing the pair and the market to decide which is the most efficient step to reach your destination. Somewhere over the rainbow is a multiple trade and multi lot system(The maximum batch can be up to 5 times the initial batch distributed in mult
Apex Fibo Tracer — Smart Auto-Fibonacci Tool Apex Fibo Tracer is a professional analytical indicator that automates one of the most powerful methods in technical analysis — Fibonacci retracement levels. By combining a high-precision ZigZag algorithm with dynamic Fibonacci plotting, the tool delivers instant and accurate visualization of market structure directly on your chart. Most traders lose valuable seconds manually adjusting Fibonacci grids during high volatility. Apex Fibo Tracer eliminate
Caicai L&S Yield Histogram Important Notice: This indicator is an integral tool of the automated EA Caicai Long and Short Pair Trading . This indicator visually displays the percentage deviation (Yield %) of a pair's current spread relative to its own historical mean. It is an excellent tool for quickly visualizing the gross financial potential of a market distortion in Long & Short operations. Main Features: Percentage Visualization: Understand the size of the distortion in palpable percentage
Heiken_Ashi_Bars - Visualizzatore di Tendenze Avanzato per MT5 Panoramica Heiken_Ashi_Bars è un indicatore personalizzato potente e visivamente intuitivo progettato per filtrare il rumore del mercato ed evidenziare la vera tendenza di fondo. I grafici a candele tradizionali possono spesso essere erratici. Calcolando la media dei dati sui prezzi, questo indicatore uniforma l'azione dei prezzi, rendendo molto più semplice individuare continuazioni di tendenze, inversioni e zone di ingresso redditi
Il livello Premium è un indicatore unico con una precisione superiore all'80% delle previsioni corrette! Questo indicatore è stato testato dai migliori Specialisti di Trading per più di due mesi! L'indicatore dell'autore che non troverai da nessun'altra parte! Dagli screenshot puoi vedere di persona la precisione di questo strumento! 1 è ottimo per il trading di opzioni binarie con un tempo di scadenza di 1 candela. 2 funziona su tutte le coppie di valute, azioni, materie prime, criptovalu
Auto Fib Retracements
Ross Adam Langlands Nelson
4.2 (5)
Automatic Fibonacci Retracement Line Indicator. This indicator takes the current trend and if possible draws Fibonacci retracement lines from the swing until the current price. The Fibonacci levels used are: 0%, 23.6%, 38.2%, 50%, 61.8%, 76.4%, 100%. This indicator works for all charts over all timeframes. The Fibonacci levels are also recorded in buffers for use by other trading bots. Any comments, concerns or additional feature requirements are welcome and will be addressed promptly. 
FREE
FibRetrace Zones Zone di ritracciamento di Fibonacci dell'ultimo swing FibRetrace Zones è il complemento visivo gratuito dell'Expert Advisor FibRetrace. Disegna i livelli di ritracciamento di Fibonacci ed evidenzia la zona di pullback dell'ultimo swing, così vedete dove si allineano gli ingressi prima di operare. La zona è colorata in base alla direzione: verde per i setup rialzisti, rosso per quelli ribassisti. Funziona su qualsiasi simbolo e qualsiasi timeframe. CARATTERISTICHE PRINCIPALI Rile
FREE
AUTO FIBONACCI MULTI-TIMEFRAME TOOLKIT Technical analysis tool that automatically draws Fibonacci levels for 4H, Daily, Weekly, and Monthly sessions. AUTOMATIC FIBONACCI RETRACEMENTS (7 CLASSIC LEVELS): - 0.0% (Previous session Low - support level) - 23.6% (Fibonacci Golden Ratio - early entry level) - 38.2% (Strong retracement level) - 50.0% (Key pivot level highlighted in YELLOW - market equilibrium) - 61.8% (Main Golden Ratio - critical decision level) - 78.6% (Deep retracement level) - 100.0

Fabii Half Trend Baseline
Fabien Georges Andre Guillemaud
Smetti di operare contro il trend del timeframe superiore. Due baseline, un grafico. Senza repaint. Qualsiasi coppia, qualsiasi timeframe. Sul tuo grafico in 2 minuti. Demo gratuita nello Strategy Tester. Get more indicators here Baselines, volatility filters and oscillators. No repaint. Perché ti serve Entri in un trade perché una linea è diventata verde sul tuo grafico. Poi apri un timeframe superiore e vedi che il trend più grande punta nella direzione opposta. Il segnale era reale. Il tre
HAS RSI Signal — Indicatore di Tendenza Professionale con Calcolo SL/TP HAS RSI Signal è un potente strumento di trading che combina classici intramontabili con moderni algoritmi di filtraggio del rumore. L'indicatore analizza il mercato attraverso le candele Heiken Ashi Smoothed (HAS) e l'oscillatore RSI , fornendo al trader segnali di ingresso chiari durante le inversioni di tendenza o l'uscita dalle zone di ipercomprato/ipervenduto. Vantaggi Principali: Doppio Filtraggio: L'uso di Heiken Ashi
Your Trend Friend
Luigi Nunes Labigalini
5 (1)
The trend is your friend! Look at the color of the indicator and trade on that direction. It does not  repaint. After each candle is closed, that's the color of the trend. You can focus on shorter faster trends or major trends, just test what's most suitable for the symbol and timeframe you trade. Simply change the "Length" parameter and the indicator will automatically adapt. You can also change the color, thickness and style of the lines. Download and give it a try! There are big movements w
The Rainbow Dragon Indicator by Quant Atlas Creator:  https://www.quant-atlas.com/ The Rainbow Dragon is a composite signal engine that aggregates the seven Rainbow indicators — Blue, Green, Indigo, Red, Violet, Yellow, and Orange — into a single confluence-based reading. Rather than relying on any one model, it treats each Rainbow component as an independent voter and fires only when enough of them agree, giving you a diversified, multi-method read on the market instead of a single point of vie
Babel Assistant
Iurii Bazhanov
4.33 (9)
Babel assistant 1 Il robot di netting per MT5 "Babel_assistant_1" utilizza l'indicatore ZigZag per generare livelli di Fibonacci su vari timeframe (M1, M5, M15, H1, H4, D1 e W1) e calcola la forza delle tendenze di acquisto e vendita. Apre una posizione utilizzando l'impostazione "Lot for open a position" se viene superato il livello di tendenza specificato di 4,925. Dopodiché, Babel posiziona ordini pendenti su determinati livelli di Fibonacci e imposta le linee di Stop Loss e Take Profit speci
FREE
Индикатор "Benefit Predictor" Это высокоточный инструмент для прогнозирования разворота цены на любом финансовом инструменте и любом таймфрейме. Этот продукт появился благодаря годам опыта и исследований в области анализа цен и других временных рядов, используя продвинутые методы машинного обучения и математического анализа. Особенности продукта : Готовая торговая система, подходит как для ручной торговли, так и для использования в торговых роботах. Не перерисовывается после появления сигнала
Prezzo di benvenuto: 35 $ Il modello   Testa e Spalle   è ideale per i trader che cercano un riconoscimento affidabile dei modelli, includendo formazioni rialziste e ribassiste di Testa e Spalle, con livelli di Fibonacci integrati, rilevamento della rottura del neckline e tecniche di previsione anticipata. Uno strumento MT5 potente per chi apprezza l'analisi tecnica e la precisione nell'identificare strutture grafiche e inversioni di tendenza. Metodi di Rilevamento Doppio Metodo 1 - Rilevamento
Tma Poc Gold
Ignacio Agustin Mene Franco
POC + TMA SCALPER GOLD - Expert Advisor Professional DESCRIPTION: Automated trading system designed specifically for XAU/USD, combining Point of Control (POC) with Triangular Moving Average (TMA) to identify high-volume and trending zones. It uses advanced risk management with dynamic trailing stops and an intelligent grid system. TECHNICA
Noize Absorption Index - is the manual trading system that measures the difference of pressure between bears forces and bulls forces. Green line - is a noize free index that showing curent situation. Zero value of index shows totally choppy/flat market.Values above zero level shows how powerfull bullish wave is and values below zero measures bearish forces.Up arrow appears on bearish market when it's ready to reverse, dn arrow appears on weak bullish market, as a result of reverse expectation.
Mine Farm
Maryna Kauzova
Mine Farm is one of the most classic and time-tested scalping strategies based on the breakdown of strong price levels. Mine Farm is the author's modification of the system for determining entry and exit points into the market... Mine Farm - is the combination of great potential with reliability and safety. Why Mine Farm?! - each order has a short dynamic Stop Loss - the advisor does not use any risky methods (averaging, martingale, grid, locking, etc.) - the advisor tries to get the most
TITAN TREND ARCHITECT — The Ultimate Strategy Builder EA "Don't just buy an EA. Buy the Blueprint. Build Your Own Edge." > Inspired by the market's leading Strategy Builder EAs, but forged with TumWebTH's unmatched Aegis Shield technology. Are you tired of buying black-box Expert Advisors where you have no control over the entry logic? Titan Trend Architect- changes the game. It is a No-Code Strategy Builder- that allows you to Mix & Match Entry Triggers, Trend Filters, and Exit Logic direct
CyberTradeTHxAI Gold Sniper MT5 Professional Gold Trading Signal Indicator for MetaTrader 5 CyberTradeTHxAI Gold Sniper MT5 is a professional-grade Gold (XAUUSD) trading indicator developed to identify high-probability Buy and Sell opportunities using trend analysis, pullback confirmation, and intelligent market structure detection. Designed for both beginner and advanced traders, the indicator automatically calculates optimal Entry Zones, Stop Loss, and multiple Take Profit levels while provid
Gli utenti di questo prodotto hanno anche acquistato
Trend Sniper X
Sarvarbek Abduvoxobov
4.86 (43)
Trend Sniper X è un indicatore trend-following multi-timeframe per MetaTrader 5 che aiuta i trader a identificare la direzione del trend e i potenziali punti di inversione con chiarezza e precisione. per MT4: https://www.mql5.com/en/market/product/193245 Informazioni sul prezzo: Il prezzo attuale è promozionale ed è soggetto a modifiche con il rilascio di futuri aggiornamenti e nuove funzionalità. Offerta Bonus: Per ricevere GRATIS l'Auto-Trade Assistant EA per questo indicatore, invia un messa
Un nuovo Re in città - Indicatore + Gestione ordini (TP1 + TP2 + TP3) + Invio opzionale di segnali Telegram INCLUSO (GRATIS) (SISTEMA COMPLETO DI TRADING e SEGNALI) Il nostro miglior EA per l’Oro: Gold Slayer Questo indicatore include una strategia avanzata, un sistema di trading con gestione ordini personalizzabile e un sistema mean reversion che combina estensioni di envelope, supportato da molteplici filtri intelligenti di conferma come RSI per individuare ingressi di inversione ad alta proba
Smart Trend Trading System — MetaTrader 5 Dopo l'acquisto, inviami un messaggio su MQL5 per ricevere GRATUITAMENTE Smart Universal Expert Advisor, insieme al corso online, al manuale PDF e all'accesso al gruppo privato. STTS riunisce la direzione del trend, i segnali di entrata e uscita, le zone di inversione e i livelli di prezzo importanti direttamente sul grafico. Segui il sistema manualmente oppure collega un EA compatibile separato per eseguire le operazioni automaticamente con le impostazi
Zoryk Gold
Reda El Koutbane
4.76 (17)
ZORYK — Sistema avanzato di segnali XAUUSD per MetaTrader 5 Conosci sicuramente questa sensazione. Passi molto tempo ad analizzare l’oro. Aspetti il punto d’ingresso corretto. Finalmente apri l’operazione e il prezzo inizia immediatamente a muoversi contro di te. Chiudi troppo presto, sposti lo Stop Loss o esiti per alcuni secondi. Successivamente il mercato raggiunge esattamente l’obiettivo che avevi previsto inizialmente, ma senza di te nella posizione. Il problema non era sempre la direzione.
M5 Sniper
MeanFX
5 (3)
Porta il tuo vantaggio nel trading sotto i riflettori! M5 Sniper è un nuovo indicatore di MeanFX. Combina segnali di trading precisi con livelli TP/SL adattivi , creando così le migliori operazioni statistiche possibili! Il prezzo aumenta ogni 5 acquisti, il prossimo prezzo è di 69$ Scrivimi dopo l'acquisto per ricevere consigli/guida e un EA bonus Cosa lo rende diverso? Performance statistica comprovata su Gold XAUUSD ( funziona su quasi ogni asset , concentrandosi sulla padronanza di un singol
SuperScalp Pro
Van Minh Nguyen
4.54 (37)
SuperScalp Pro - Professional Multi-Layer Confluence Scalping System SuperScalp Pro è un indicatore di scalping avanzato che potenzia il Supertrend classico con diversi filtri intelligenti di conferma. Aiuta a individuare opportunità di trading Buy/Sell con una maggiore probabilità di successo, riducendo significativamente i falsi segnali. Le frecce Buy e Sell vengono visualizzate chiaramente direttamente sul grafico, insieme ai livelli di Stop Loss e Take Profit basati sull’ATR, calcolati autom
SMC Intraday Formula
VividMind Digital Solutions
5 (26)
Cominciamo con la verità. Nessun indicatore da solo ti renderà profittevole. Se qualcuno ti dice il contrario, ti sta vendendo un sogno. Qualsiasi indicatore che mostra frecce perfette di acquisto/vendita può essere reso impeccabile — basta ingrandire la giusta sezione della storia e catturare solo i trade vincenti. Noi non lo facciamo.  SMC Intraday Formula è uno strumento. Legge la struttura del mercato per te, identifica le zone a più alta probabilità e ti mostra esattamente come appare la t
La leggenda ritorna: Entry Points Pro 10. Il rilancio del leggendario indicatore che per 3 anni è rimasto nella Top-3 del MQL5 Market. Oltre 600 recensioni su due versioni, migliaia di trader lo usano ogni giorno per operare, oltre 28.000 download della demo   MT4+MT5 . Ho letto ogni vostra recensione degli ultimi cinque anni — e invece di promesse ho inserito nella versione 10 le risposte. Dall'autore che opera sui mercati dal 1999 e tiene all'onestà, alla propria reputazione e ai propri client
GoldenX Entry MT5
VividMind Digital Solutions
5 (17)
GoldenX Entry è un indicatore per MT5 con un algoritmo adattivo Smart Entry Trend, un sistema di scoring dei segnali, un rilevatore del regime di mercato e un filtro di volatilità. Ogni segnale include un livello di ingresso calcolato, tre livelli di Take-Profit (TP1, TP2, TP3) e un livello di Stop-Loss. È costruito su più livelli analitici progettati per adattarsi a diverse condizioni di mercato, combinando un sistema analitico multilivello con un ottimizzatore integrato e un sistema di traccia
Auto Optimized SpeedAngle è un sistema di vettorizzazione del momento di livello istituzionale che elimina l'overfitting ( curve-fitting ) attraverso l'ottimizzazione continua Walk-Forward (WFO). Invece di affidarsi a input statici che si degradano quando i regimi di mercato cambiano, l'indicatore recalibra dinamicamente i suoi parametri utilizzando la validazione Out-of-Sample (OOS), assicurando che i segnali visualizzati rappresentino reali vantaggi statistici anziché anomalie storiche. Quadro
ARIPoint
Temirlan Kdyrkhan
1 (4)
ARIPoint is a powerful trading companion designed to generate high-probability entry signals with dynamic TP/SL/DP levels based on volatility. Built-in performance tracking shows win/loss stats, PP1/PP2 hits, and success rates all updated live. Key Features: Buy/Sell signals with adaptive volatility bands Real-time TP/SL/DP levels based on ATR Built-in MA Filter with optional ATR/StdDev volatility Performance stats panel (Success, Profit/Loss, PP1/PP2) Alerts via popup, sound, push, or email Cu
Gann Made Easy è un sistema di trading Forex professionale e facile da usare che si basa sui migliori principi del trading utilizzando la teoria di mr. WD Gann. L'indicatore fornisce segnali ACQUISTA e VENDI accurati, inclusi i livelli di Stop Loss e Take Profit. Puoi fare trading anche in movimento utilizzando le notifiche PUSH. CONTATTAMI DOPO L'ACQUISTO PER RICEVERE GRATUITAMENTE LE ISTRUZIONI DI TRADING E OTTIMI INDICATORI EXTRA! Probabilmente hai già sentito parlare molte volte dei metodi d
M1 Sniper MT5
Oleg Rodin
5 (7)
M1 SNIPER   è un sistema di indicatori di trading facile da usare. Si tratta di un indicatore a freccia progettato per l'intervallo temporale M1. L'indicatore può essere utilizzato come sistema autonomo per lo scalping sull'intervallo temporale M1 e come parte del tuo sistema di trading esistente. Sebbene questo sistema di trading sia stato progettato specificamente per il trading sull'intervallo temporale M1, può comunque essere utilizzato anche con altri intervalli temporali. Inizialmente ho p
Adaptive Price Action Engine Acquista un indicatore, ricevi l'EA gratis Analisi Auto-Ottimizzata del Trend e dei Pattern Candlestick Multi-Timeframe I mercati cambiano continuamente e non tutti i pattern di Price Action hanno lo stesso valore in ogni condizione di mercato. Adaptive Price Action Engine è progettato per adattarsi alle condizioni di mercato in continua evoluzione, combinando struttura del trend, analisi Multi-Timeframe, pattern Candlestick e ottimizzazione statistica in un unico fr
Power Candles MT5
Daniel Stein
4.58 (12)
Power Candles V3 - Indicatore di forza ad ottimizzazione automatica Power Candles V3 trasforma la forza delle valute e degli strumenti in un piano di trading attuabile su ogni grafico a cui è collegato. Invece di limitarsi a colorare le candele, esegue un'auto-ottimizzazione in tempo reale in background e ti fornisce i migliori valori di Stop Loss, Take Profit e soglia di segnale per il simbolo che hai davanti. Basta un clic per adottarlo nel trading live: i raggi di ingresso, Stop Loss e Take P
Prossimo aggiornamento — Versione 2.52 in arrivo! [NOVITÀ] Preparati a 4 nuove funzionalità principali progettate per migliorare la tua analisi di mercato e il tuo flusso di lavoro nel trading Portiamo l’analisi di mercato a un livello superiore con 4 nuove funzionalità progettate per soddisfare le tue esigenze di trading. Ecco le novità: 1. TRADE OVERVIEW DASHBOARD 2. CONFLUENCE AT ZONE 3. STRONG & WEAK HIGH/LOW 4. OTE 1. TRADE OVERVIEW DASHBOARD Una dashboard che ti aiuta a comprendere più fa
Boba Analysis Suite
Trade Ready Solutions LLC
5 (2)
Boba Analysis Suite Boba Analysis Suite è un indicatore di analisi per MetaTrader 5. Riunisce la struttura del mercato, le zone di prezzo rilevanti e il contesto generale del mercato in un’unica visualizzazione del grafico. Sviluppato sulla base dell’esperienza pratica come trader e formatore di trading, supporta un processo di analisi strutturato: valutare la direzione del mercato, individuare livelli importanti e analizzare congiuntamente più intervalli temporali. Analisi nel contesto del merc
Gold Entry Sniper
Tahir Mehmood
5 (21)
Gold Entry Sniper – Dashboard ATR Multi-Timeframe per Scalping e Swing Trading sull’Oro Gold Entry Sniper è un indicatore avanzato per MetaTrader 5 che offre segnali di acquisto/vendita precisi per XAUUSD e altri strumenti, basato sulla logica ATR Trailing Stop e l' analisi multi-timeframe . Caratteristiche e Vantaggi Analisi Multi-Timeframe – Visualizza trend su M1, M5, M15 in un'unica dashboard. Trailing Stop Basato su ATR – Stop dinamici che si adattano alla volatilità. Dashboard Professional
FiboSniper Pro
Van Minh Nguyen
5 (4)
FiboSniper Pro – Multi-Filter Fibonacci System with Auto SL/TP and Control Panel FiboSniper Pro è un indicatore tecnico che combina Fibonacci Envelopes dinamici con diversi filtri di conferma per generare segnali Buy e Sell selezionati. I livelli di Fibonacci vengono calcolati sulla base di Moving Average e ATR e successivamente filtrati tramite ADX, EMA, RSI, ATR, Volume, Time e struttura delle candele. L’indicatore visualizza direttamente sul grafico i livelli automatici di Stop Loss e Take Pr
Tokyo mt5 Indicator
Vasiliy Strukov
5 (12)
Il Tokyo Indicator offre una chiara panoramica visiva della direzione del trend, dei potenziali segnali di trading e delle condizioni di mercato. La sua linea di trend a gradini, codificata a colori, distingue le fasi rialziste (in blu) da quelle ribassiste (in magenta). Frecce direzionali dedicate evidenziano potenziali opportunità di acquisto e vendita al variare del trend visualizzato. Una dashboard integrata riunisce in un'unica visualizzazione pratica il segnale corrente, il bias di mercato
Trend Catcher ind mt5
Ramil Minniakhmetov
5 (18)
INDICATORE TREND CATCHER L'indicatore Trend Catcher analizza i movimenti dei prezzi di mercato, utilizzando una combinazione di indicatori di analisi del trend proprietari dell'autore e personalizzati. Identifica la vera direzione del mercato filtrando il rumore a breve termine e concentrandosi sulla forza del momentum sottostante, sull'espansione della volatilità e sul comportamento della struttura dei prezzi. Utilizza inoltre una combinazione di indicatori personalizzati di smoothing e filtr
Gold Trend Coach MT5
Cristhian Alexander Gaibor Cuasquer
5 (2)
Gold Trend Coach è un indicatore di trend per l'oro (XAUUSD) su MetaTrader 5 con segnali di acquisto e vendita, stop loss e tre obiettivi di take profit, confermati alla chiusura della candela, una dashboard coach multi-timeframe e avvisi sul tuo telefono e su Telegram. Costruito per lo scalping su M5 e l'intraday su M15 durante le sessioni di Londra e New York. Gold Trend Coach: segnali di trend sull'oro XAUUSD con ingresso, stop e tre obiettivi. Prezzo di lancio $39 per le prime 20 copie, poi
Quantum TrendPulse
Bogdan Ion Puscasu
5 (26)
Ecco   Quantum TrendPulse   , lo strumento di trading definitivo che combina la potenza di   SuperTrend   ,   RSI   e   Stocastico   in un unico indicatore completo per massimizzare il tuo potenziale di trading. Progettato per i trader che cercano precisione ed efficienza, questo indicatore ti aiuta a identificare con sicurezza le tendenze di mercato, i cambiamenti di momentum e i punti di entrata e uscita ottimali. Caratteristiche principali: Integrazione SuperTrend:   segui facilmente l'andame
Neuro Poseidon MT5
Daria Rezueva
4.75 (52)
Neuro Poseidon is a new indicator by Daria Rezueva. It combines precise trading signals with adaptive TP/SL levels - creating best possible trades as a result! Message me and get  Neuro Poseidon Assistant  as a gift to automize your trading process! What makes it stand out? 1. Proven profitability on all assets and timeframes 2. Only confirmed BUY and SELL signals present on the chart 3. Adaptive TP & SL levels generated by the software for each trade 4. Easy to understand - suitable for al
Azimuth Pro
Ottaviano De Cicco
5 (7)
Azimuth Pro V2: Synthetic Fractal Structure and Confirmed Entries for MT5 Overview Azimuth Pro is a multi-level swing structure indicator by Merkava Labs . Four nested swing layers, swing-anchored VWAP, ABC pattern detection, three-timeframe structural filtering, and closed-bar confirmed entries — one chart, one workflow from micro-swings to macro-cycles. This is not a blind signal product. It is a structure-first workflow for traders who care about location, context, and timing. Halloween P
Presentazione       Quantum Breakout PRO   , l'innovativo indicatore MQL5 che sta trasformando il modo in cui scambi le zone di breakout! Sviluppato da un team di trader esperti con un'esperienza di trading di oltre 13 anni,       Quantum Breakout PRO       è progettato per spingere il tuo viaggio di trading a nuovi livelli con la sua strategia innovativa e dinamica della zona di breakout. Quantum Breakout Indicator ti fornirà frecce di segnalazione sulle zone di breakout con 5 zone target di
Indicatore multi-valuta di forza e momentum MT5 Dynamic Forex28 Navigator è l'evoluzione dei nostri indicatori popolari da lungo tempo e unisce la potenza di tre strumenti in uno: Advanced Currency Strength28 Indicator (700 recensioni) Advanced Currency IMPULSE with ALERT (530 recensioni) CS28 Combo Signals (bonus attuale) I due indicatori precedenti hanno insieme più di 1.200 recensioni sul MQL5 Market e sono un punto di riferimento nella comunità MT4 dal 2016. Dynamic Forex28 Navigator MT5 por
Scalper Vault è un sistema di trading potente e completo, progettato per i trader che desiderano ottenere risultati costanti nel trading intraday. Questo indicatore ad alta precisione funge da sistema di trading autonomo, offrendo analisi di livello istituzionale sia per il mercato Forex che per le Opzioni Binarie. CONTATTAMI DOPO L'ACQUISTO PER RICEVERE I MIEI CONSIGLI DI TRADING E UN FANTASTICO BONUS! Eliminando le congetture e le complesse analisi manuali, Scalper Vault ti permette di concen
Volatility Master for MetaTrader is a real-time dashboard tool that scans up to  50 symbols  to identify high-volatility , trending markets instantly. With bullish/bearish signals, customizable alerts, and a user-friendly interface, it helps you avoid range-bound conditions and focus on high-probability trades. Clarity leads to confidence. Trade confidently and protect your capital effectively with this powerful dashboard. We don't offer free or bonus indicators in exchange of reviews from you.
SR Liquidity   è un indicatore di trading progettato per individuare le zone nascoste in cui si concentra la liquidità di mercato e dove il prezzo reagisce con maggiore intensità. Queste aree di liquidità agiscono come potenti livelli di supporto e resistenza, offrendo una mappa chiara dei punti in cui è più probabile che il mercato inverta la propria direzione. Invece di tracciare le classiche linee di supporto e resistenza, SR Liquidity analizza l'effettivo comportamento dei prezzi per individ
Altri dall’autore
Swing Size Ruler colours every swing on the chart by its size and measures the swing you are in now against all past swings on this symbol and timeframe: "this up swing is longer than 82% of past up swings". On gold H1, a typical up swing covered 10,309 points in 16 bars, and 1 swing in 10 covered 23,327 points or more. Closed bars only, so it never repaints. Every number is verified against a separate implementation before each release. What it does Each finished swing is drawn on the price cha
FREE
How far is price below its high, and how long has it been there? Drawdown Map shows it on any chart: the drawdown now, the bars below the peak, the rise needed to get back, the maximum drawdown and the maximum time below a peak on this chart, and how often past drawdowns this deep got back to their peak within a set number of bars. Closed bars only, so it never repaints. Every number is verified against a separate implementation before each release. What it does Drawdown Map draws the drawdown i
FREE
What kind of day is it: a trend day, a range day, a reversal, an inside or an outside day? Day Type Map names every day on your chart, shows what today is so far, and how this symbol's past days were split between the six types. On gold over the last 250 days, 32% were range days, 17% trend-up days and 16% reversals. Free, clear, and checked against a separate implementation. What it does Each recent day is underlined and named in its own colour: trend up, trend down, range, reversal, inside or
FREE
A ruler that tells you whether a move is big. Drag it over any move and it shows the size in points and percent, the number of bars and the time it took, the value per lot, and how often past spans of the same number of bars on this symbol reached that far. On gold H1, a usual 5-bar span reached 4,782 points, and 1 span in 10 reached 10,089 points. Free, clear, and checked against a separate implementation. What it does A ruler line is placed over the recent move when you attach the indicator; d
FREE
How much room is left before a funded-account challenge's loss limit? Prop Floor Monitor shows it on the chart at a glance: the daily-loss floor, the maximum-loss floor, which one is closer, and the price at which this symbol's open position would reach it. The daily reset follows the time zone you choose, with its daylight saving: the reset moment was checked against the IANA time zone database at 18,688 moments from 2024 to 2027, including every clock change, with no difference. Every number i
FREE
How big is a normal Asia, London or New York session on this symbol, and how does today's compare? Session Ranges answers from the symbol's own history: the typical and big size of each session, today's size so far as a multiple of normal, and a box around every session of the last days, tinted quiet, normal or big. Free, clear, and checked against a separate implementation. What it does Session Ranges draws a box around each Asia, London and New York session on the recent days, from the session
FREE
A candle countdown that also tells you how big the current candle already is. On gold H1, the usual 16:00 candle was 3119 points and the usual 23:00 candle 645 points: the same timeframe, very different candles by hour. Candle Timer Pulse shows the time left in the current candle and compares its size so far with the usual candle of this timeframe at this hour, from the symbol's own history. Free, clear, and checked against a separate implementation. What it does Beside the forming candle, a cou
FREE
Is today's move normal or unusual for this market? Daily Range Stats answers it from the symbol's own history: how big a typical, a big and a very big day usually is, how today ranks against past days, and where today's high or low would sit if it became one of those days. Free, clear, and checked against a separate implementation. What it does A small table on the chart shows how big a typical day, a big day (1 in 5 days) and a very big day (1 in 20 days) is on this symbol over the past days yo
FREE
Big Move Map colours every big move on your chart and counts them: how often big moves come on this symbol, how many bars since the last one, the usual gap between them, big moves per month and the 10 record moves with their dates. Big moves come in clusters: on US500 D1, half of the big days came within 4 days of the one before, while the average gap was 19 days. The record day since 2012 was -10.62% on 12 March 2020. Closed bars only, so it never repaints. Every number is verified against a se
FREE
Filtro:
Nessuna recensione
Rispondi alla recensione