Drawdown Map
- Indicatori
-
Anna Makwana
 MetaTrader tools and indicators that measure the odds on your own chart: how often levels were reached, how far days and sessions usually run, and what followed past signals. Every figure comes from the symbol’s own price history and uses closed bars only, so nothing repaints. Questions are welcome
- Versione: 1.0
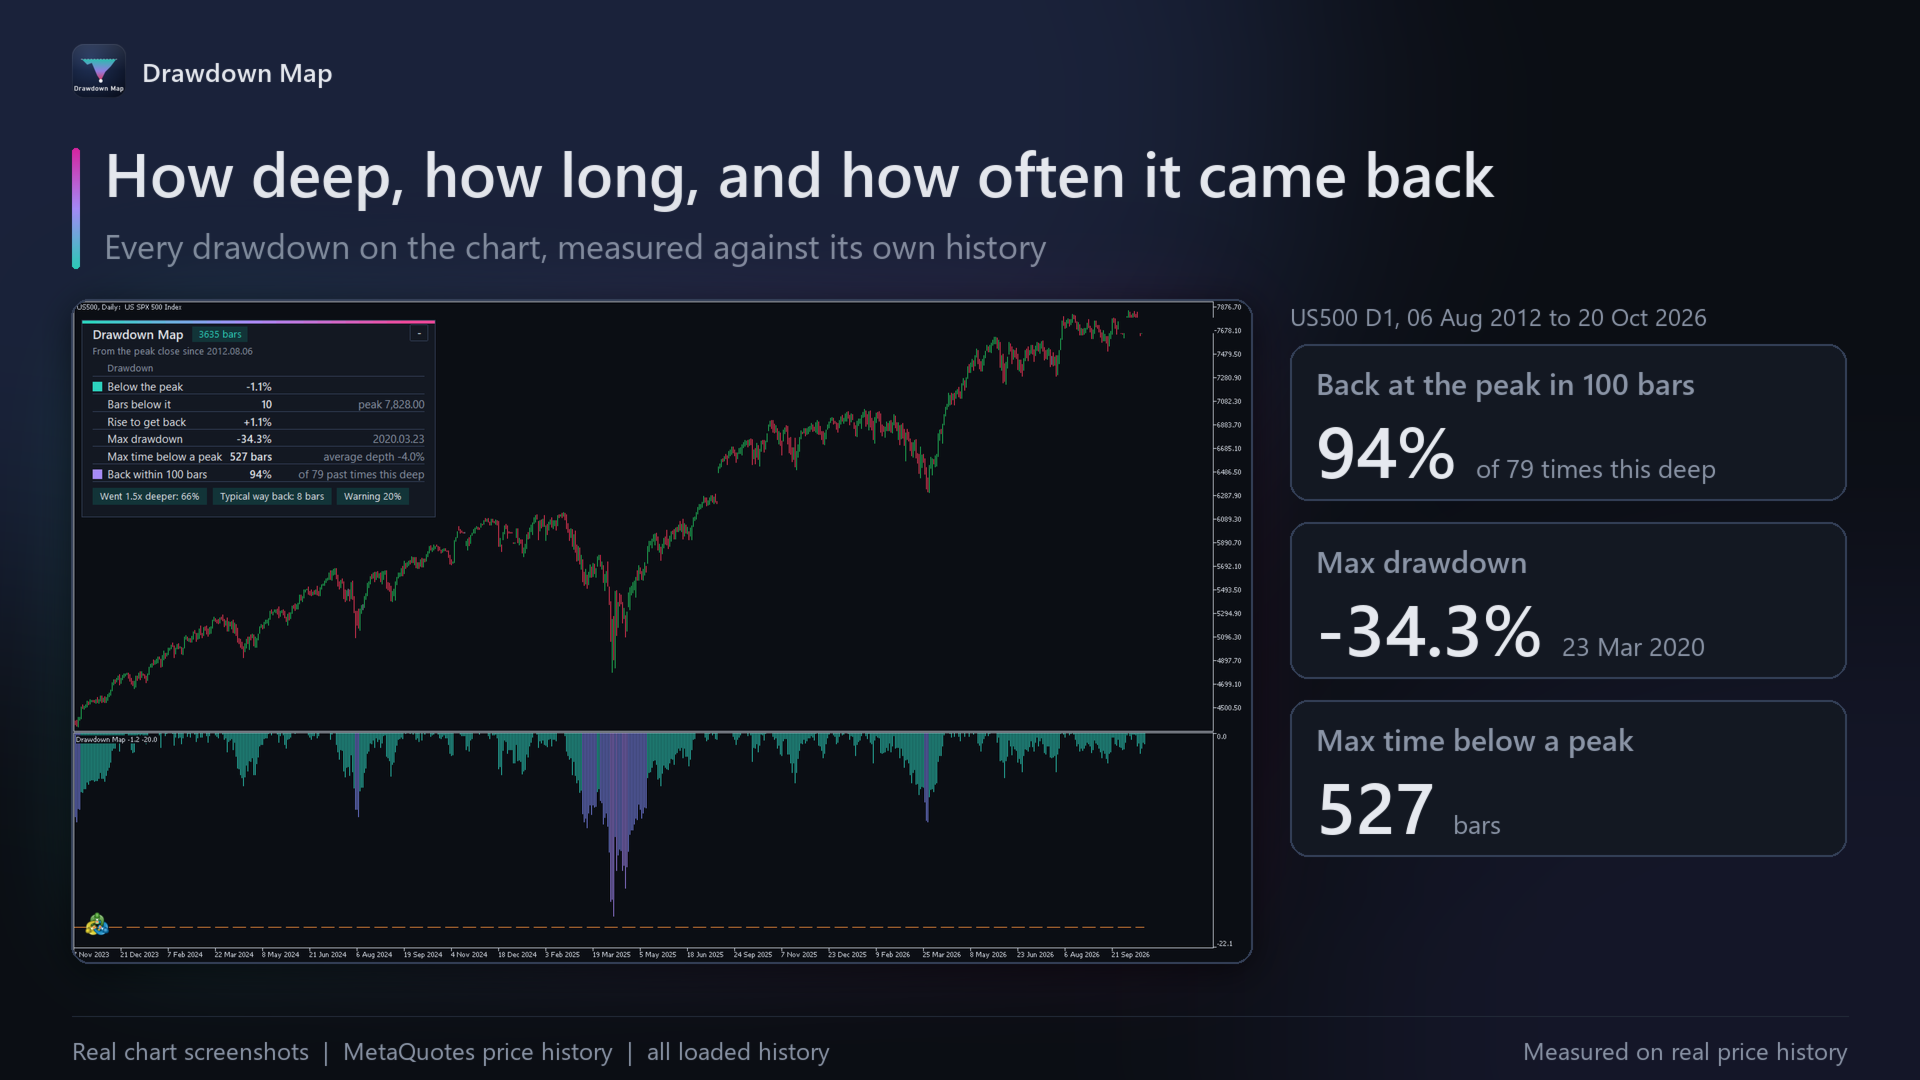
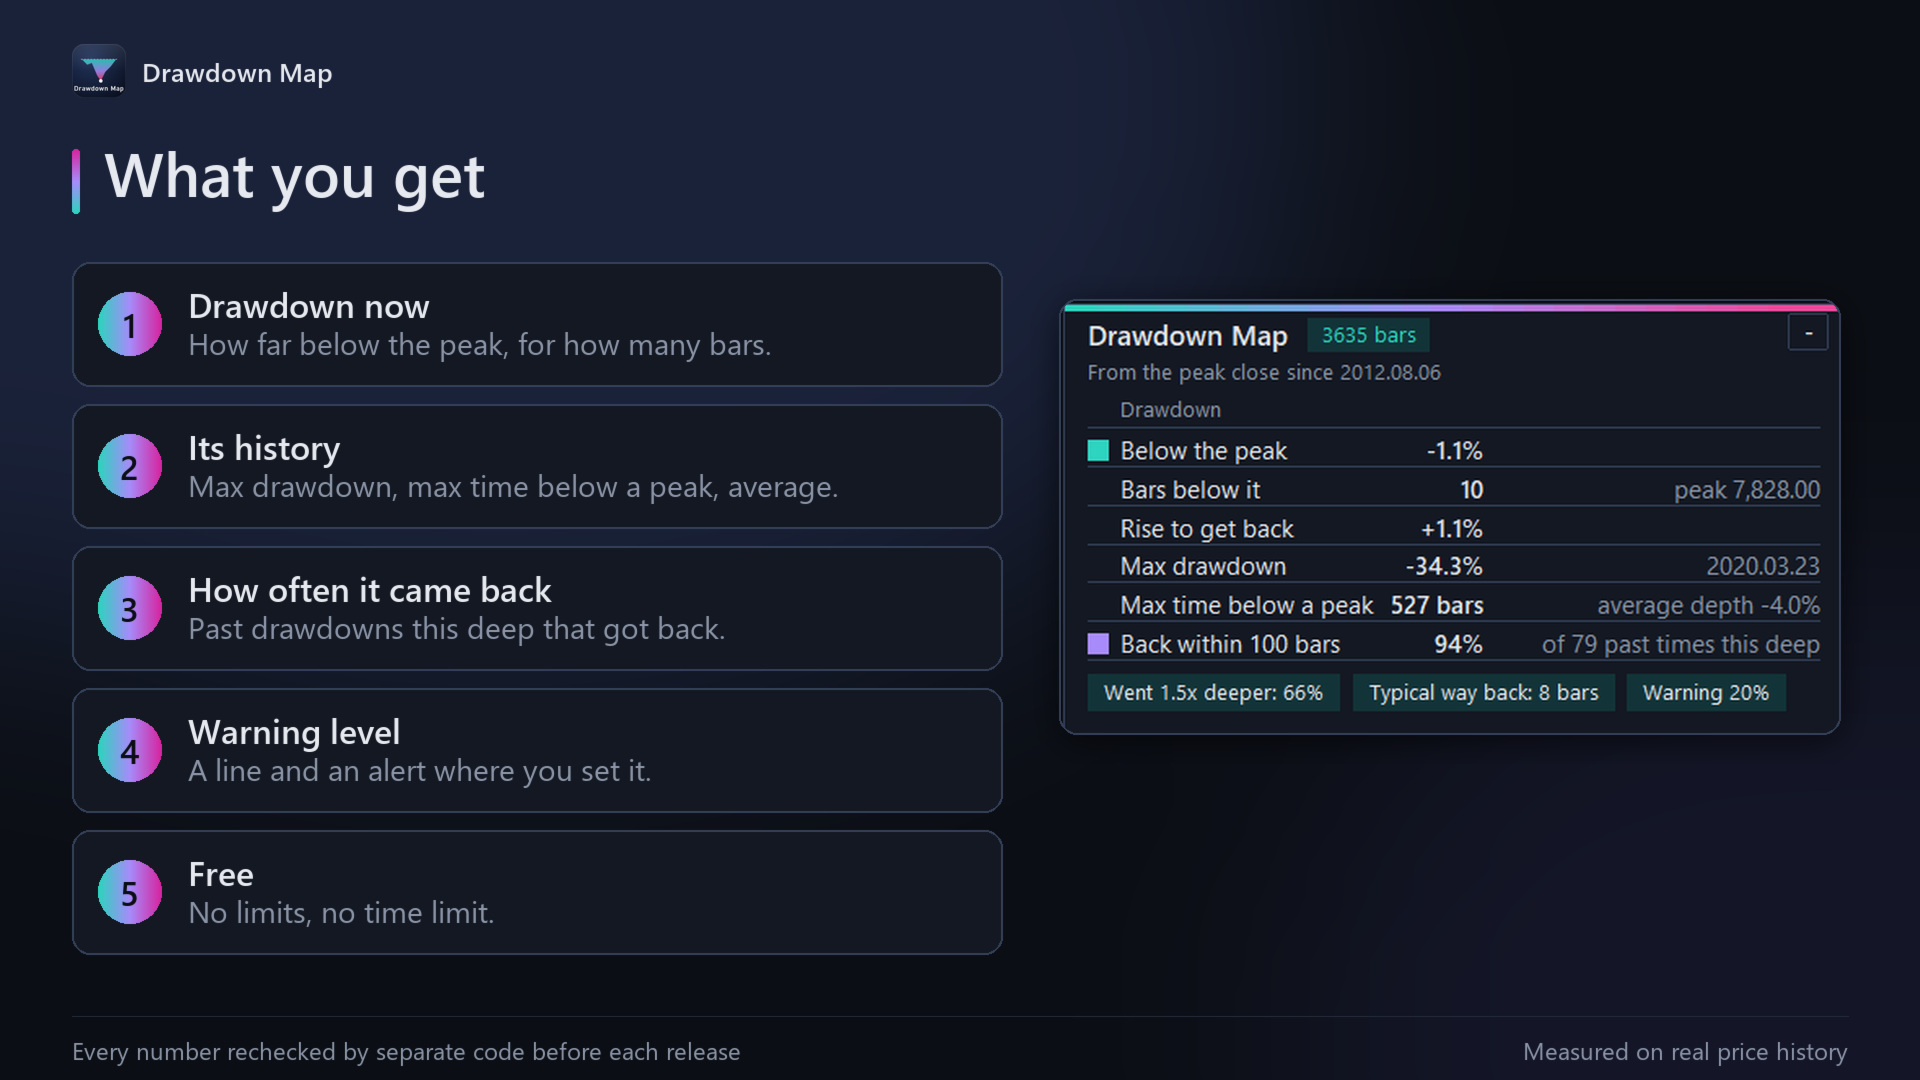
How far is price below its high, and how long has it been there? Drawdown Map shows it on any chart: the drawdown now, the bars below the peak, the rise needed to get back, the maximum drawdown and the maximum time below a peak on this chart, and how often past drawdowns this deep got back to their peak within a set number of bars. Closed bars only, so it never repaints. Every number is verified against a separate implementation before each release.
What it does
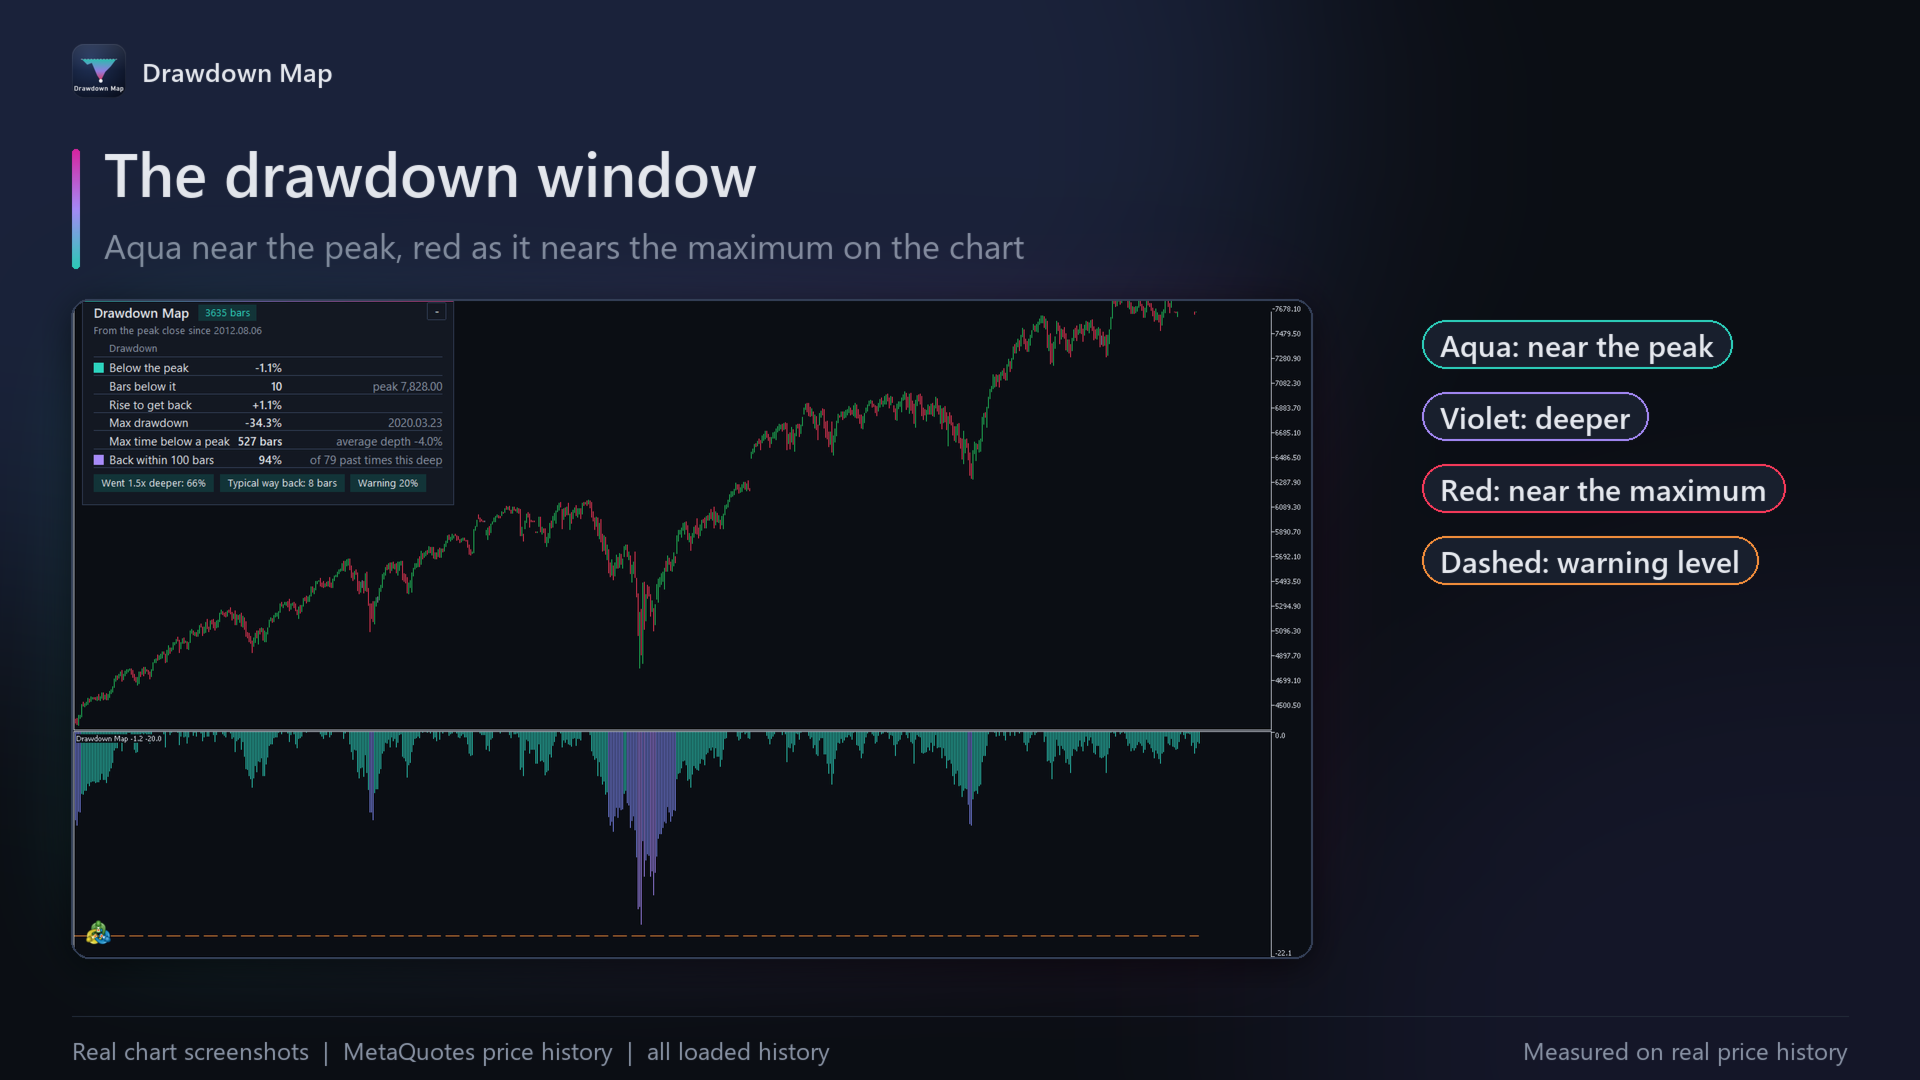
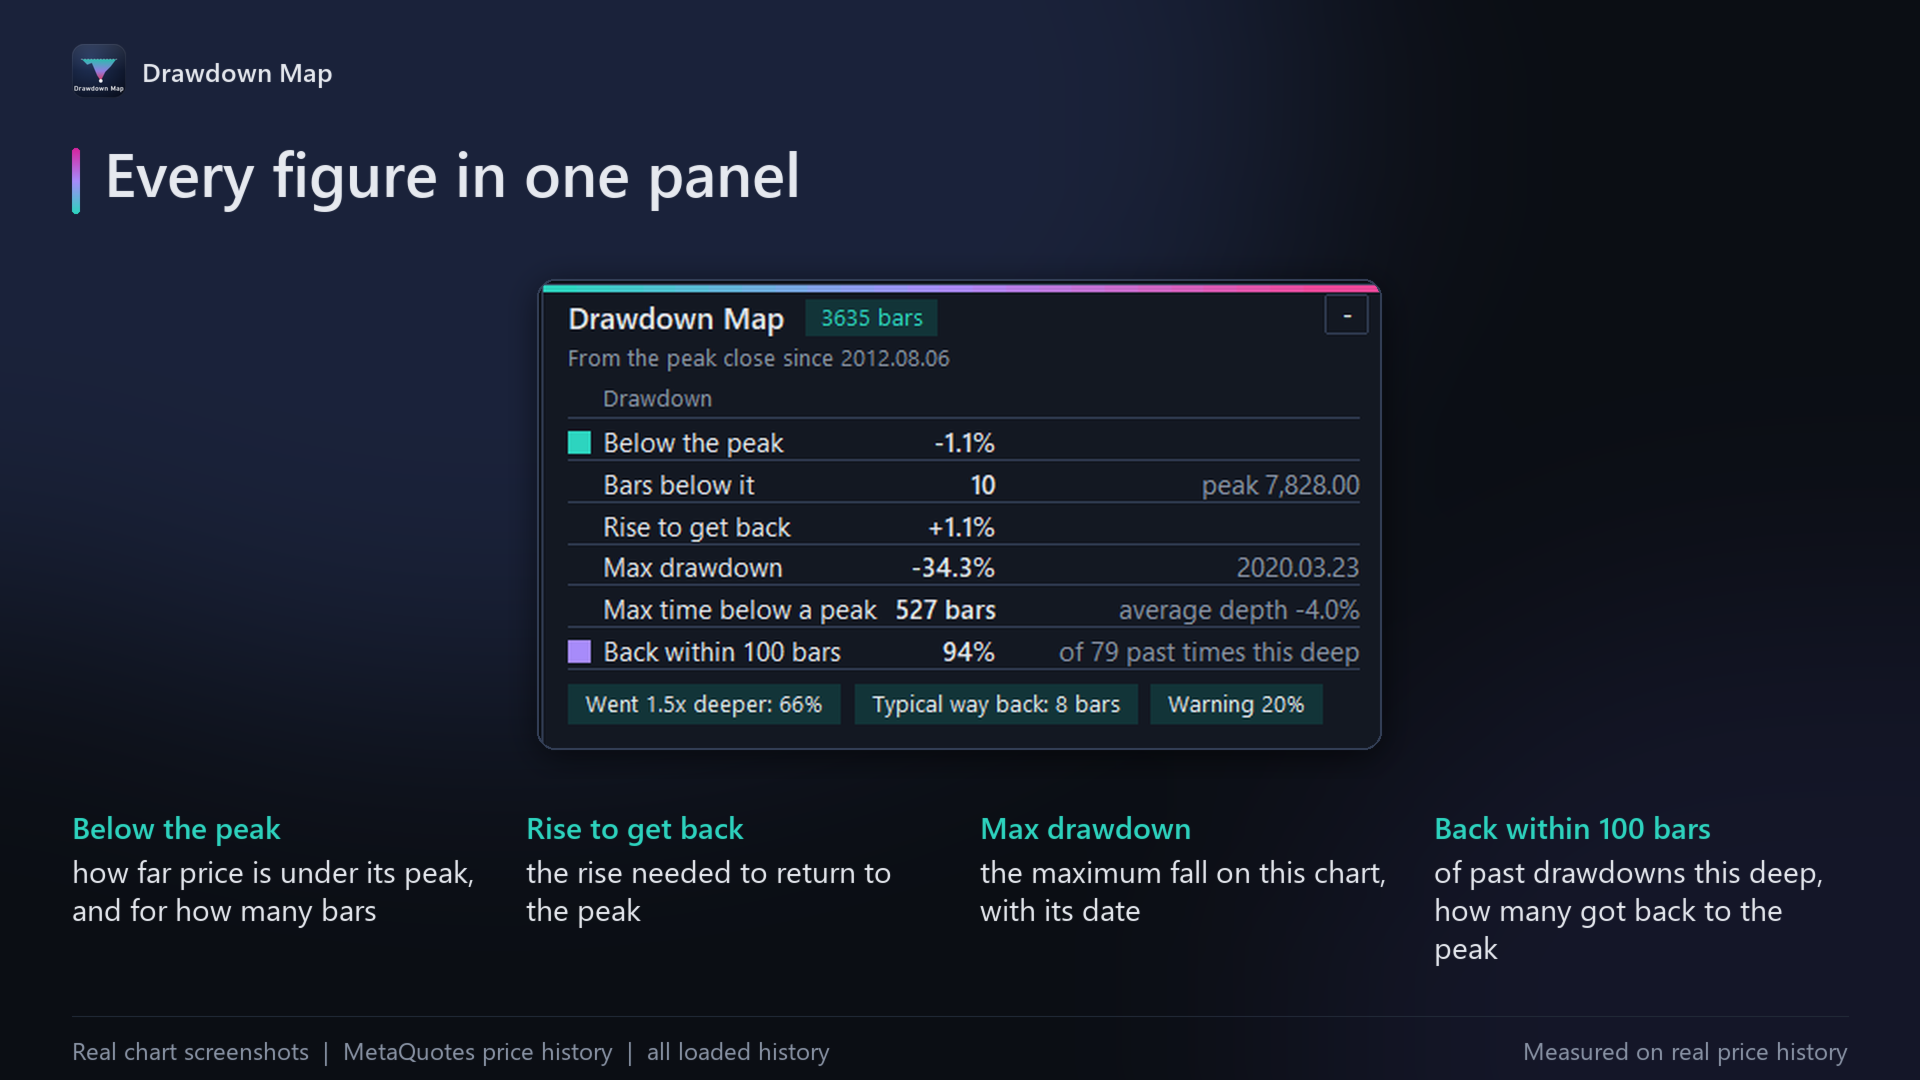
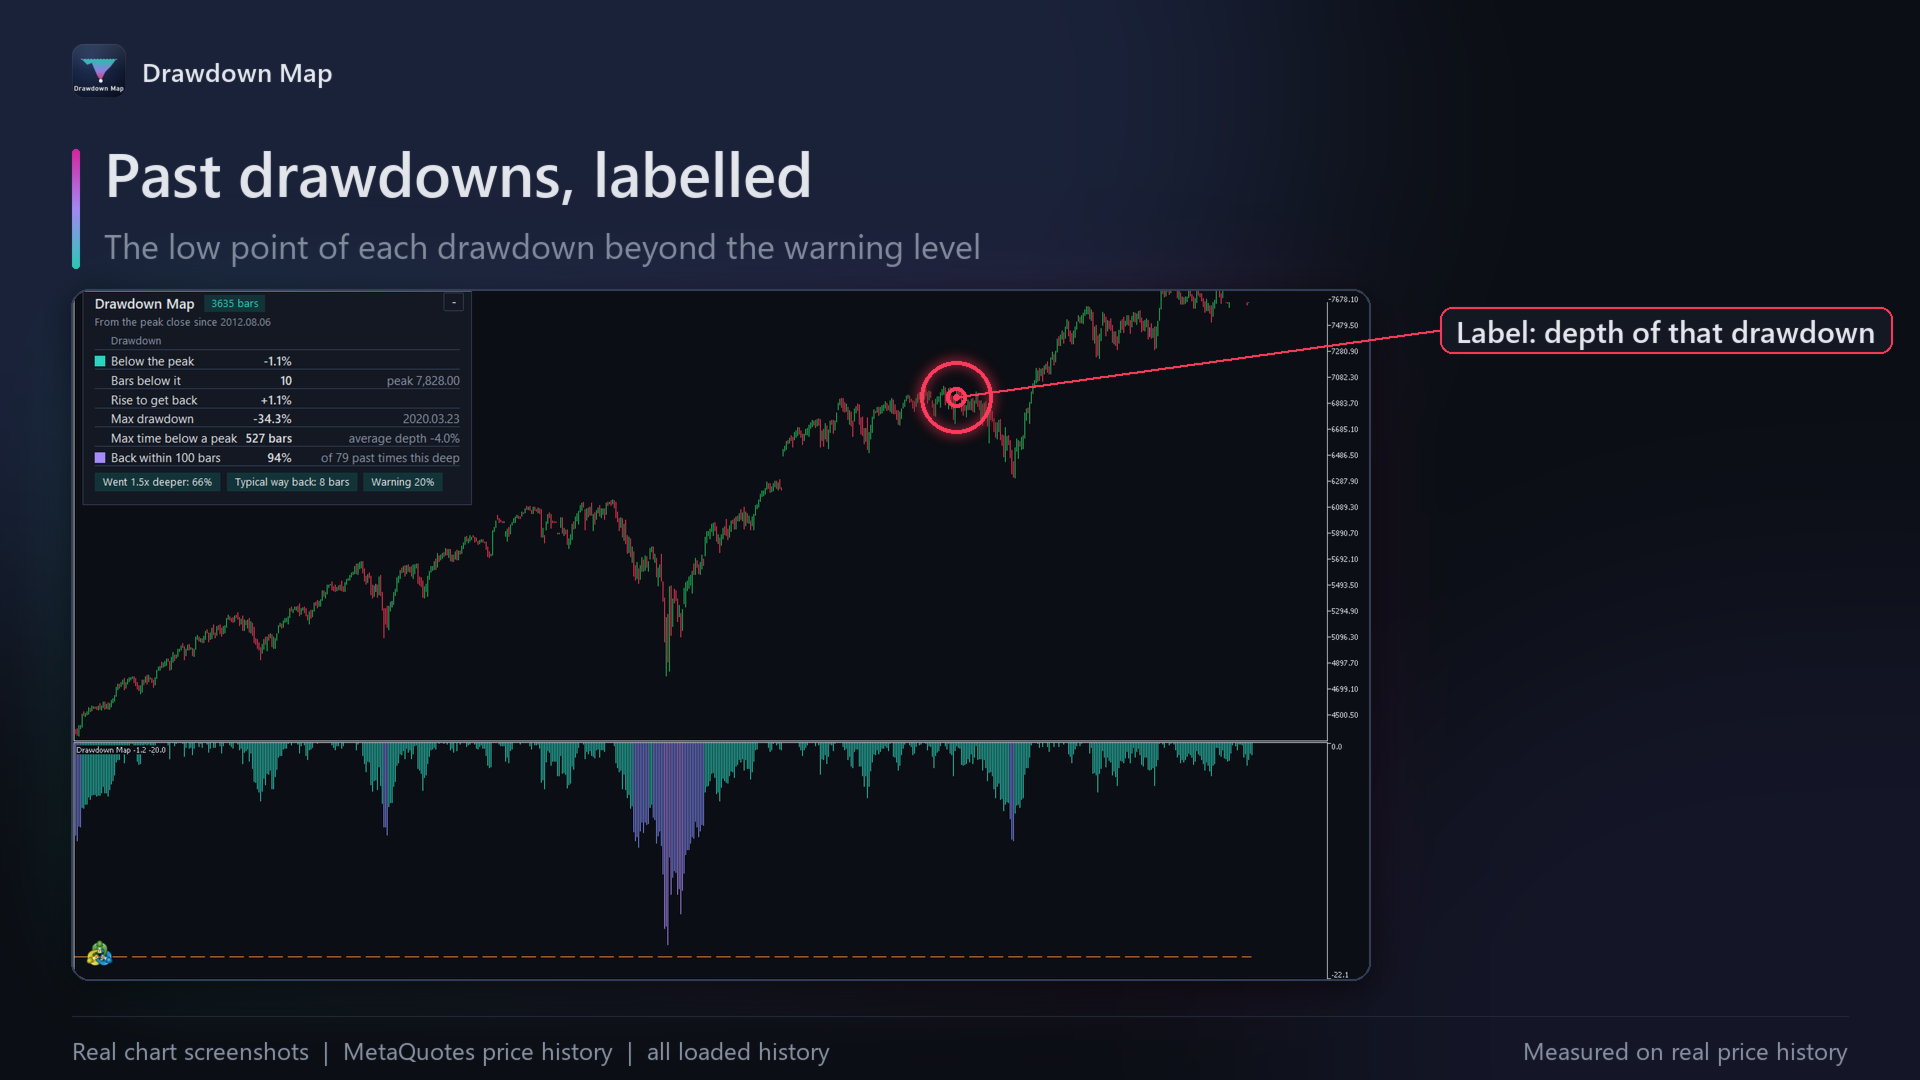
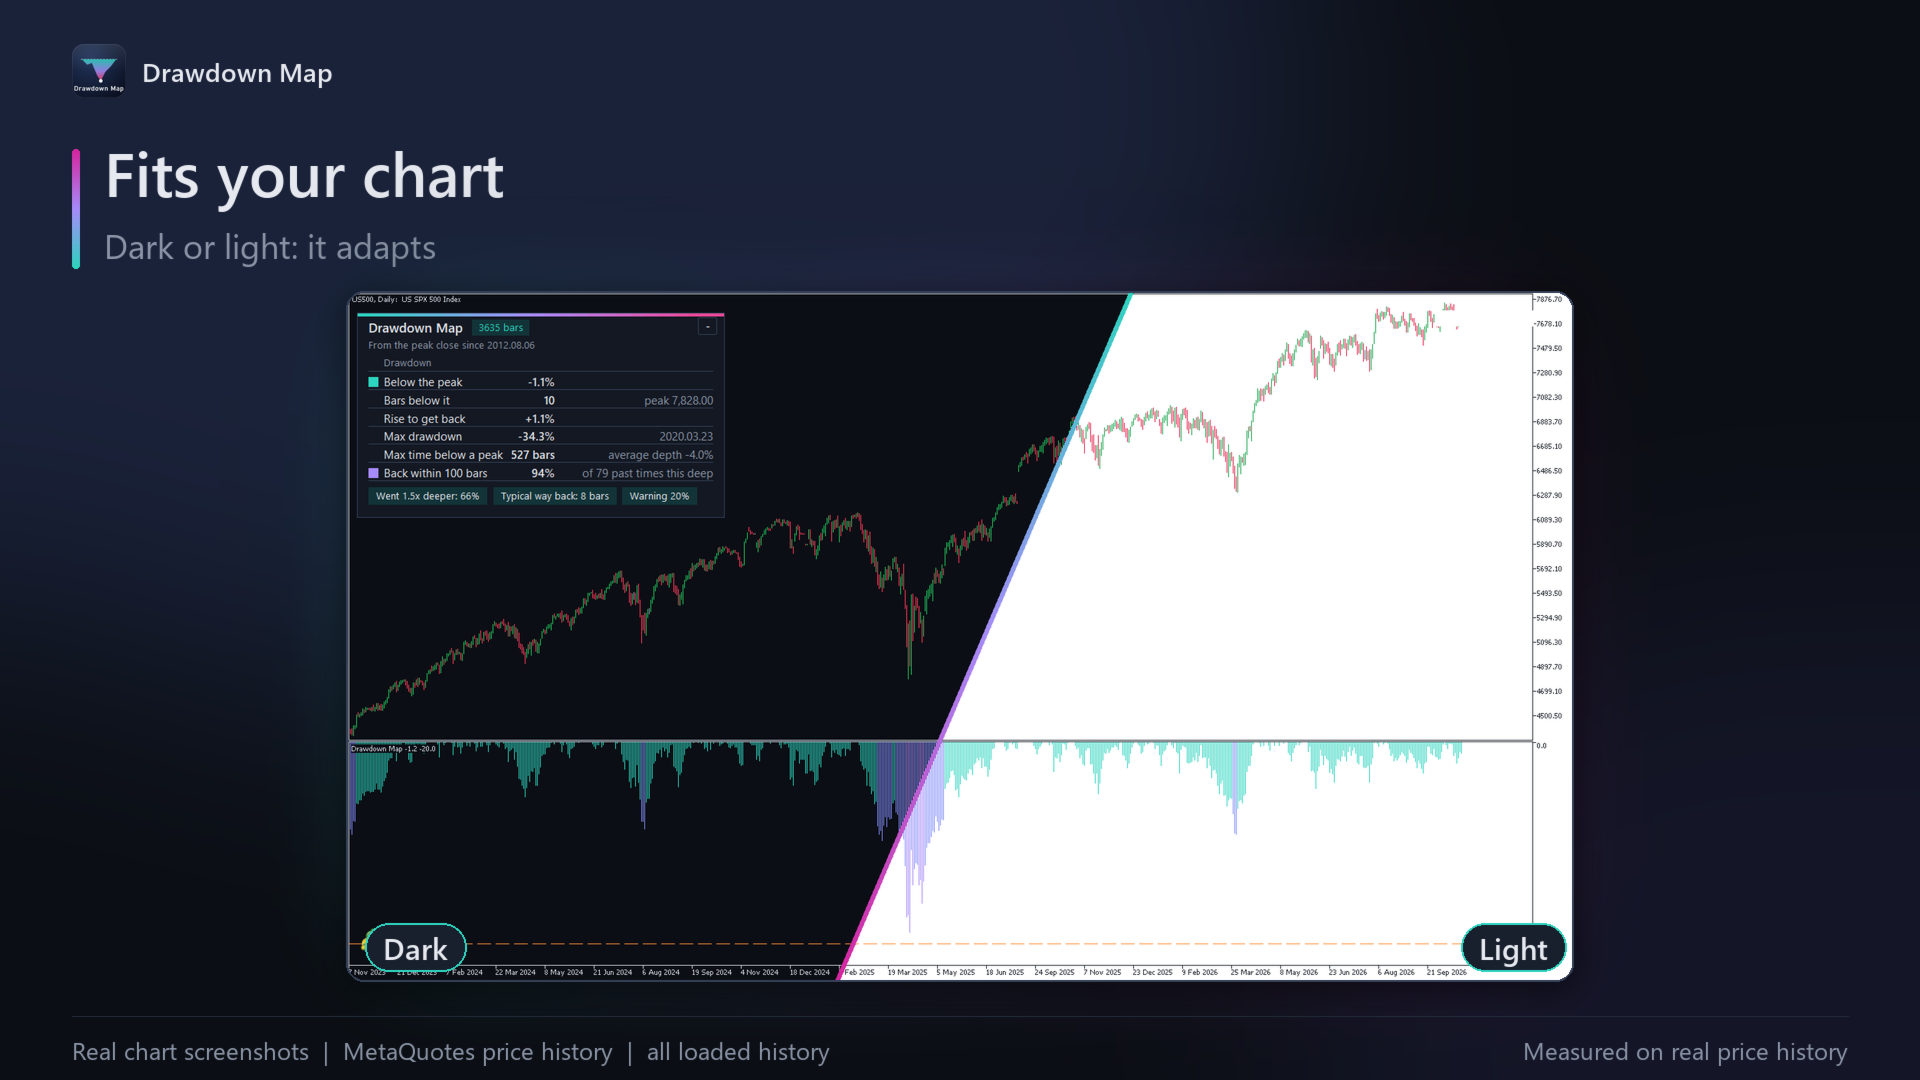
Drawdown Map draws the drawdown in its own window, coloured from aqua to red as it nears the maximum drawdown on the chart, with a dashed warning line. On the price chart it labels the low point of past drawdowns that went beyond the warning level. The panel shows how far price is below the peak, how many bars it has been there, the rise needed to get back, the maximum drawdown and its date, the maximum time below a peak, and, for today's depth, how often past drawdowns that reached it got back to their peak within 100 bars, how often they went 1.5 times deeper first, and the typical number of bars it took.
How it works
The figures come from this chart's own bars, using only closed bars, from the peak close (or high, a setting) since the first bar loaded. It works on any symbol and timeframe. It is light on your computer: the history is processed once per closed bar.
How it was tested
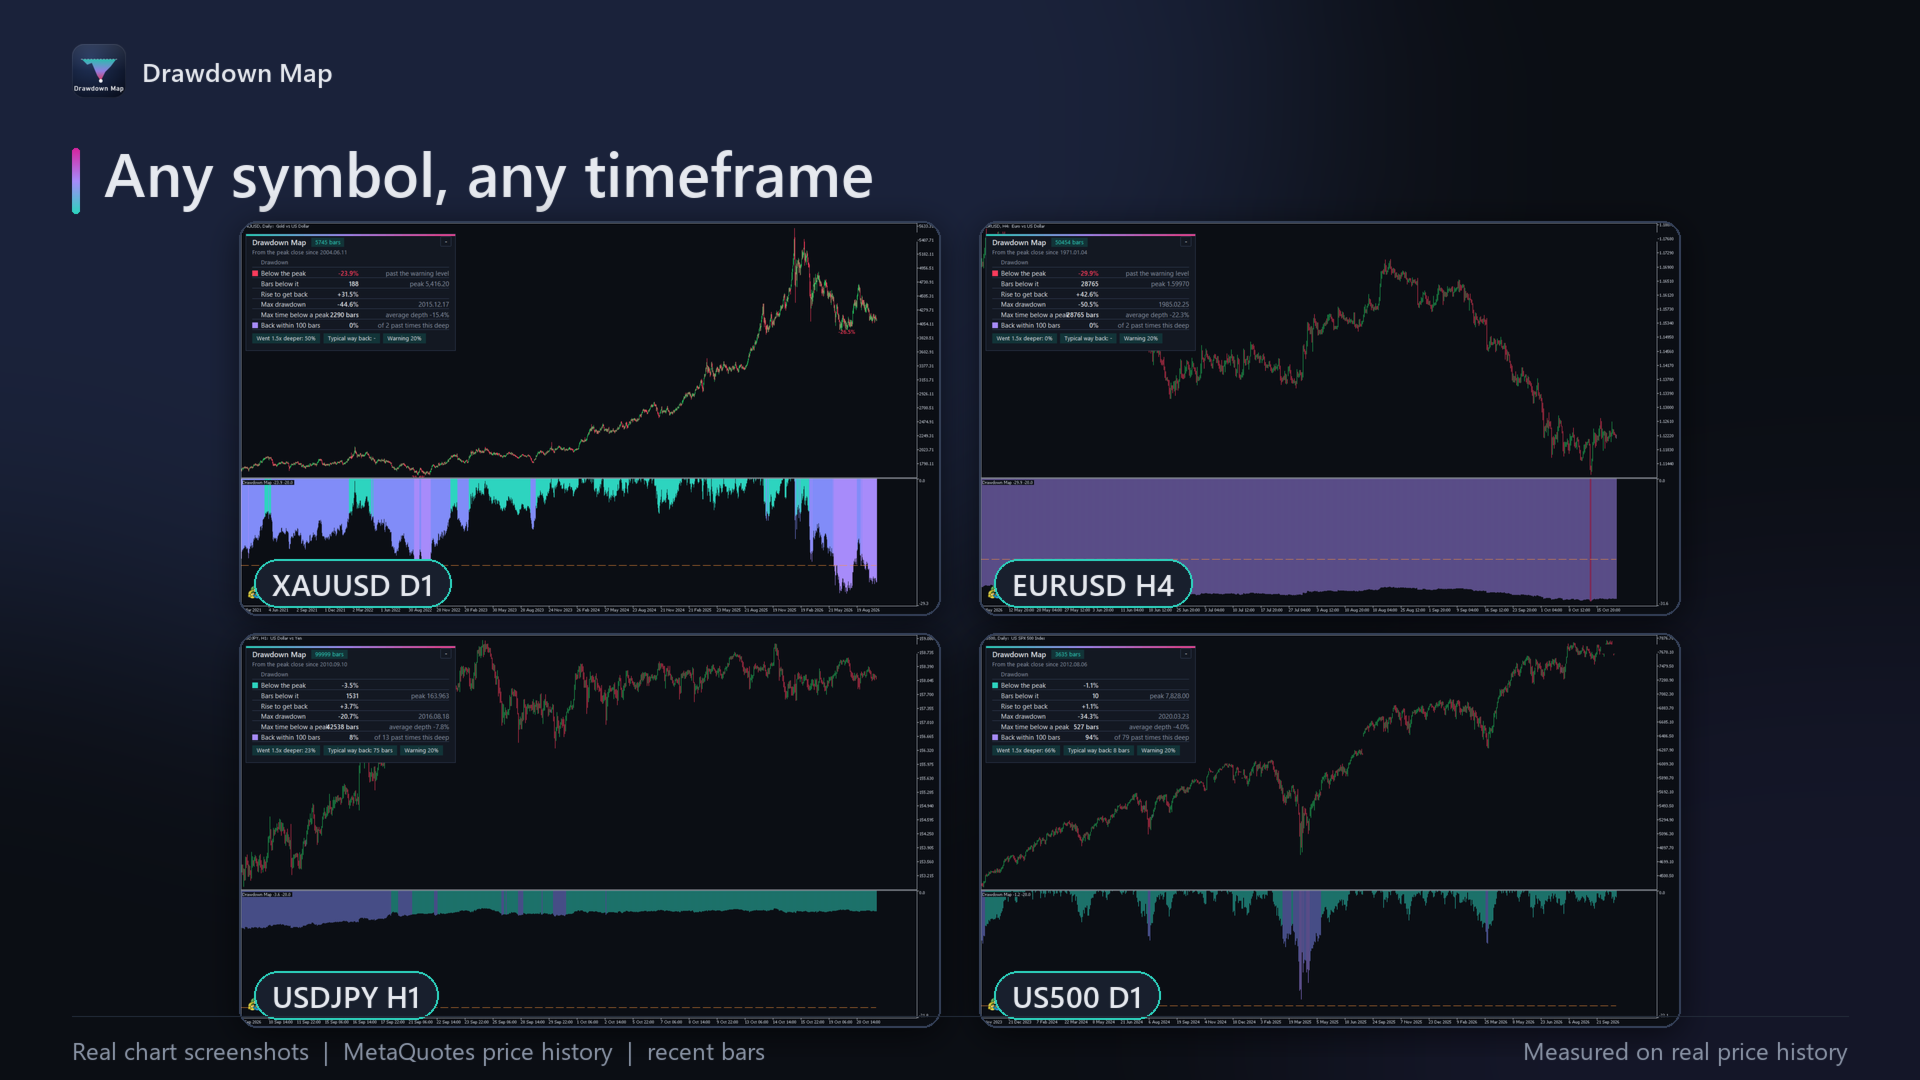
The calculations were checked independently: a separate implementation recomputes every figure (peak, drawdown, bars below the peak, maximum drawdown and maximum time below a peak, and the figures for past drawdowns this deep) from the same broker data, on gold, US500, EURUSD and USDJPY, on closes and on highs and lows, and both agree to the last decimal.
Results and risks
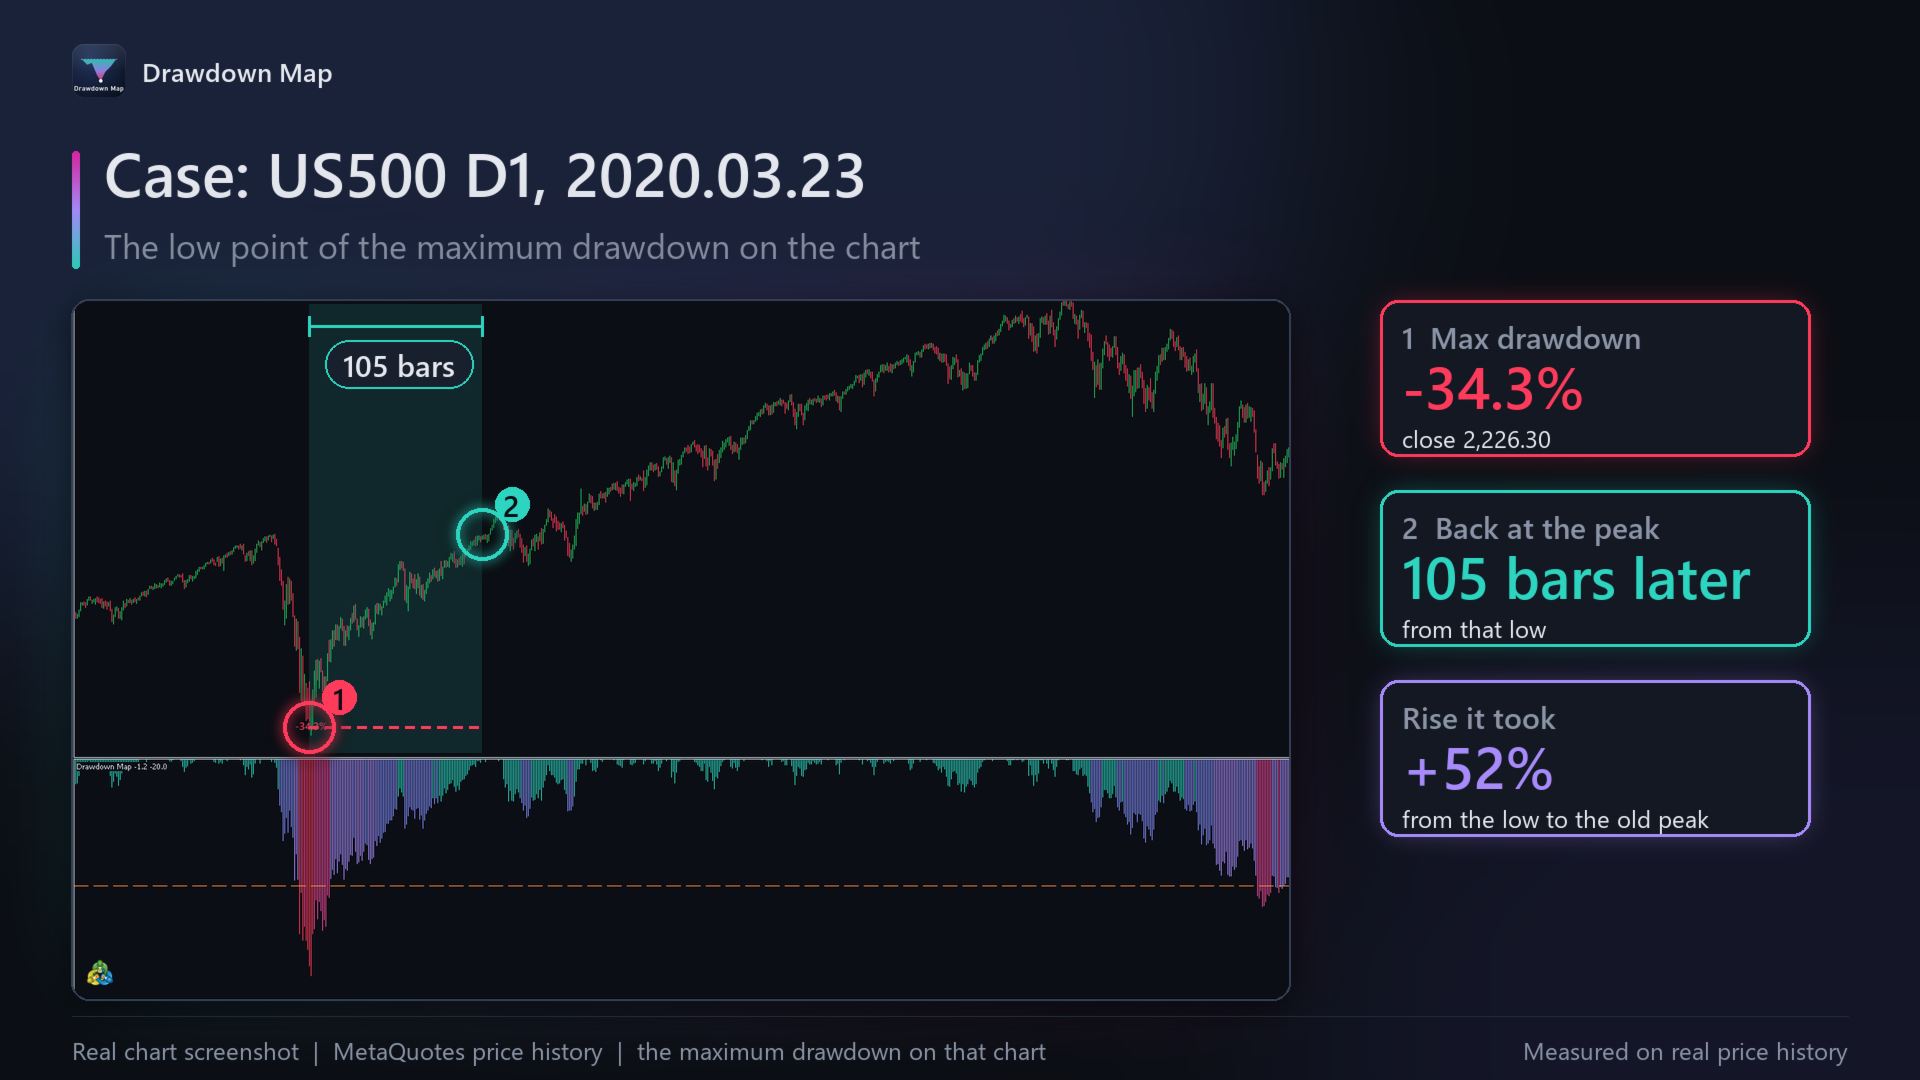
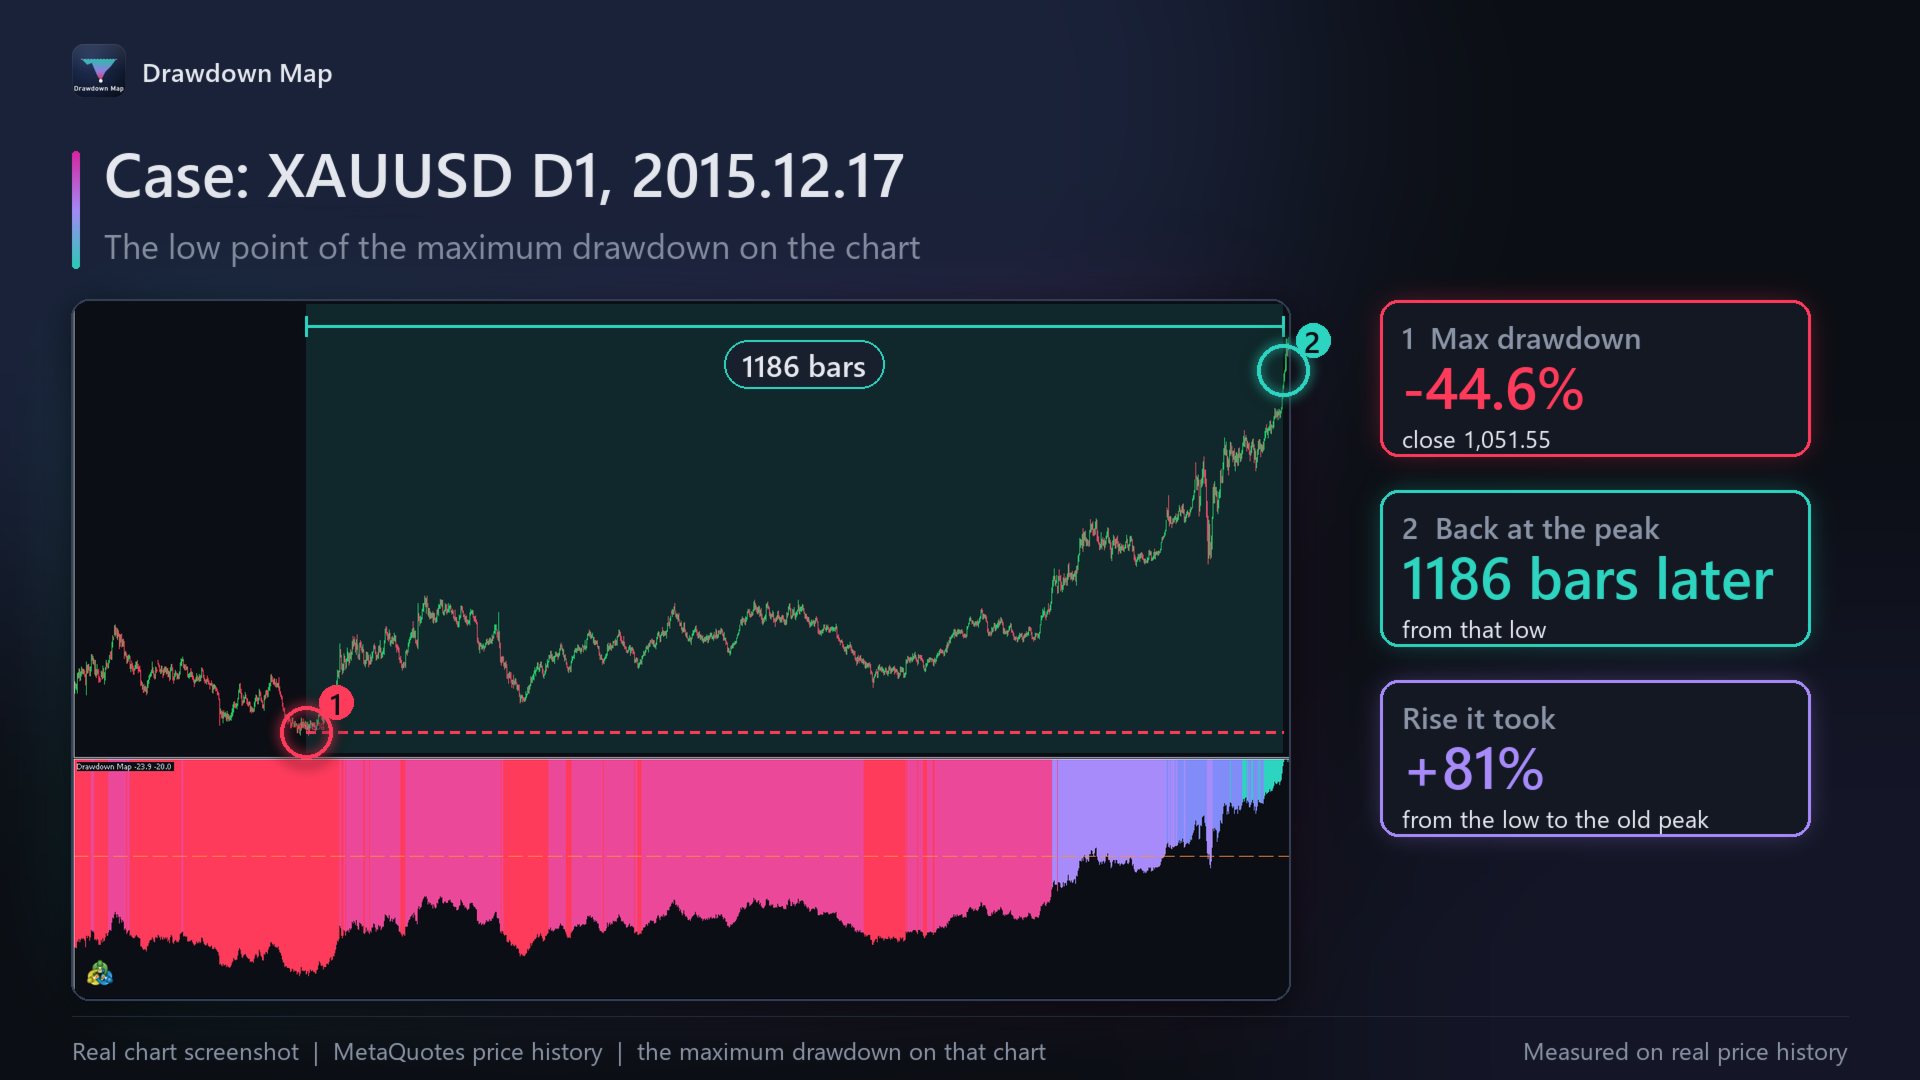
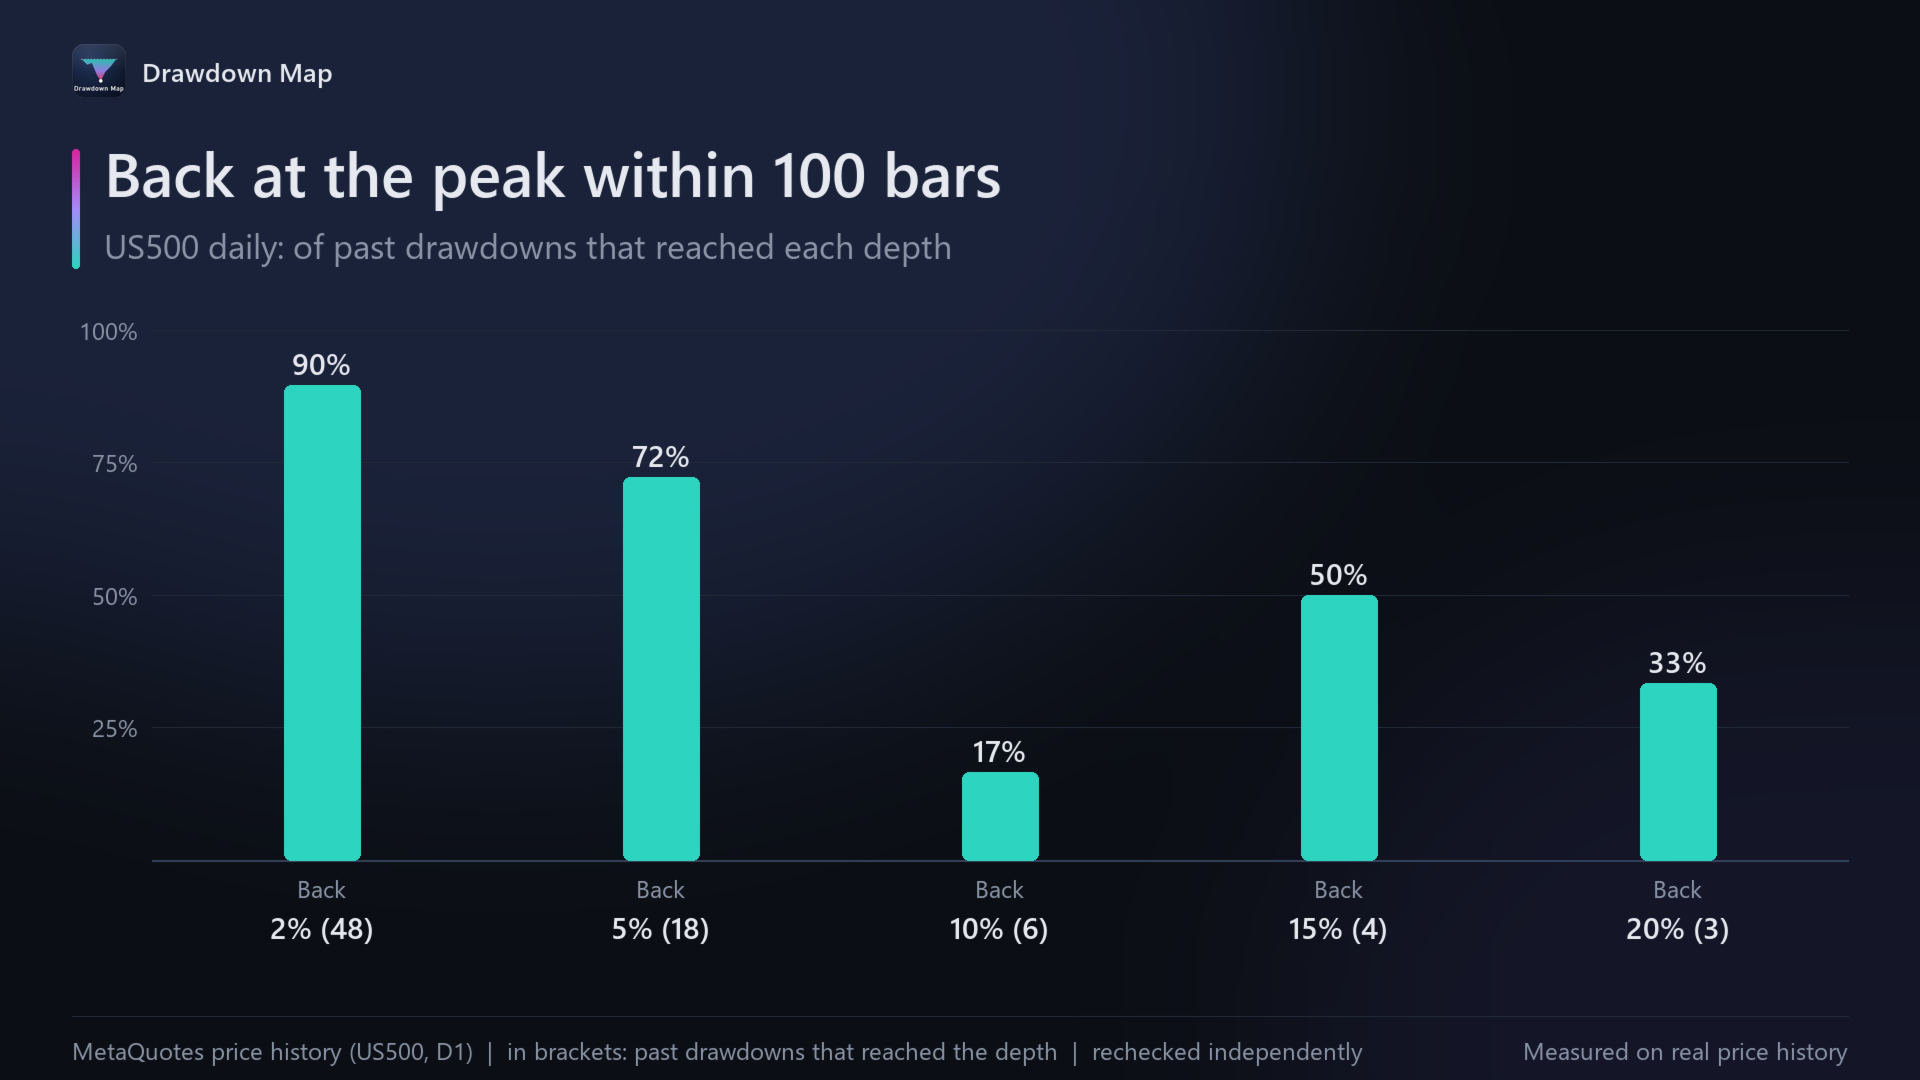
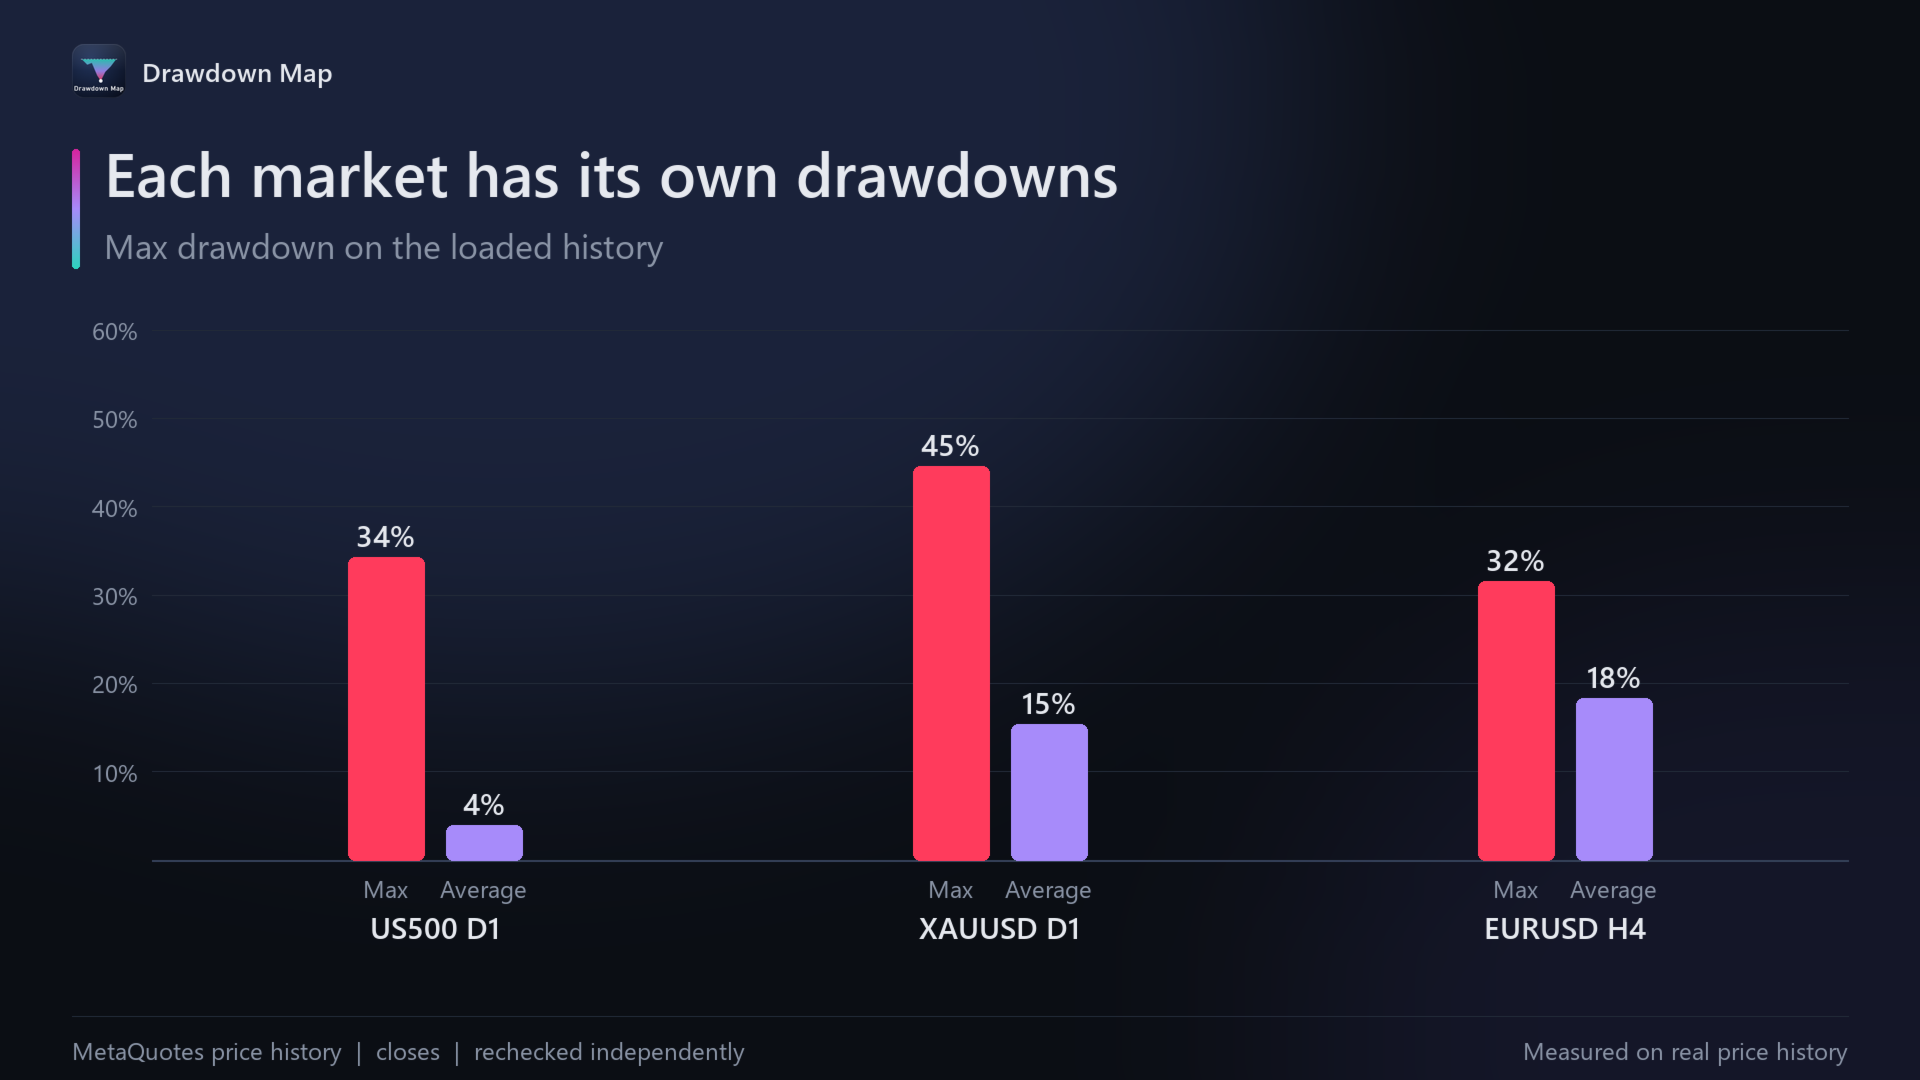
On US500 (D1, MetaQuotes price history since 6 August 2012) the maximum drawdown was 34.3%, on 23 March 2020, and the maximum time below a peak was 527 bars. Of the 18 past drawdowns on that chart that reached 5%, 72% got back to the peak within 100 bars, 61% went 1.5 times deeper first, and the typical way back took 18 bars. On gold (XAUUSD, D1, from 11 June 2004) the maximum drawdown was 44.6%, on 17 December 2015. These figures describe the past on that chart, not the future: a drawdown can go further than any before it.
Recommended use
Any symbol and timeframe; daily charts show long drawdowns clearly. Typical uses: seeing at a glance how deep and how long the current drawdown is against this chart's own history, and the warning level as a visual guide.
Inputs
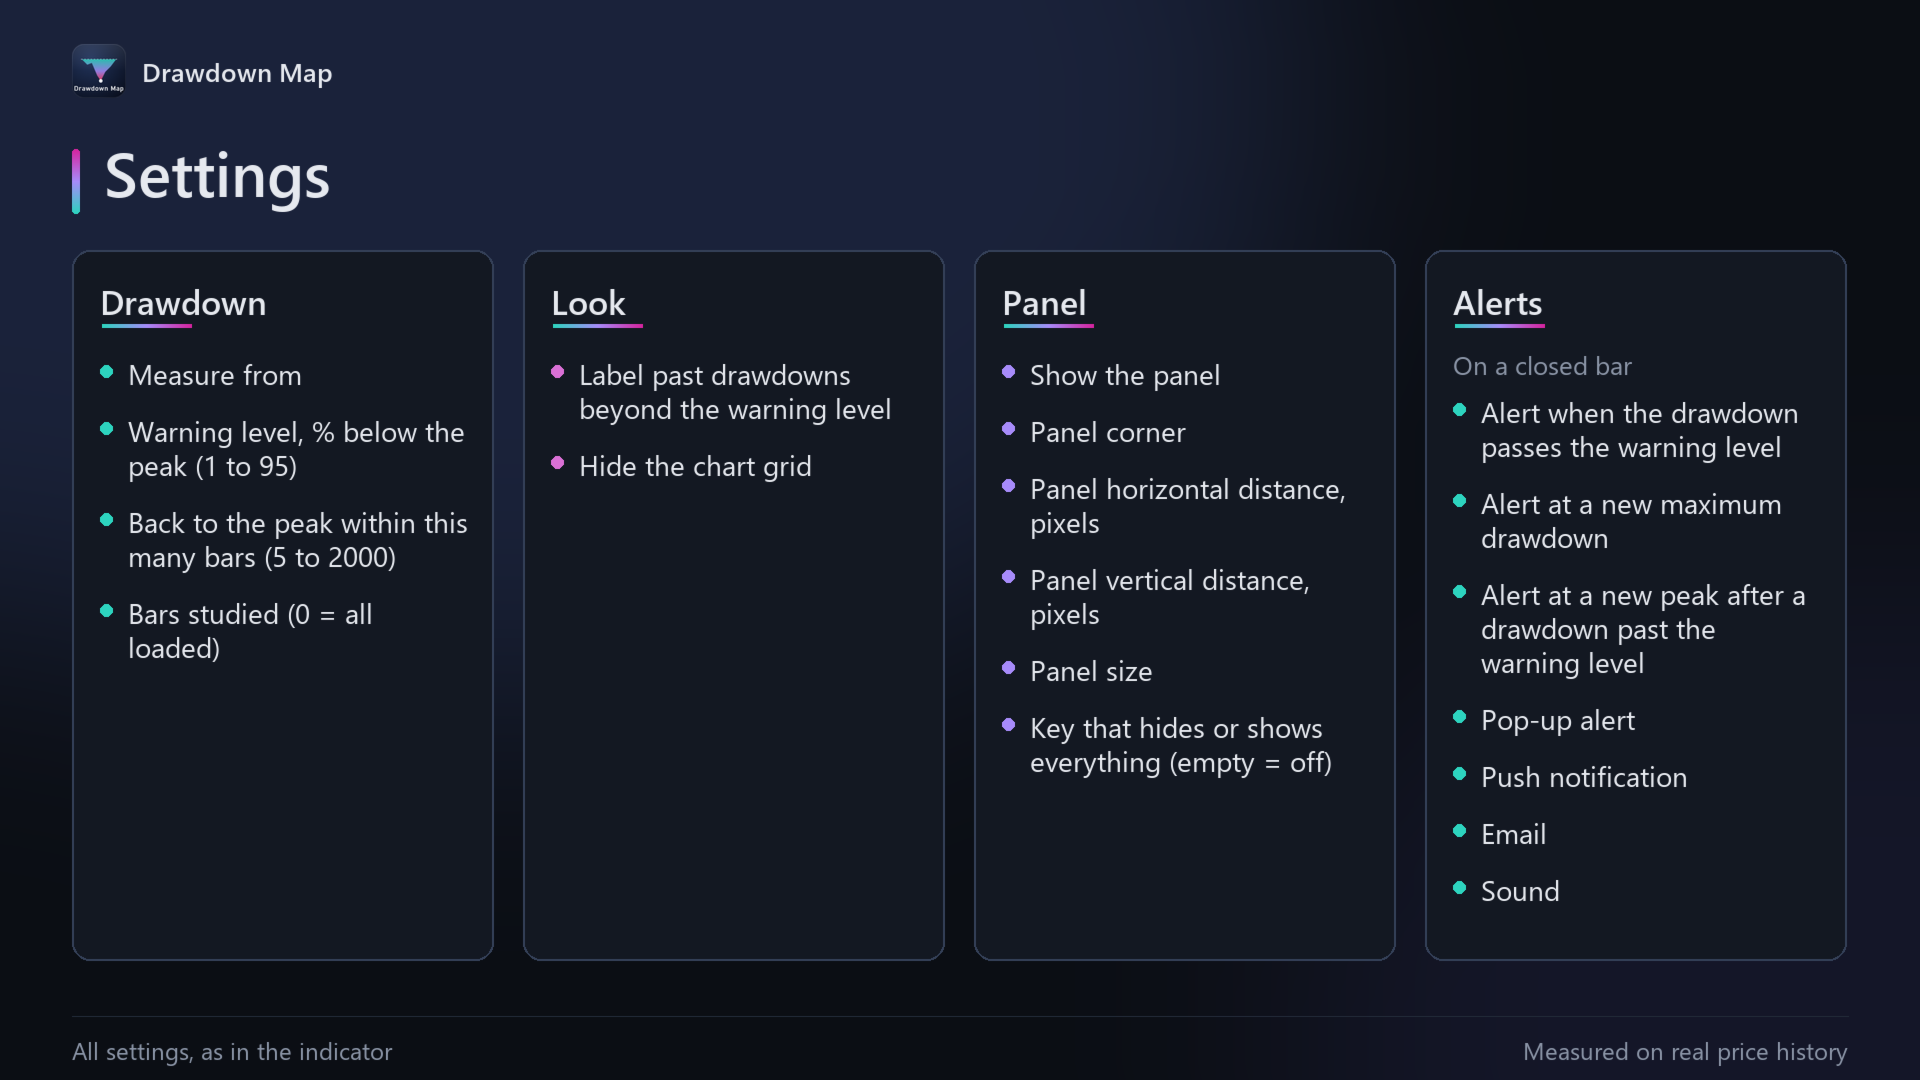
- Measure from closes or from highs and lows (the worst point in each bar).
- Warning level, % below the peak (default 20).
- Back to the peak within this many bars (default 100); bars studied (default 0 = all loaded).
- Labels for past drawdowns beyond the warning level on the price chart.
- Panel: show or hide, any chart corner, distance from the edges in pixels, and size (small, normal, large). One key (H by default) hides or shows everything the indicator draws.
- Alerts: when the drawdown passes the warning level, at a new maximum drawdown, and at a new peak after a drawdown past the warning level; pop-up, push notification, email and sound, each on or off. Off by default.
- Hide the chart grid: on by default.
Risk notice
Trading forex, metals, indices and other leveraged products carries a high risk of loss. Drawdown Map is an analysis tool: it does not give investment advice or trading recommendations, and it does not guarantee any result. All figures describe past data, and past behaviour does not guarantee future behaviour. You are responsible for your own trading decisions.
Support
Questions? Message me through MQL5 chat.
A full guide with pictures: https://www.mql5.com/en/blogs/post/778184