Day Type Map
- Indicatori
-
Anna Makwana
 MetaTrader tools and indicators that measure the odds on your own chart: how often levels were reached, how far days and sessions usually run, and what followed past signals. Every figure comes from the symbol’s own price history and uses closed bars only, so nothing repaints. Questions are welcome
- Versione: 1.0
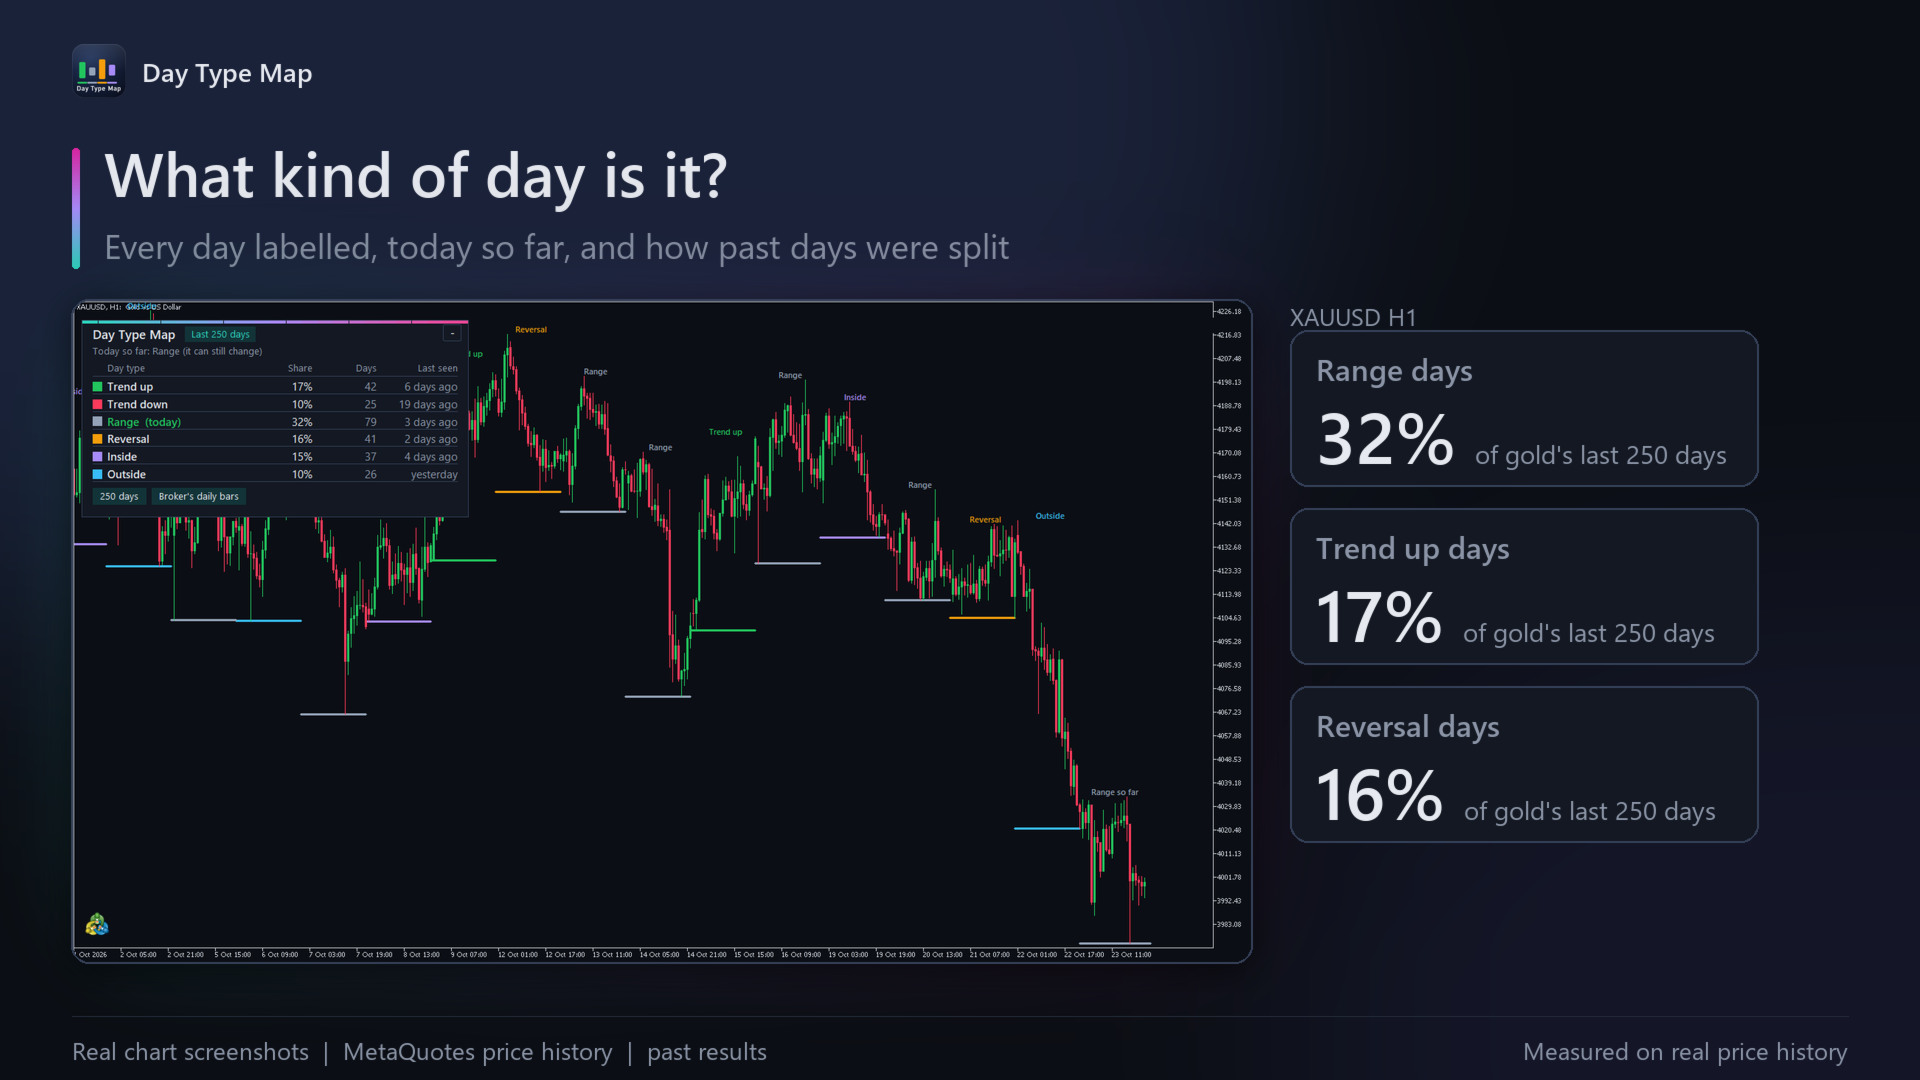
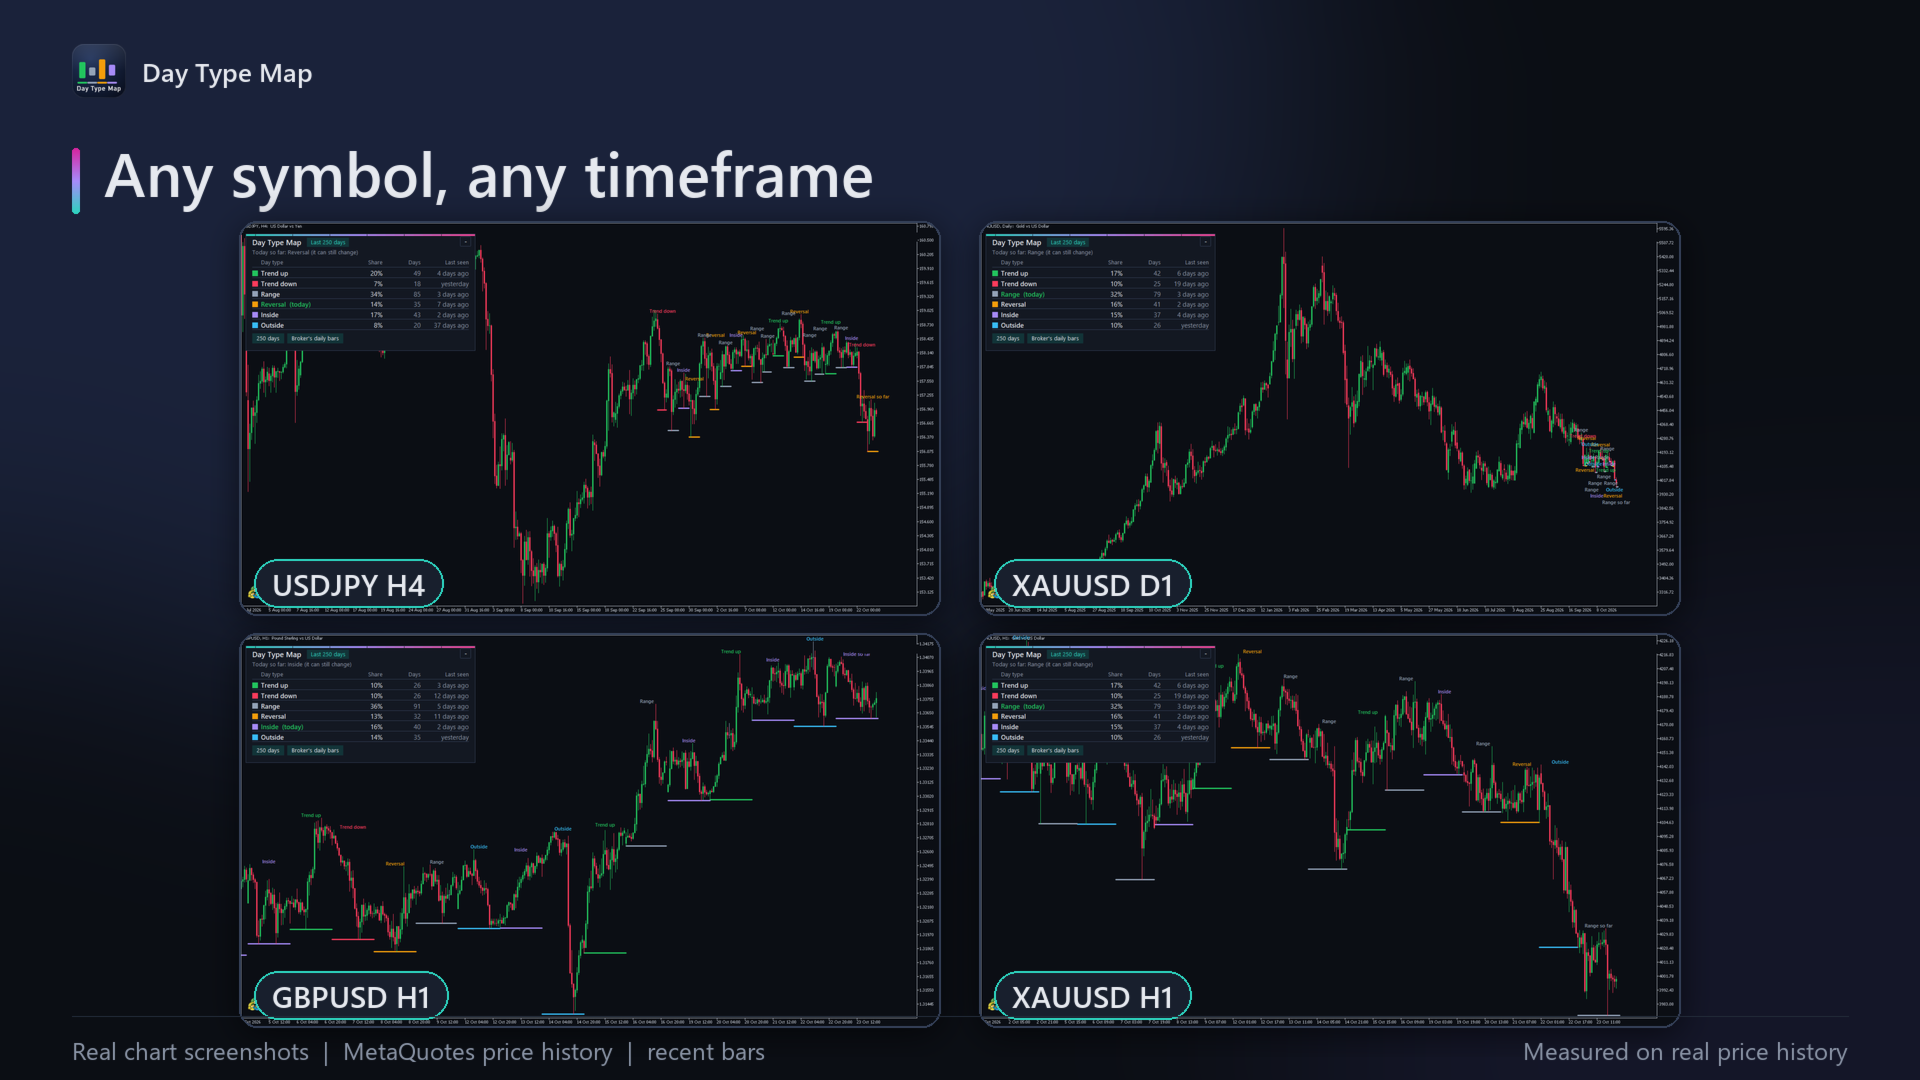
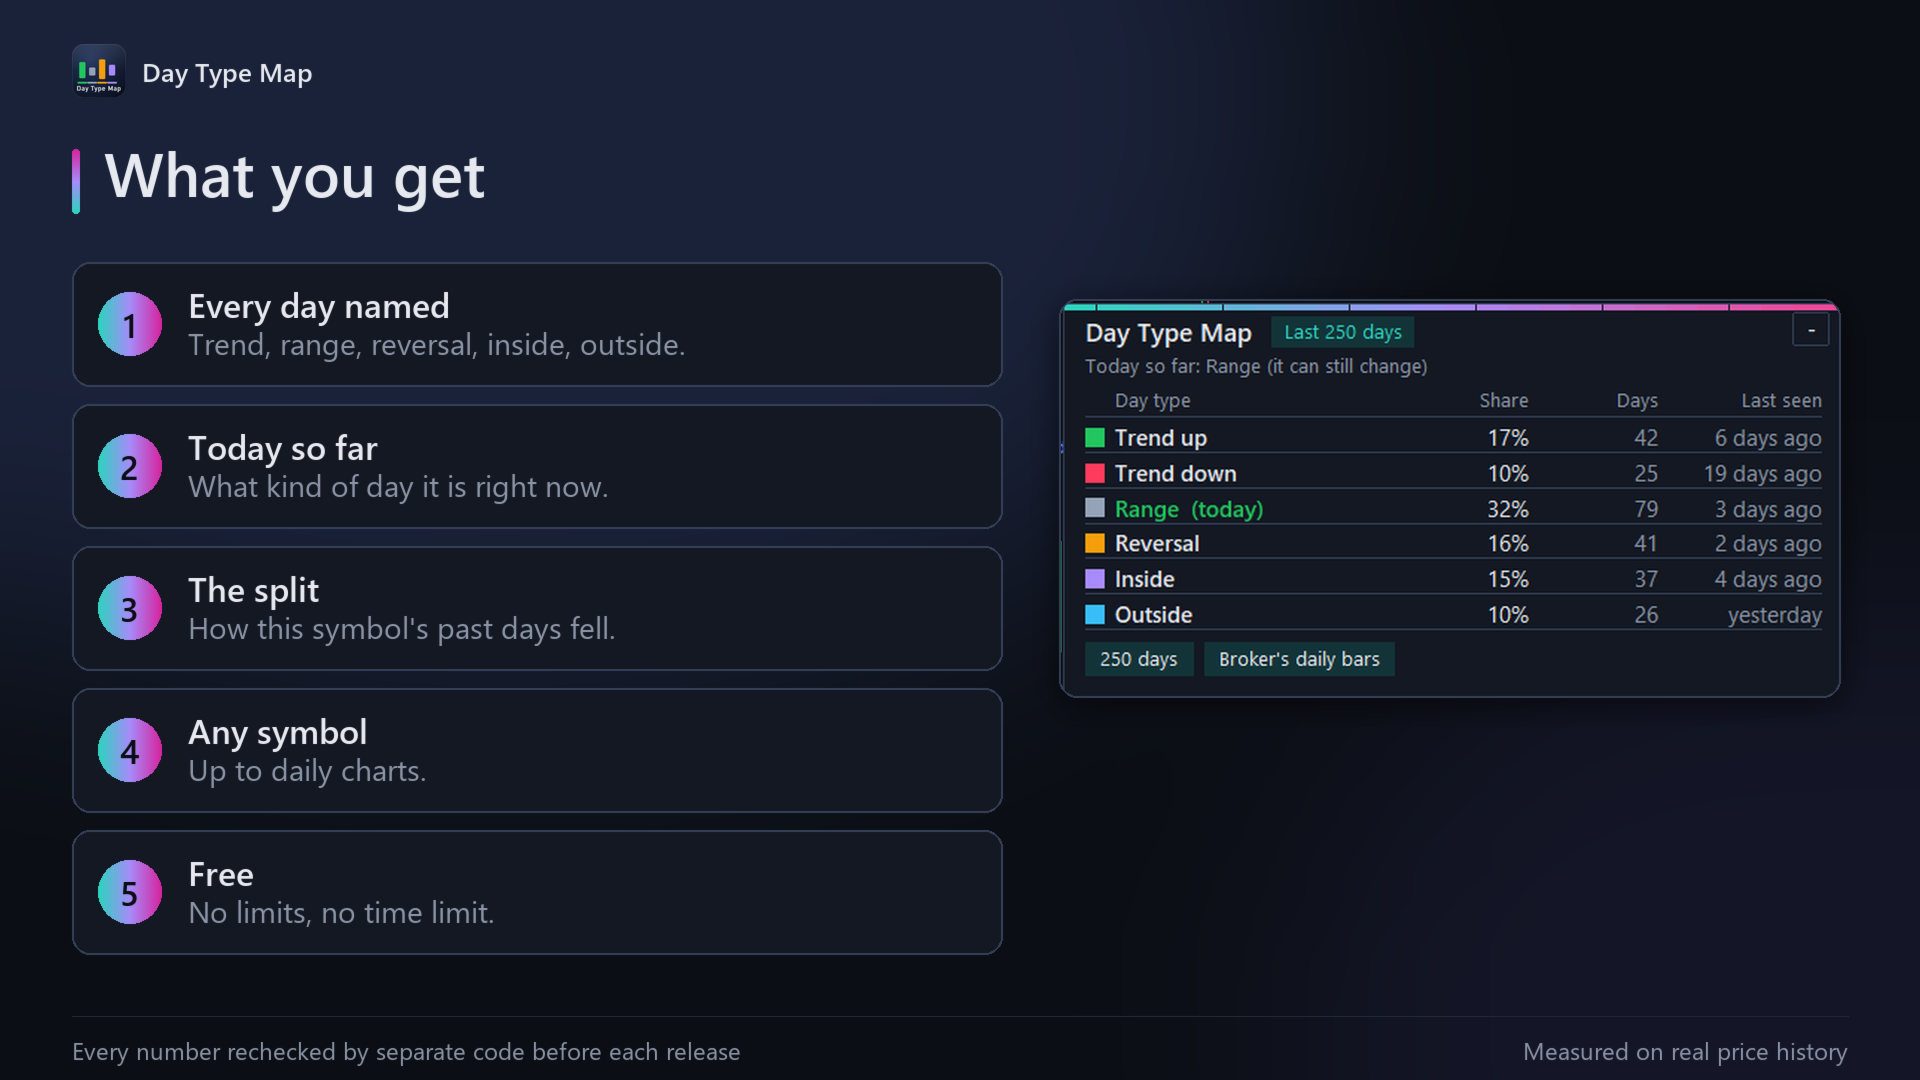
What kind of day is it: a trend day, a range day, a reversal, an inside or an outside day? Day Type Map names every day on your chart, shows what today is so far, and how this symbol's past days were split between the six types. On gold over the last 250 days, 32% were range days, 17% trend-up days and 16% reversals. Free, clear, and checked against a separate implementation.
What it does
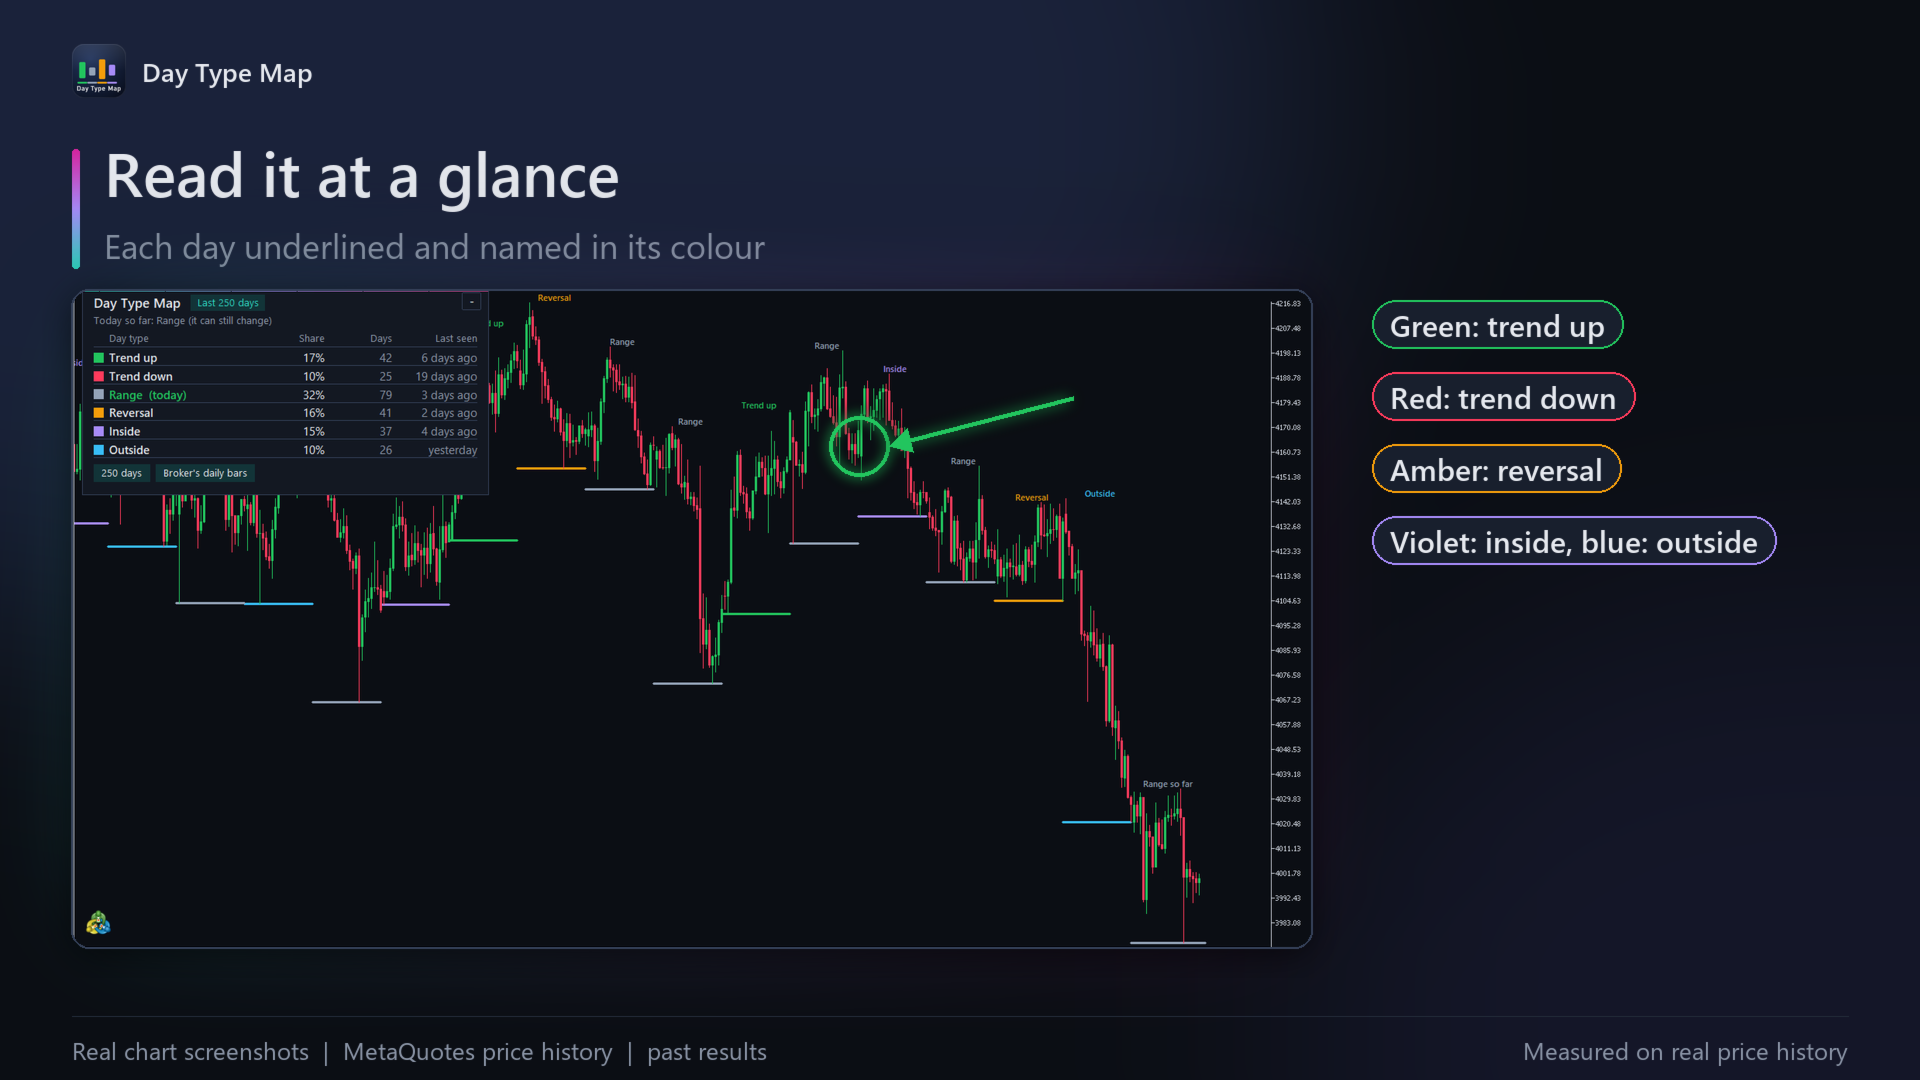
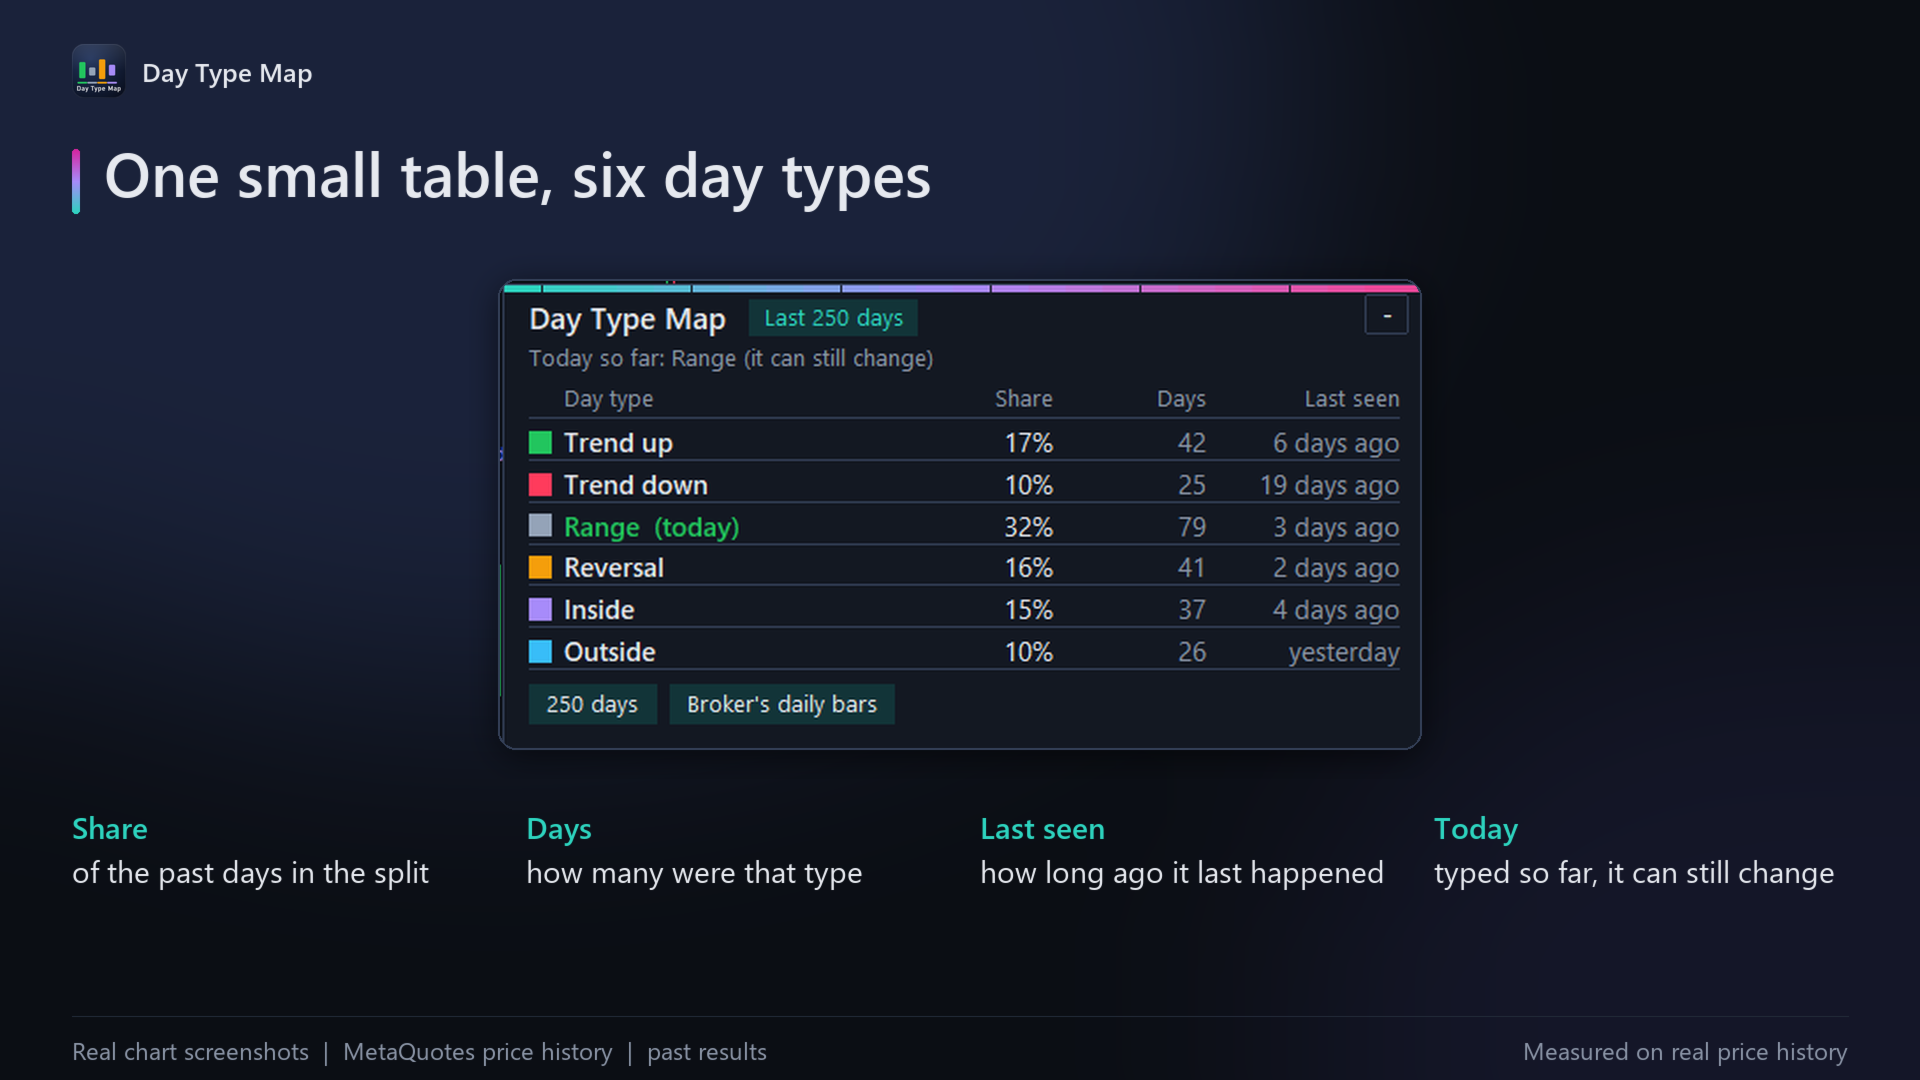
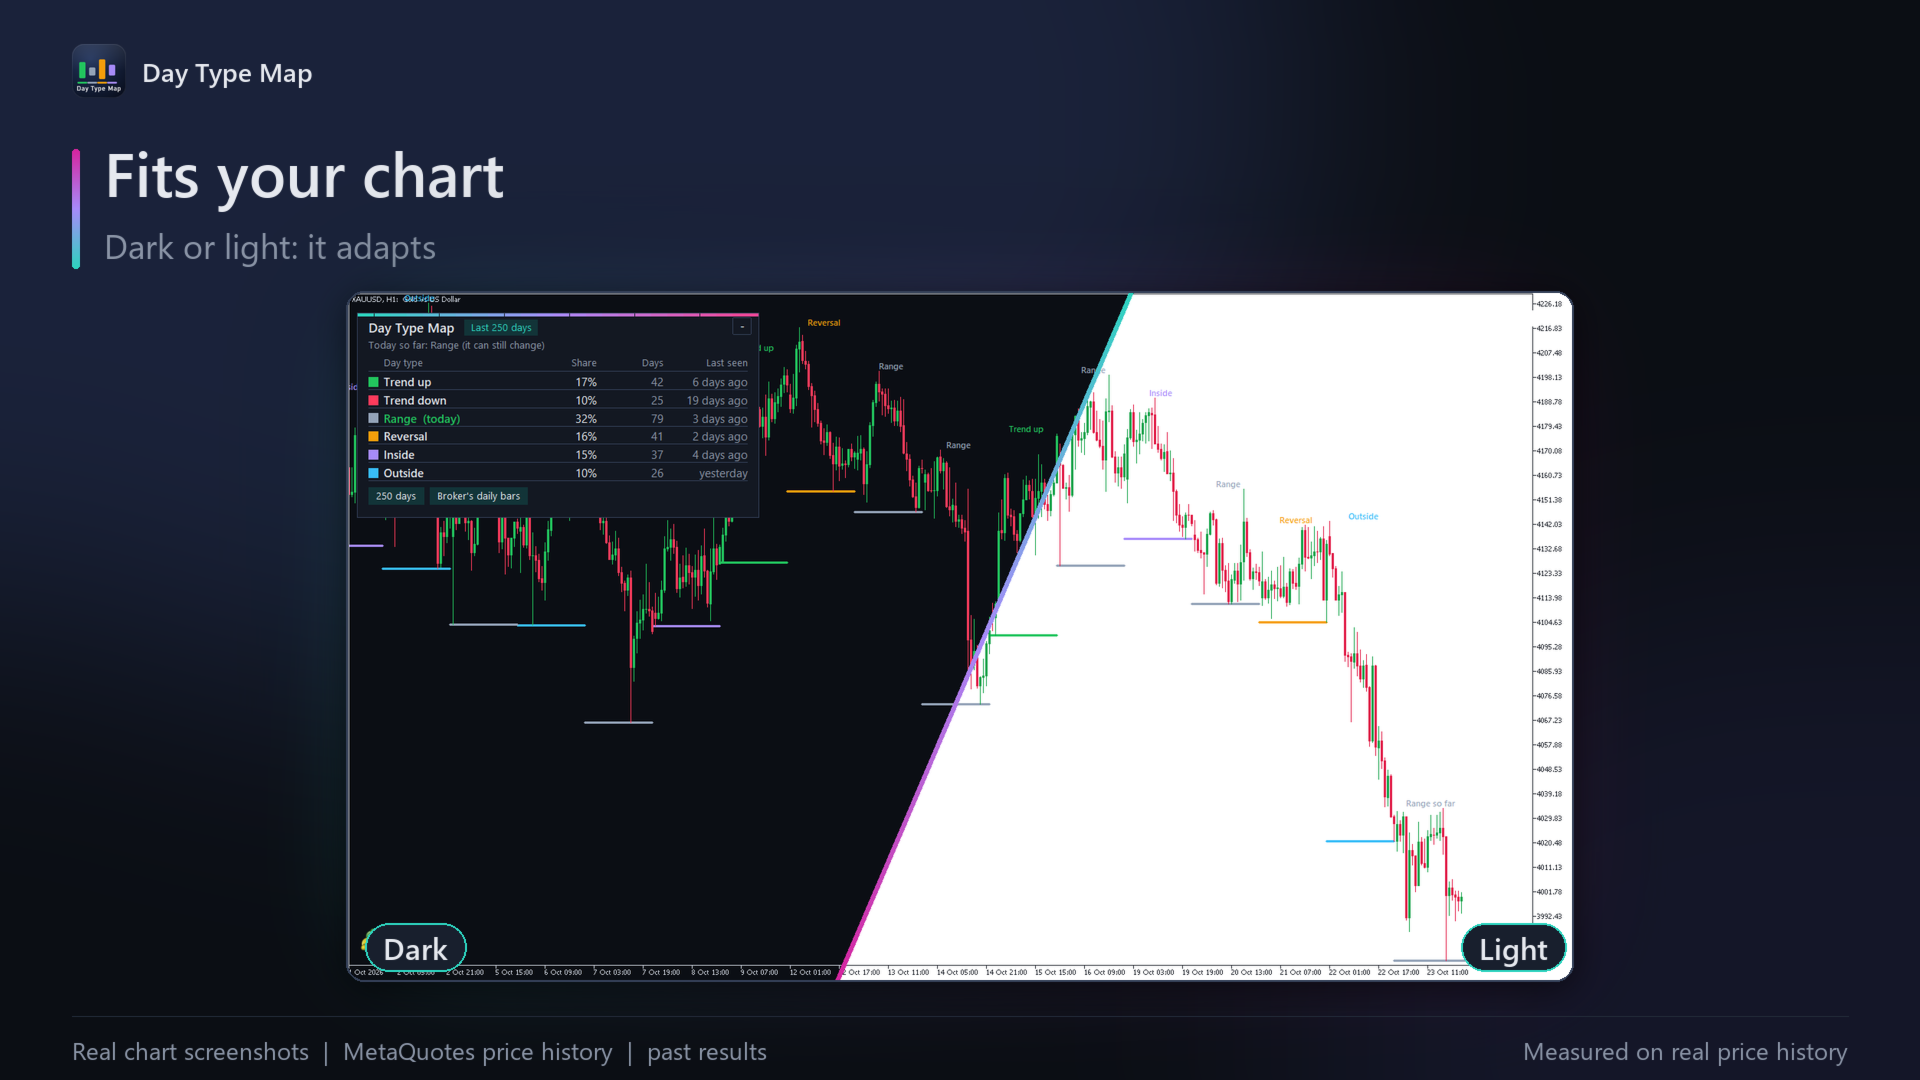
Each recent day is underlined and named in its own colour: trend up, trend down, range, reversal, inside or outside. Today is named as it forms ("Range so far"). A small table lists the six types with their share of past days, how many days each type had and how long ago each last happened, with today's type highlighted. An optional alert tells you when today's type changes.
How it works
Each day is typed from its own open, high, low and close and from the previous day's high and low, with plain, fixed rules that are the same for every symbol: an inside day stays within the previous day; an outside day goes beyond both ends; a reversal goes beyond one end of the previous day and closes back near the other side of its own range; a trend day closes far from where it opened; every other day is a range day. The split uses the past days you choose (the last 250 by default, or all history). Only finished days are counted; today is typed as it unfolds and can still change.
How it was tested
Every day's type, and every number in the split (days, shares and last seen), is recomputed by a separate implementation from the same broker data and matches it exactly, on gold, EURUSD, US500 and USDJPY over their full daily history, for several history lengths.
Results and risks
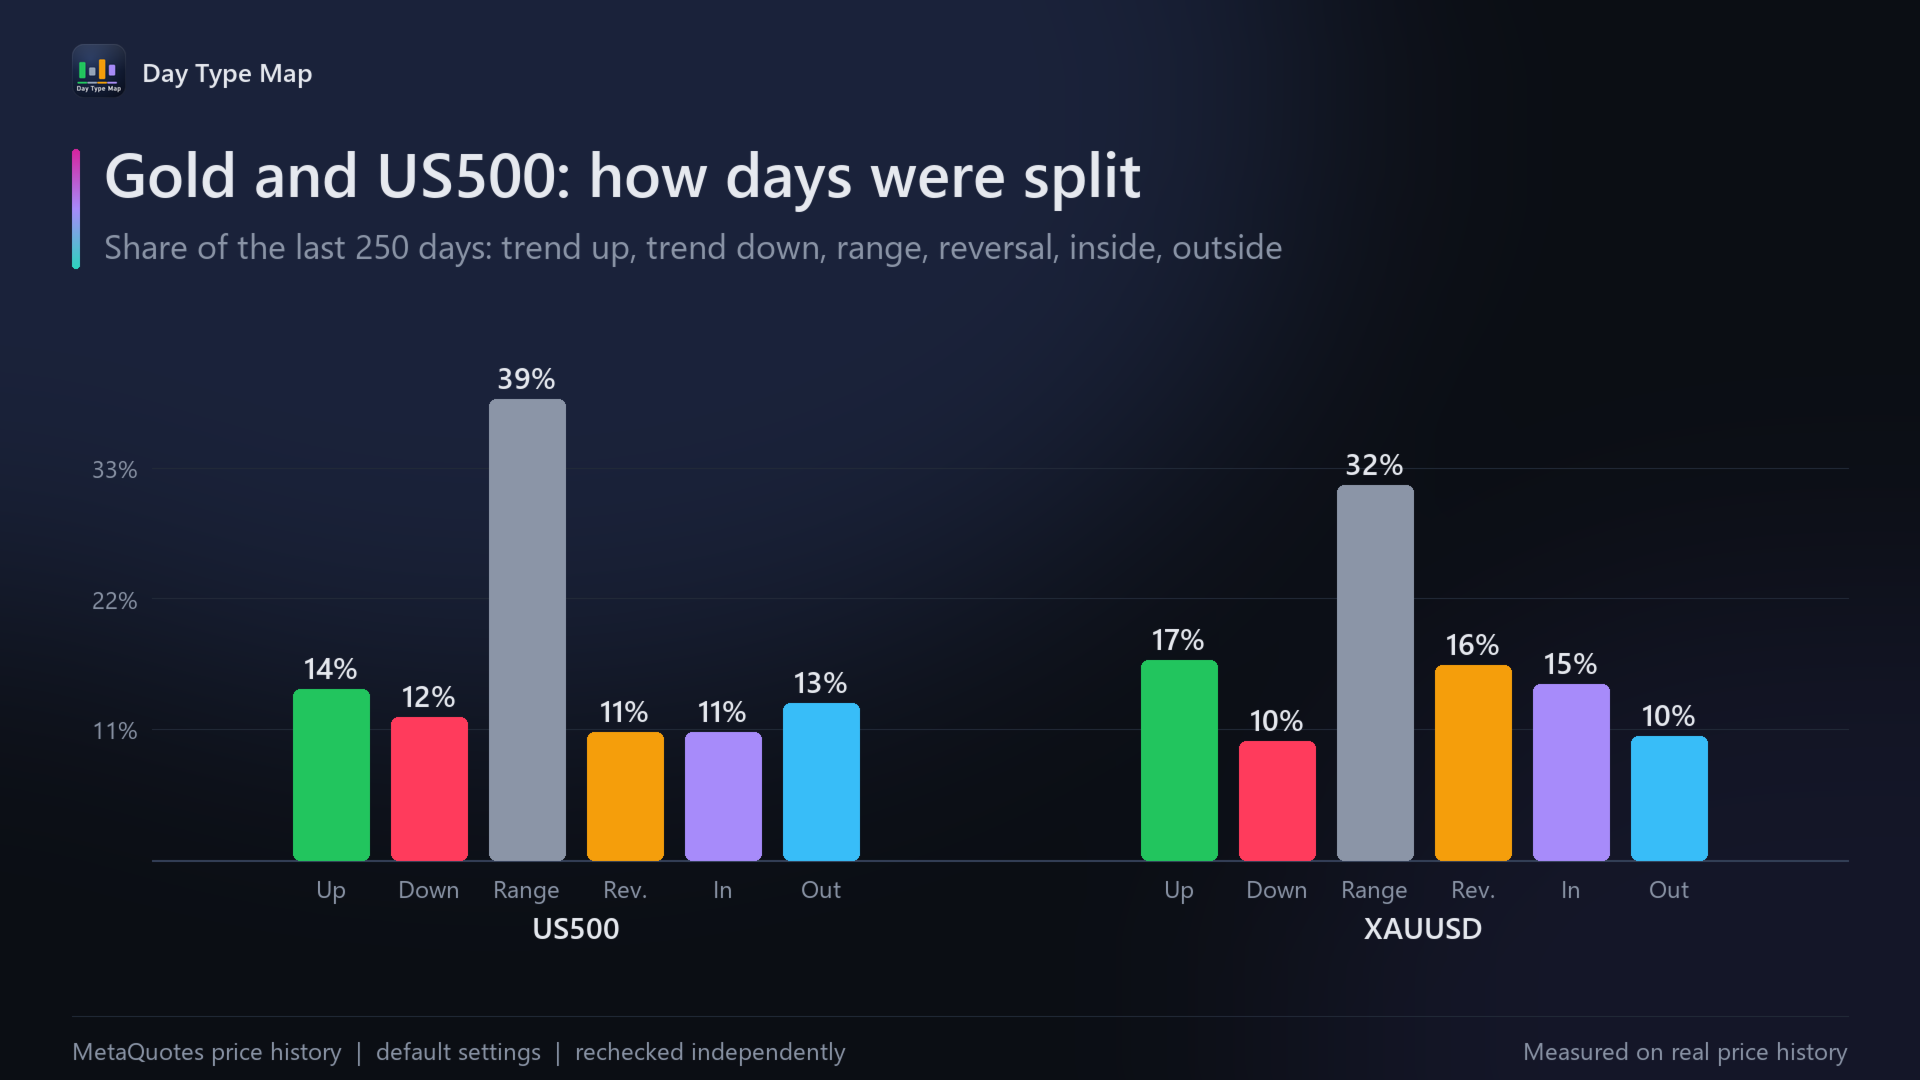
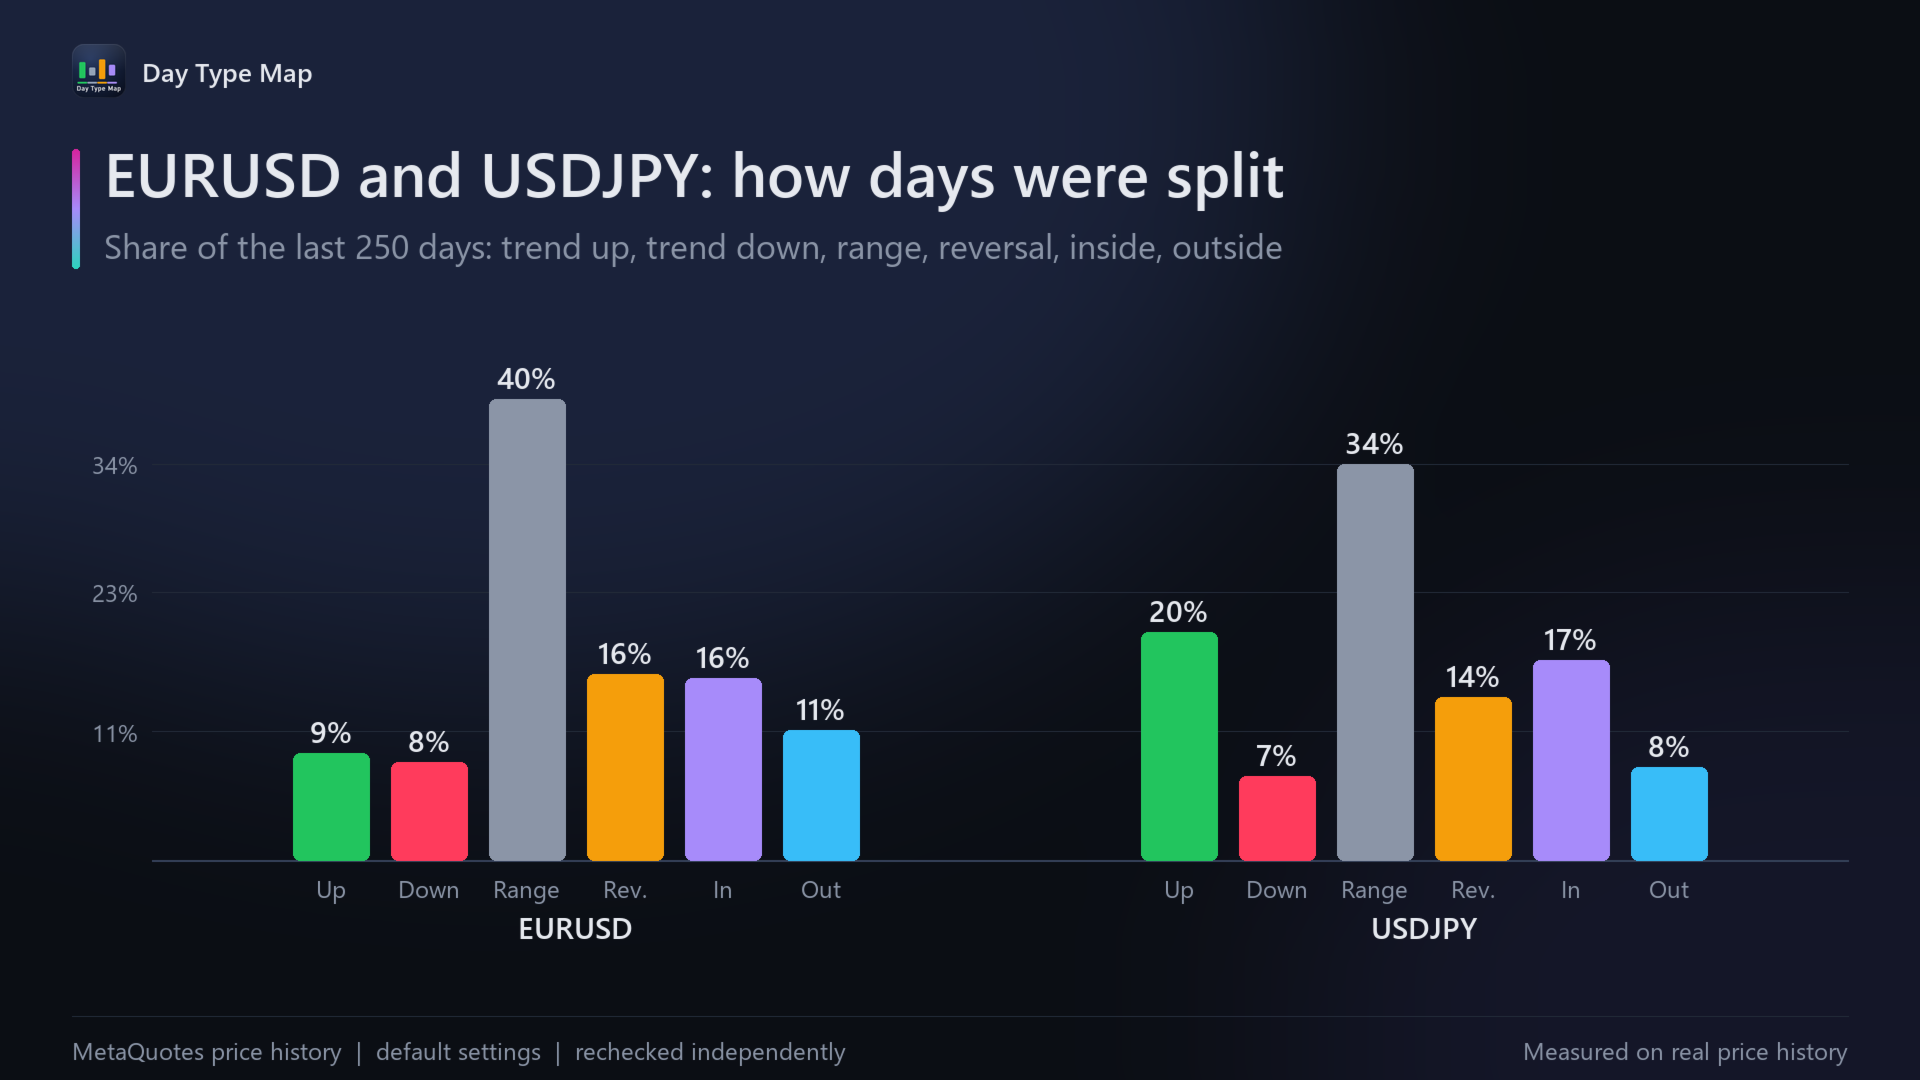
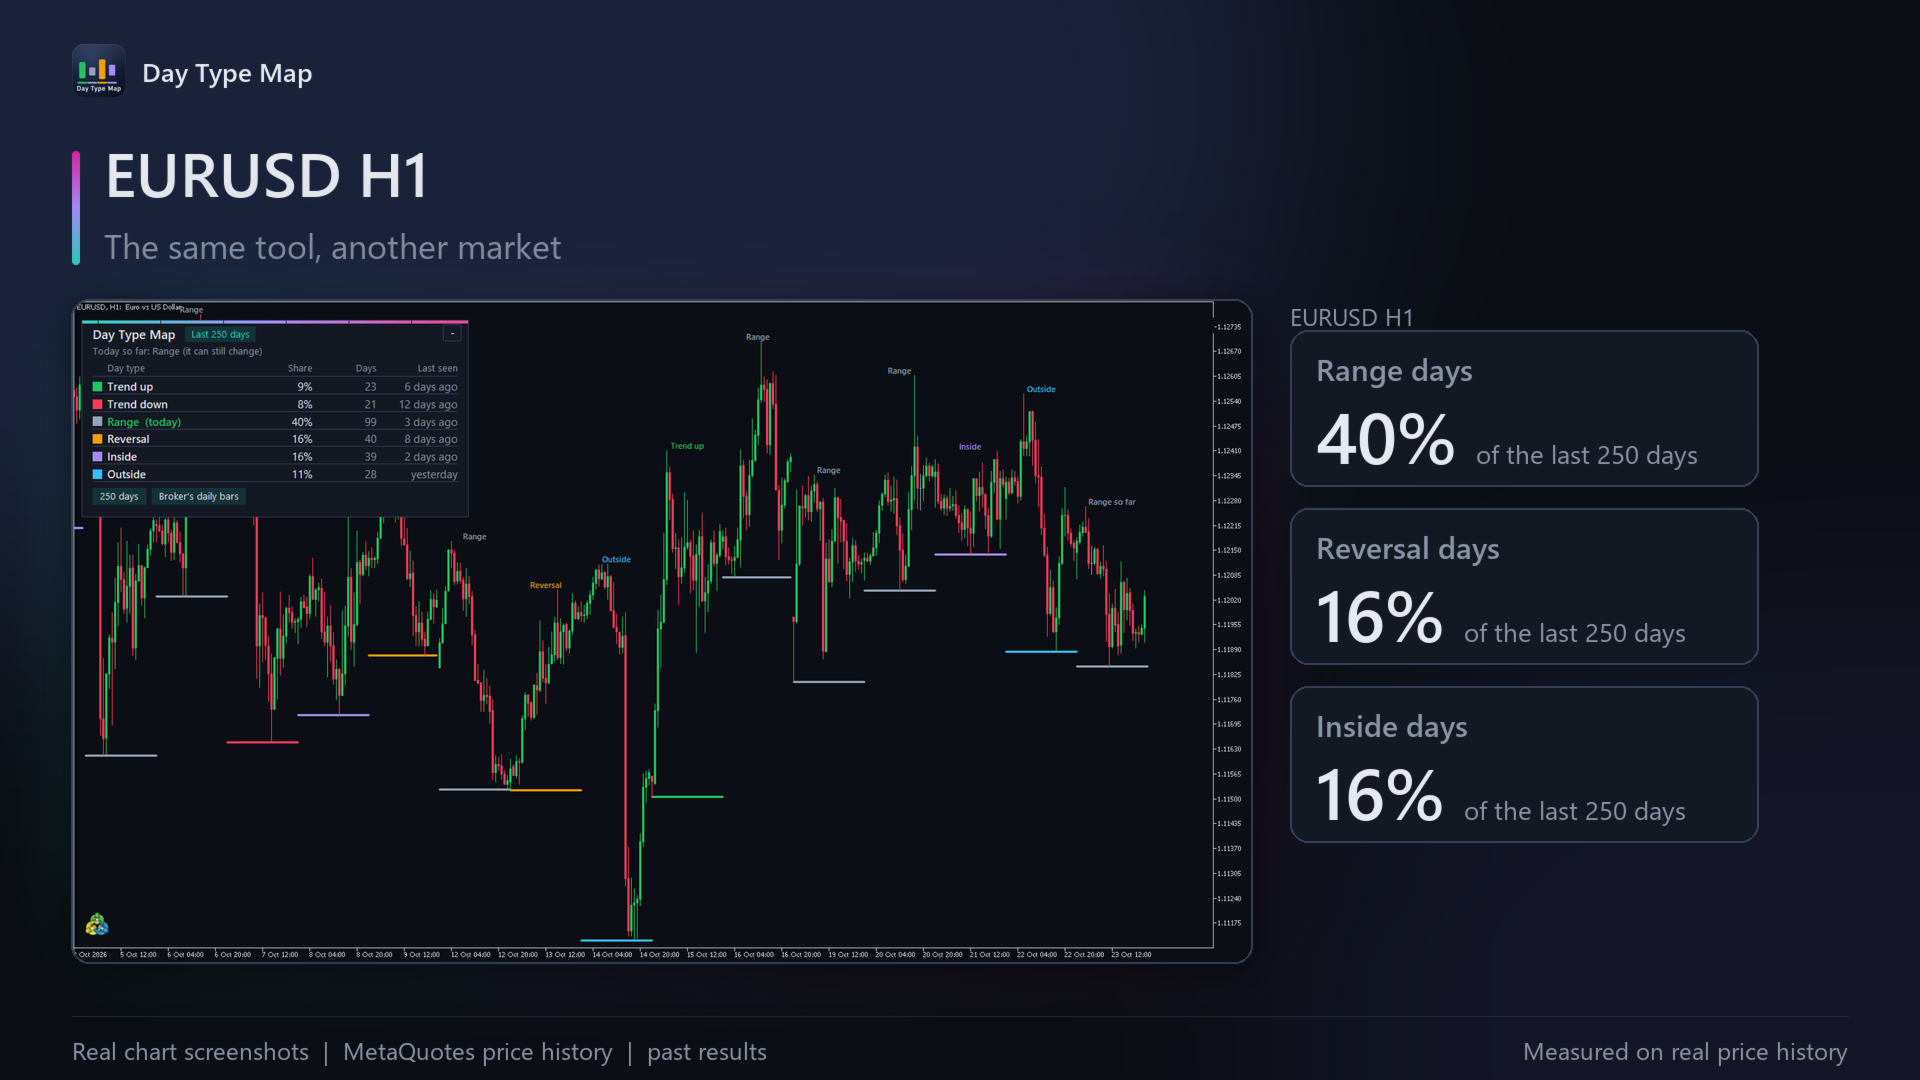
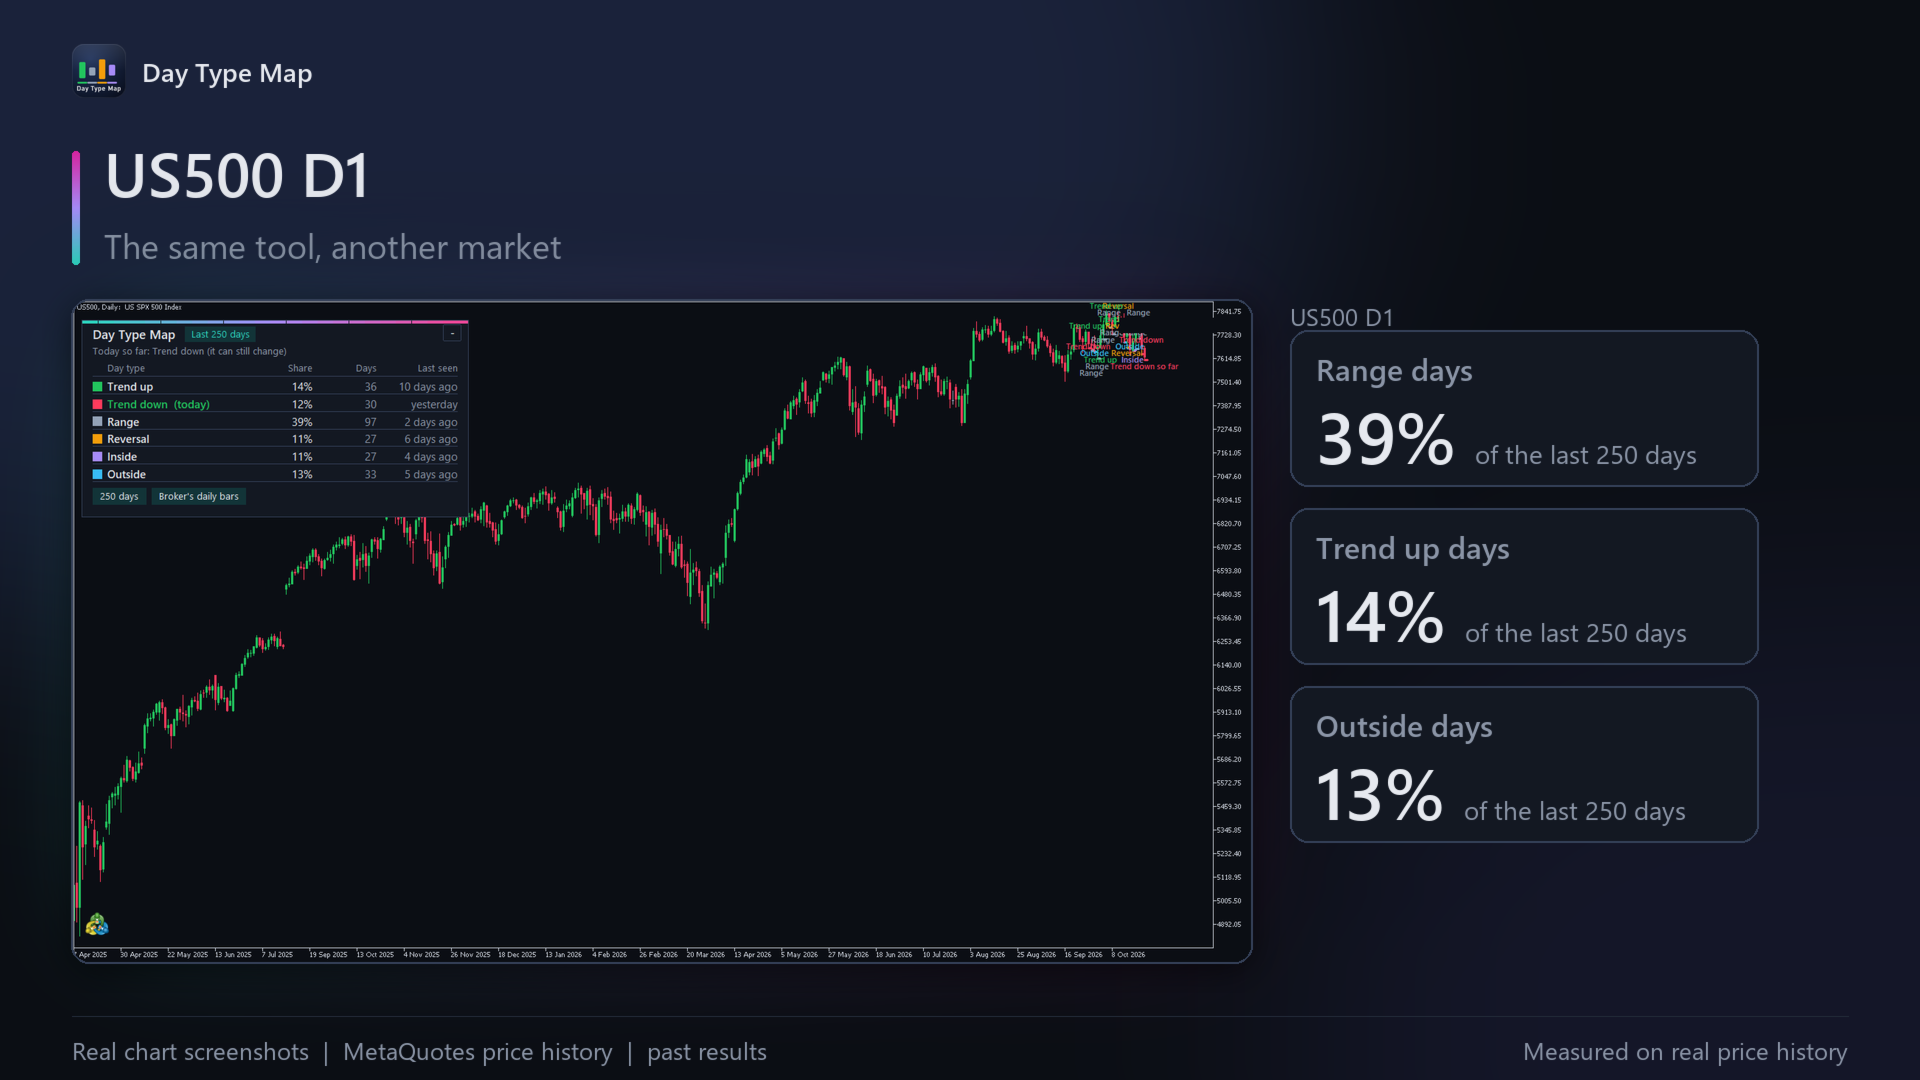
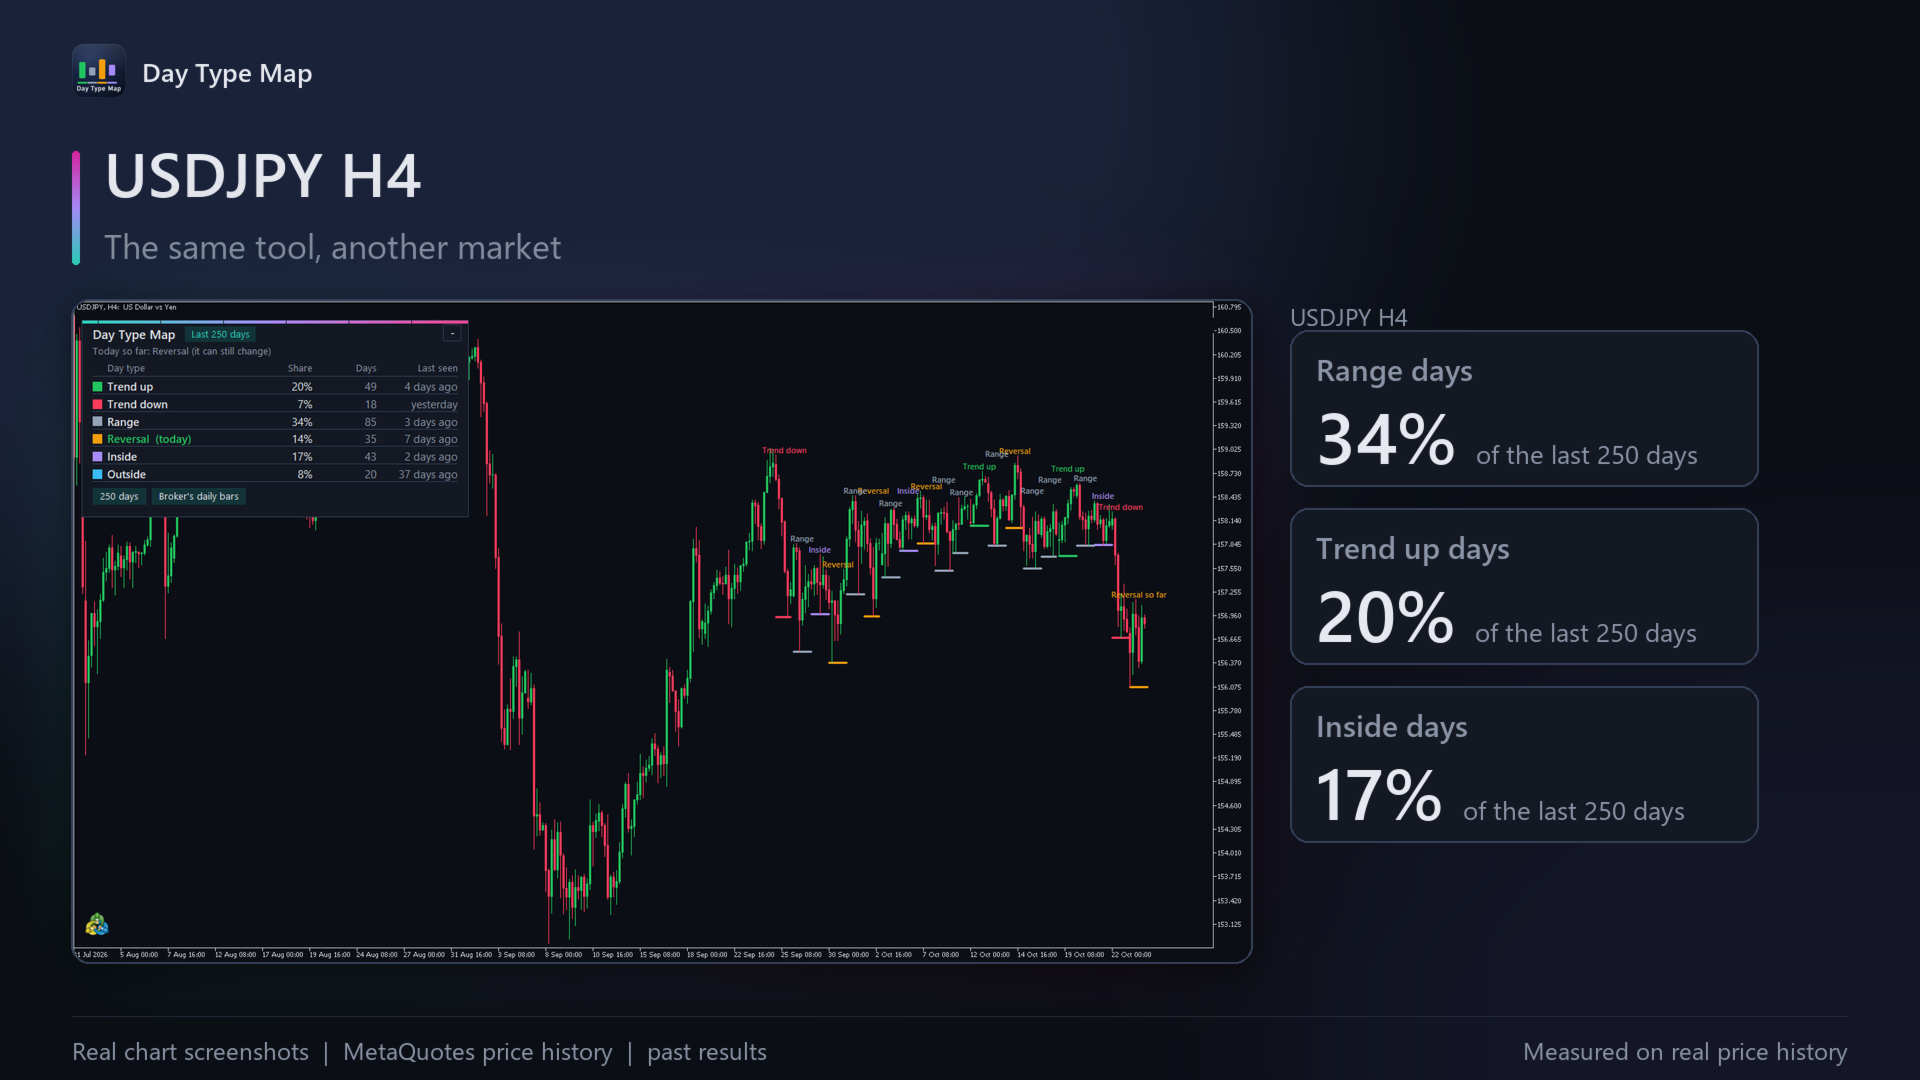
Over the last 250 days, range days were 32% of days on gold, 39% on US500, 40% on EURUSD and 34% on USDJPY; trend-up days were 17%, 14%, 9% and 20%. These describe past days, not the future: a day's type is only known when the day has closed, and today's can change until then.
Recommended use
Any symbol with at least 20 days of daily history, on any timeframe up to daily, where the days are marked. Typical uses: knowing what kind of day is unfolding, seeing how often this symbol trends or ranges, and reviewing recent days at a glance.
Inputs
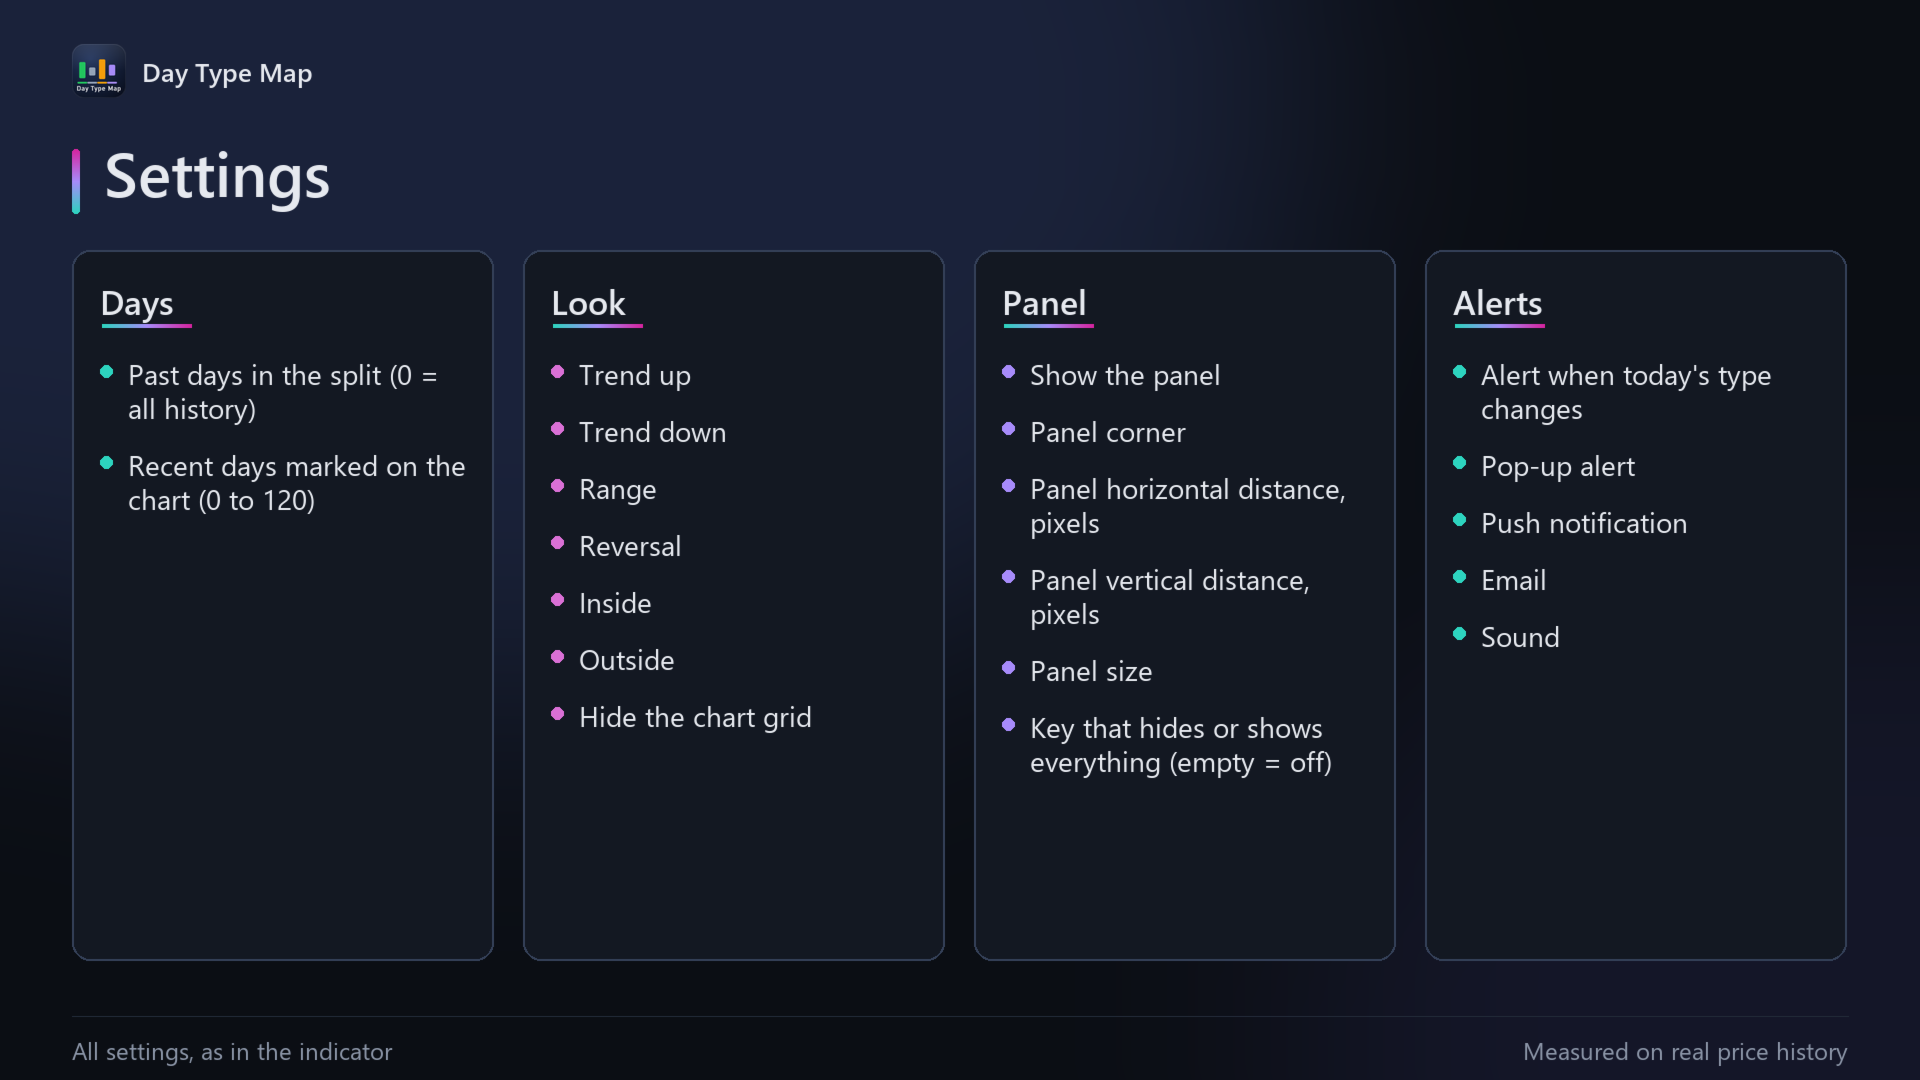
- Past days in the split: 250 by default; 0 uses all history.
- Recent days marked on the chart: 20 by default (0 to 120).
- Colours of the six day types.
- Panel: show or hide, any chart corner, distance from the edges in pixels, and size (small, normal, large). One key (H by default) hides or shows everything the indicator draws.
- Alert when today's type changes; pop-up, push notification, email and sound, each on or off. Off by default.
- Hide the chart grid: on by default.
Risk notice
Trading forex, metals, indices and other leveraged products carries a high risk of loss. Day Type Map is an analysis tool: it does not give investment advice or trading recommendations, and it does not guarantee any result. All figures describe past data, and past behaviour does not guarantee future behaviour. You are responsible for your own trading decisions.
Support
Questions? Message me through MQL5 chat.
Useful? A short review helps other traders find it.
A full guide with pictures: https://www.mql5.com/en/blogs/post/778437