Big Move Map

  • Indicatori
  • Anna Makwana
    Anna Makwana
    MetaTrader tools and indicators that measure the odds on your own chart: how often levels were reached, how far days and sessions usually run, and what followed past signals. Every figure comes from the symbol’s own price history and uses closed bars only, so nothing repaints. Questions are welcome
  • Versione: 1.0

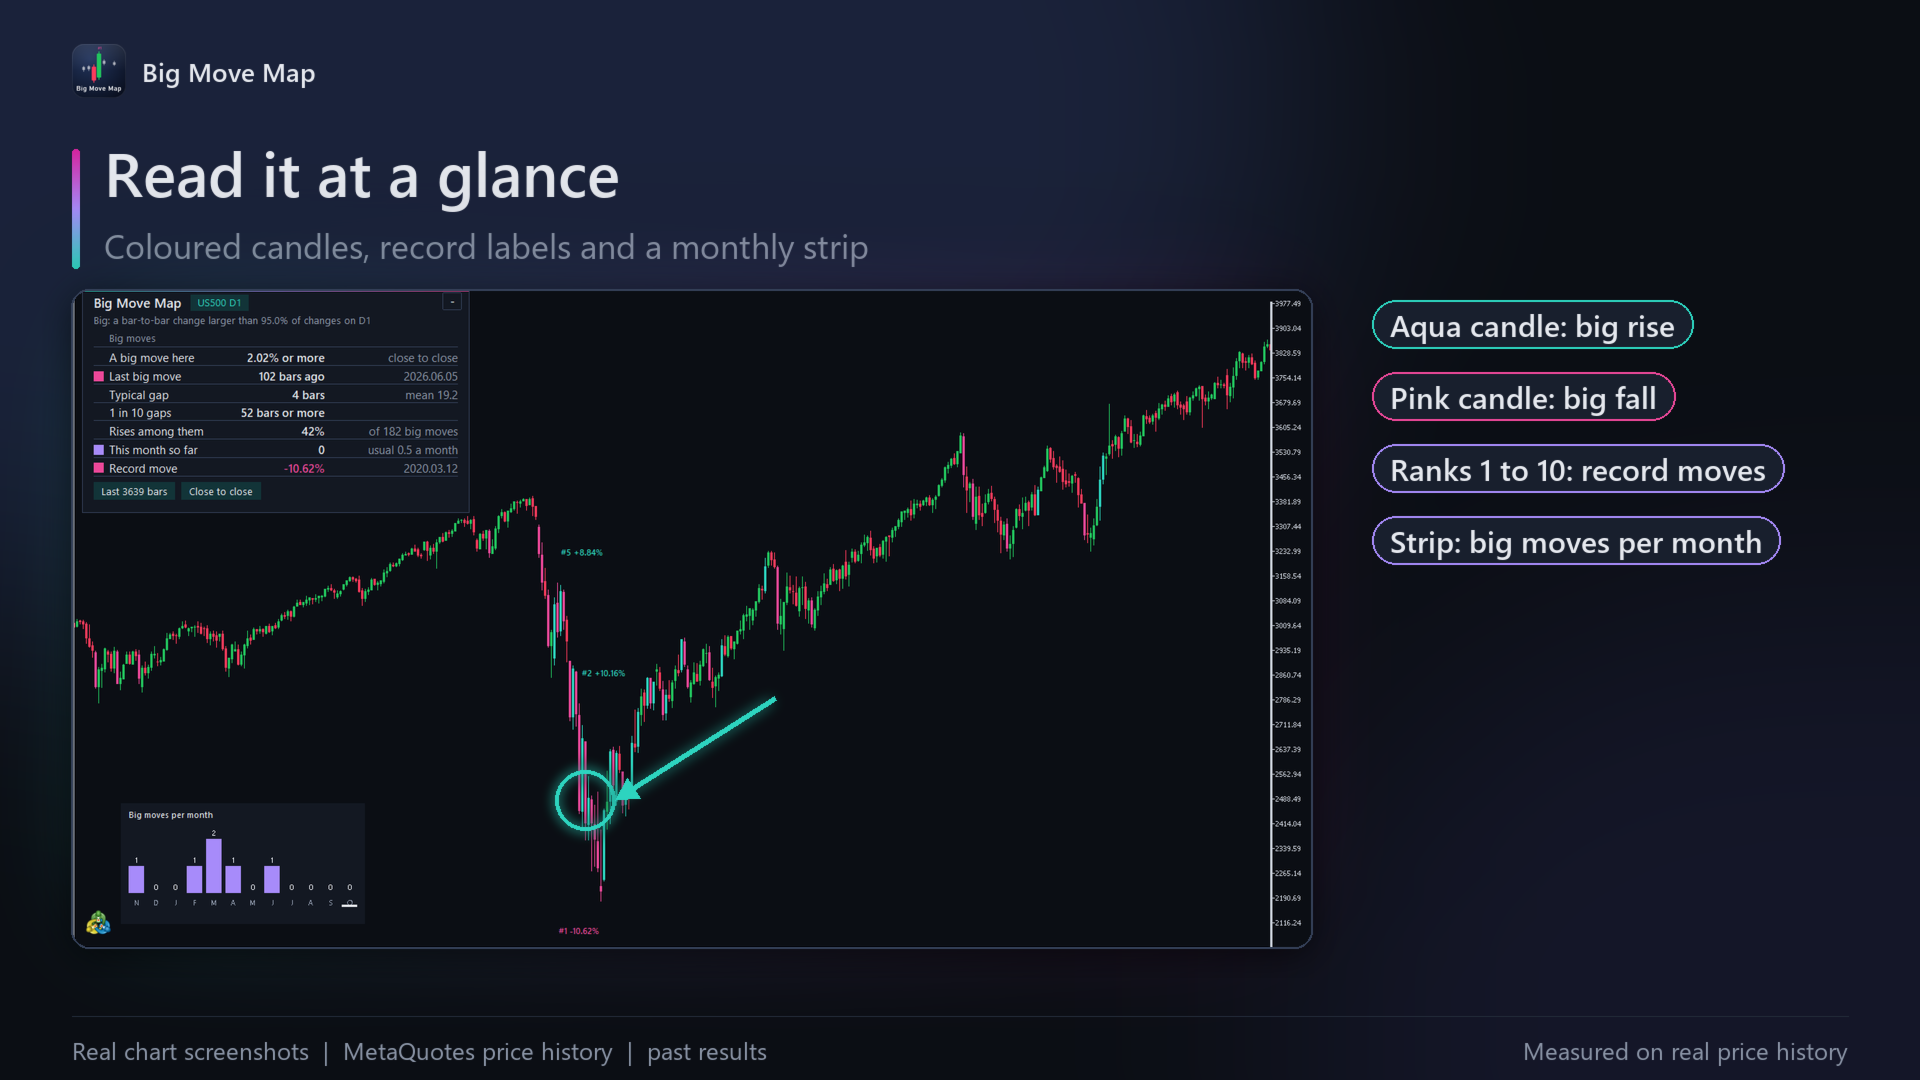
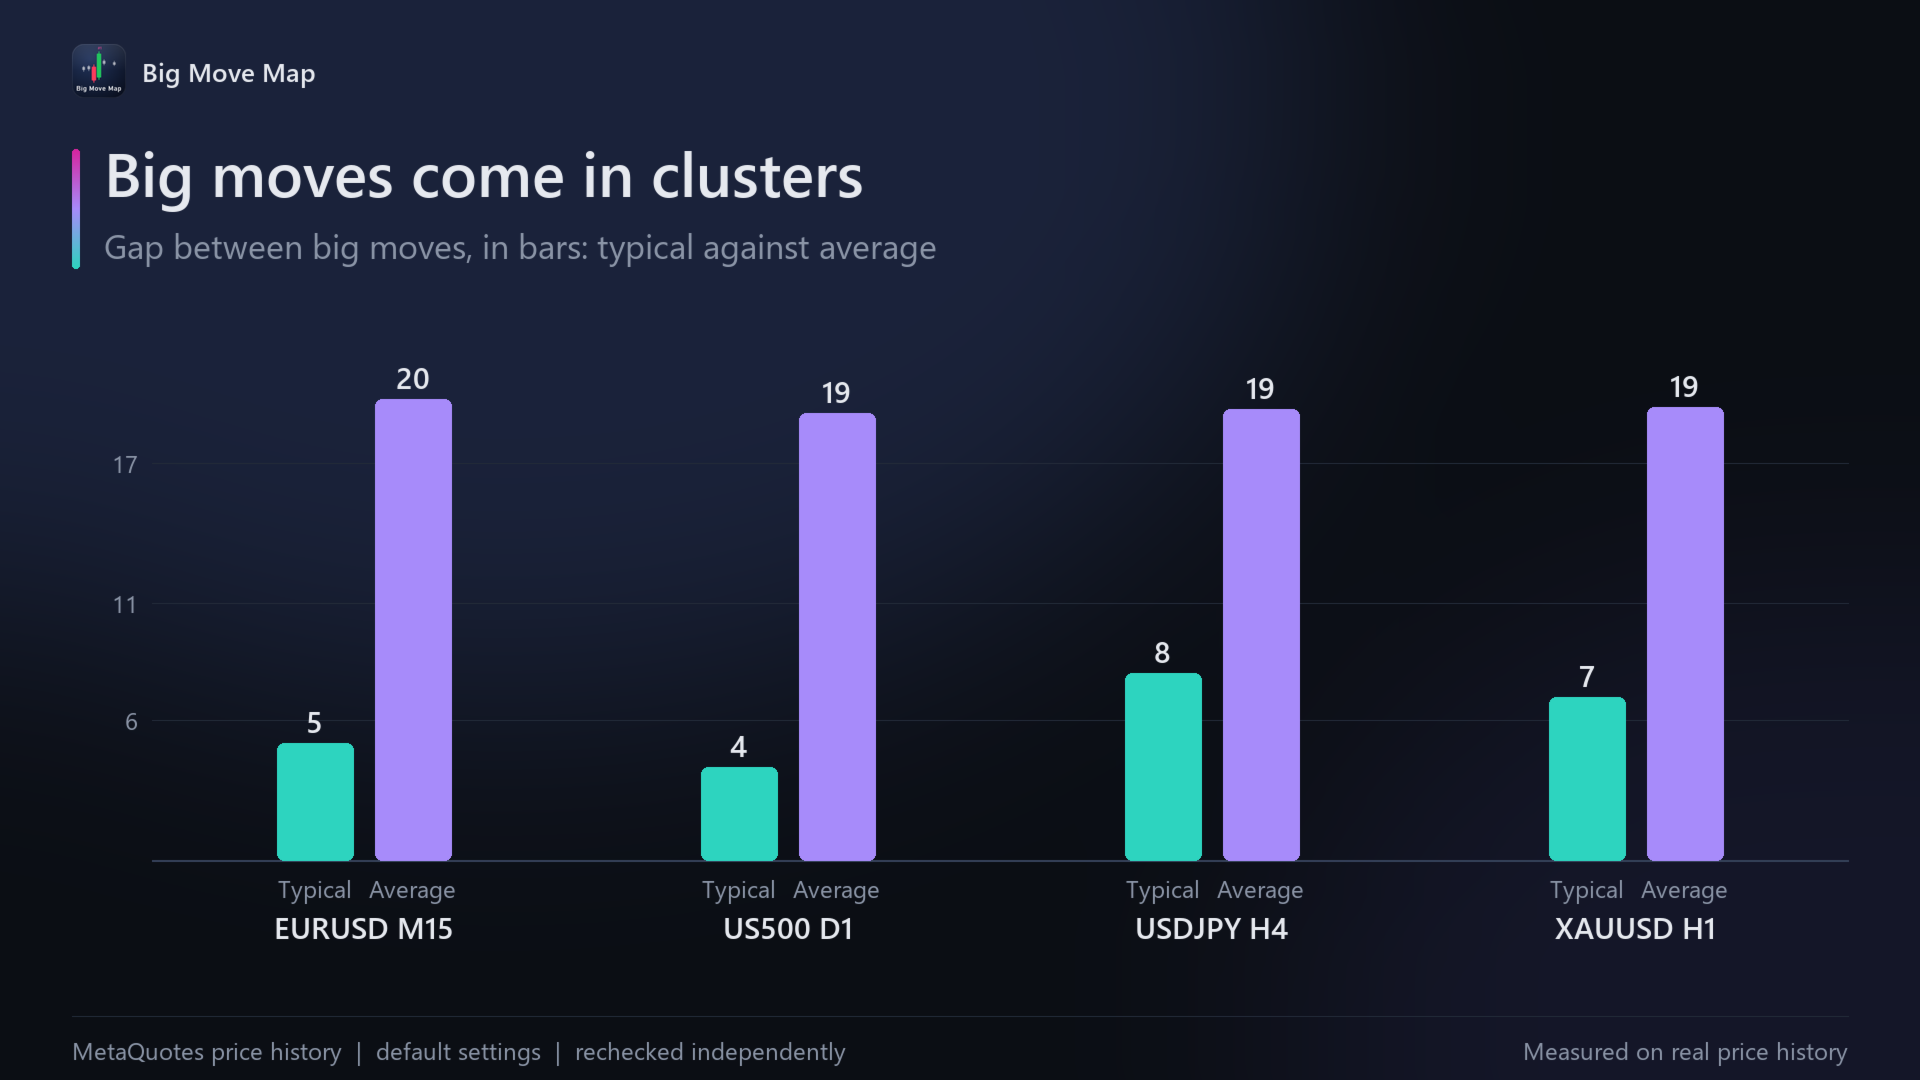
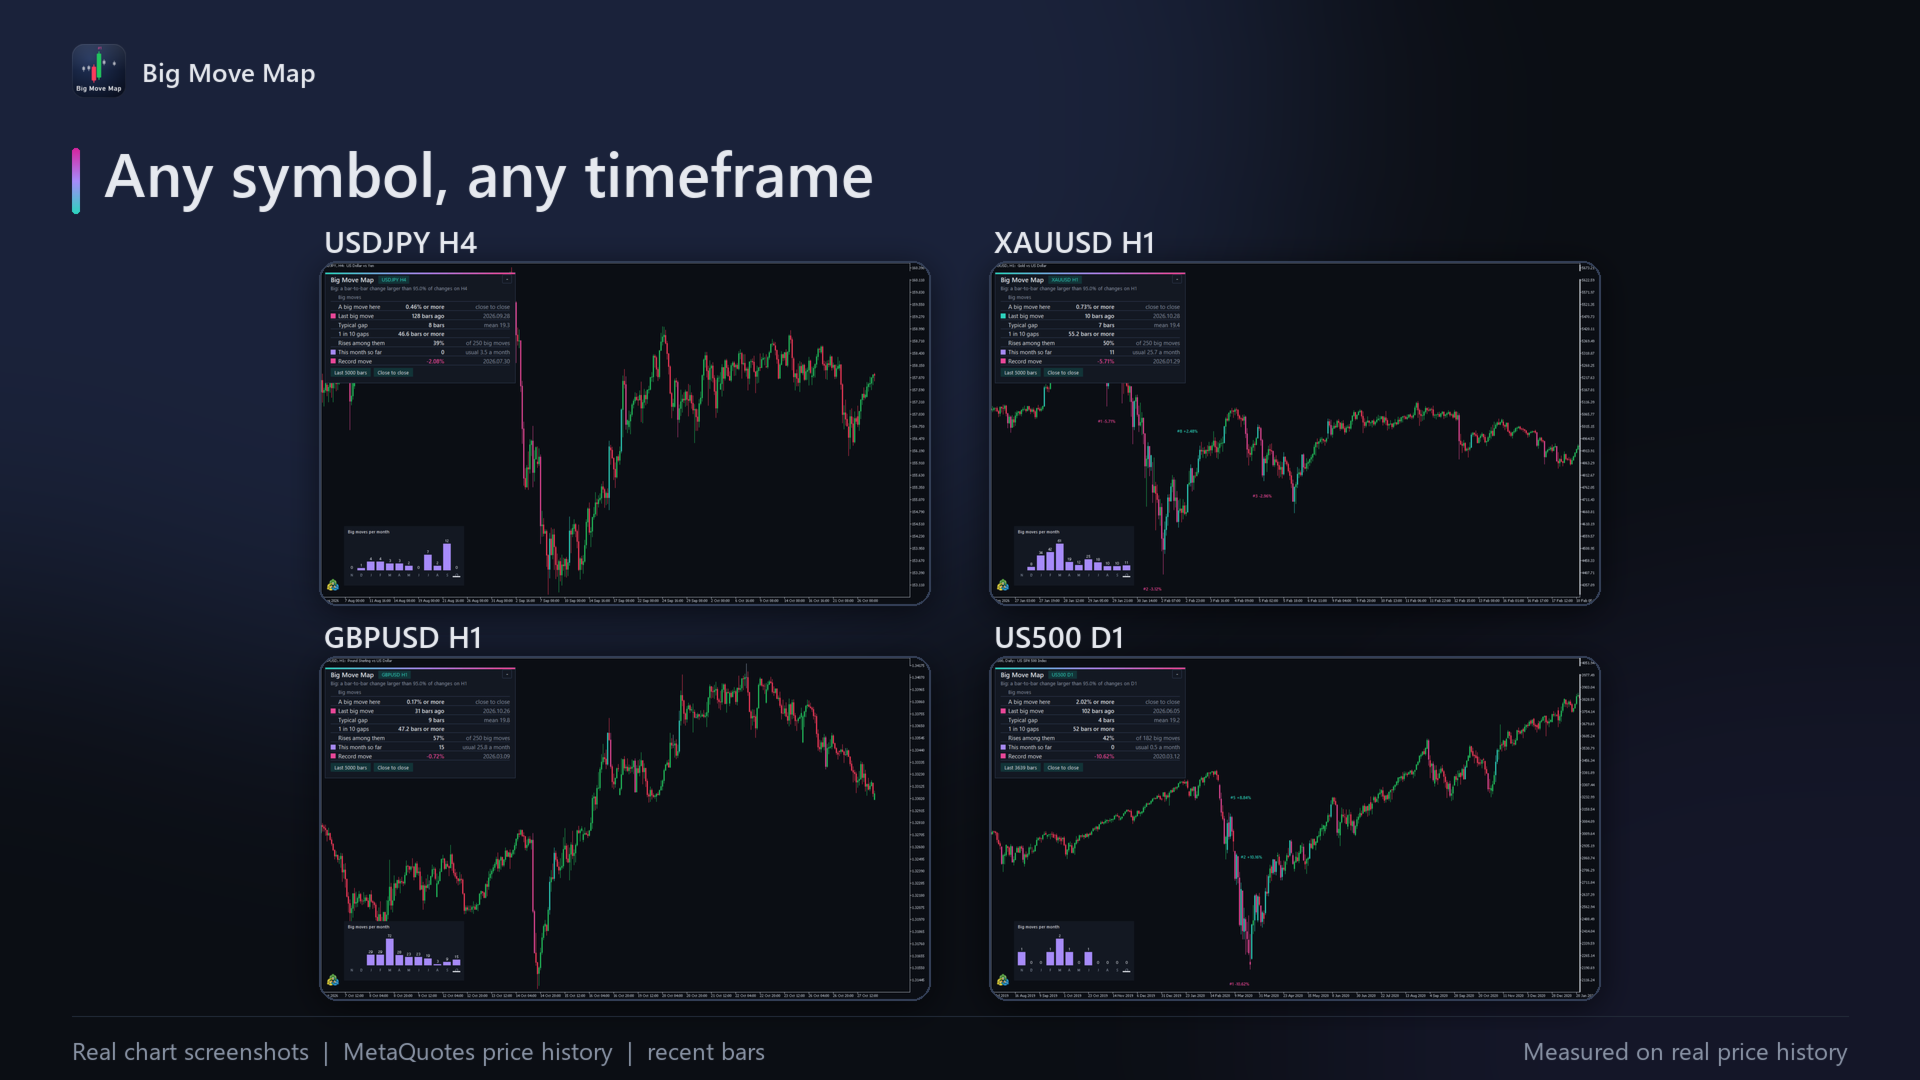
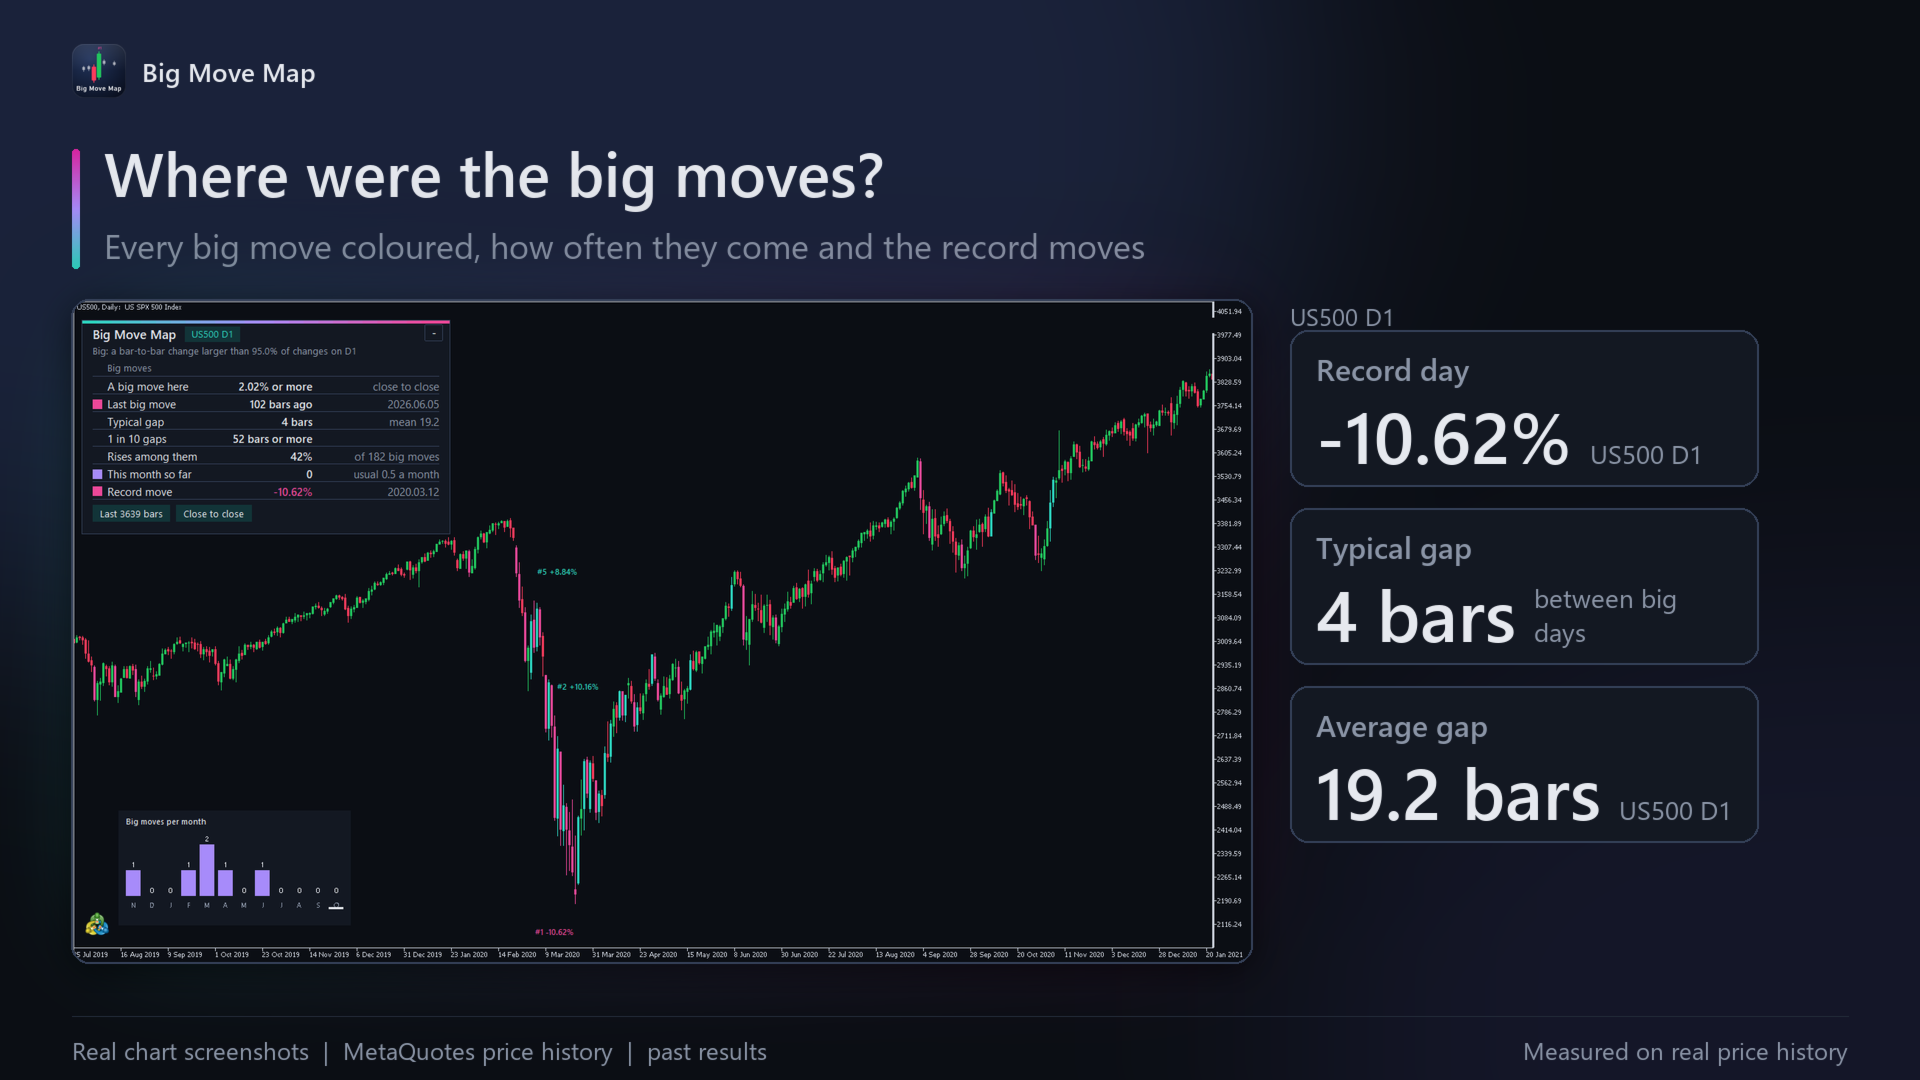
Big Move Map colours every big move on your chart and counts them: how often big moves come on this symbol, how many bars since the last one, the usual gap between them, big moves per month and the 10 record moves with their dates. Big moves come in clusters: on US500 D1, half of the big days came within 4 days of the one before, while the average gap was 19 days. The record day since 2012 was -10.62% on 12 March 2020. Closed bars only, so it never repaints. Every number is verified against a separate implementation before each release.

What it does

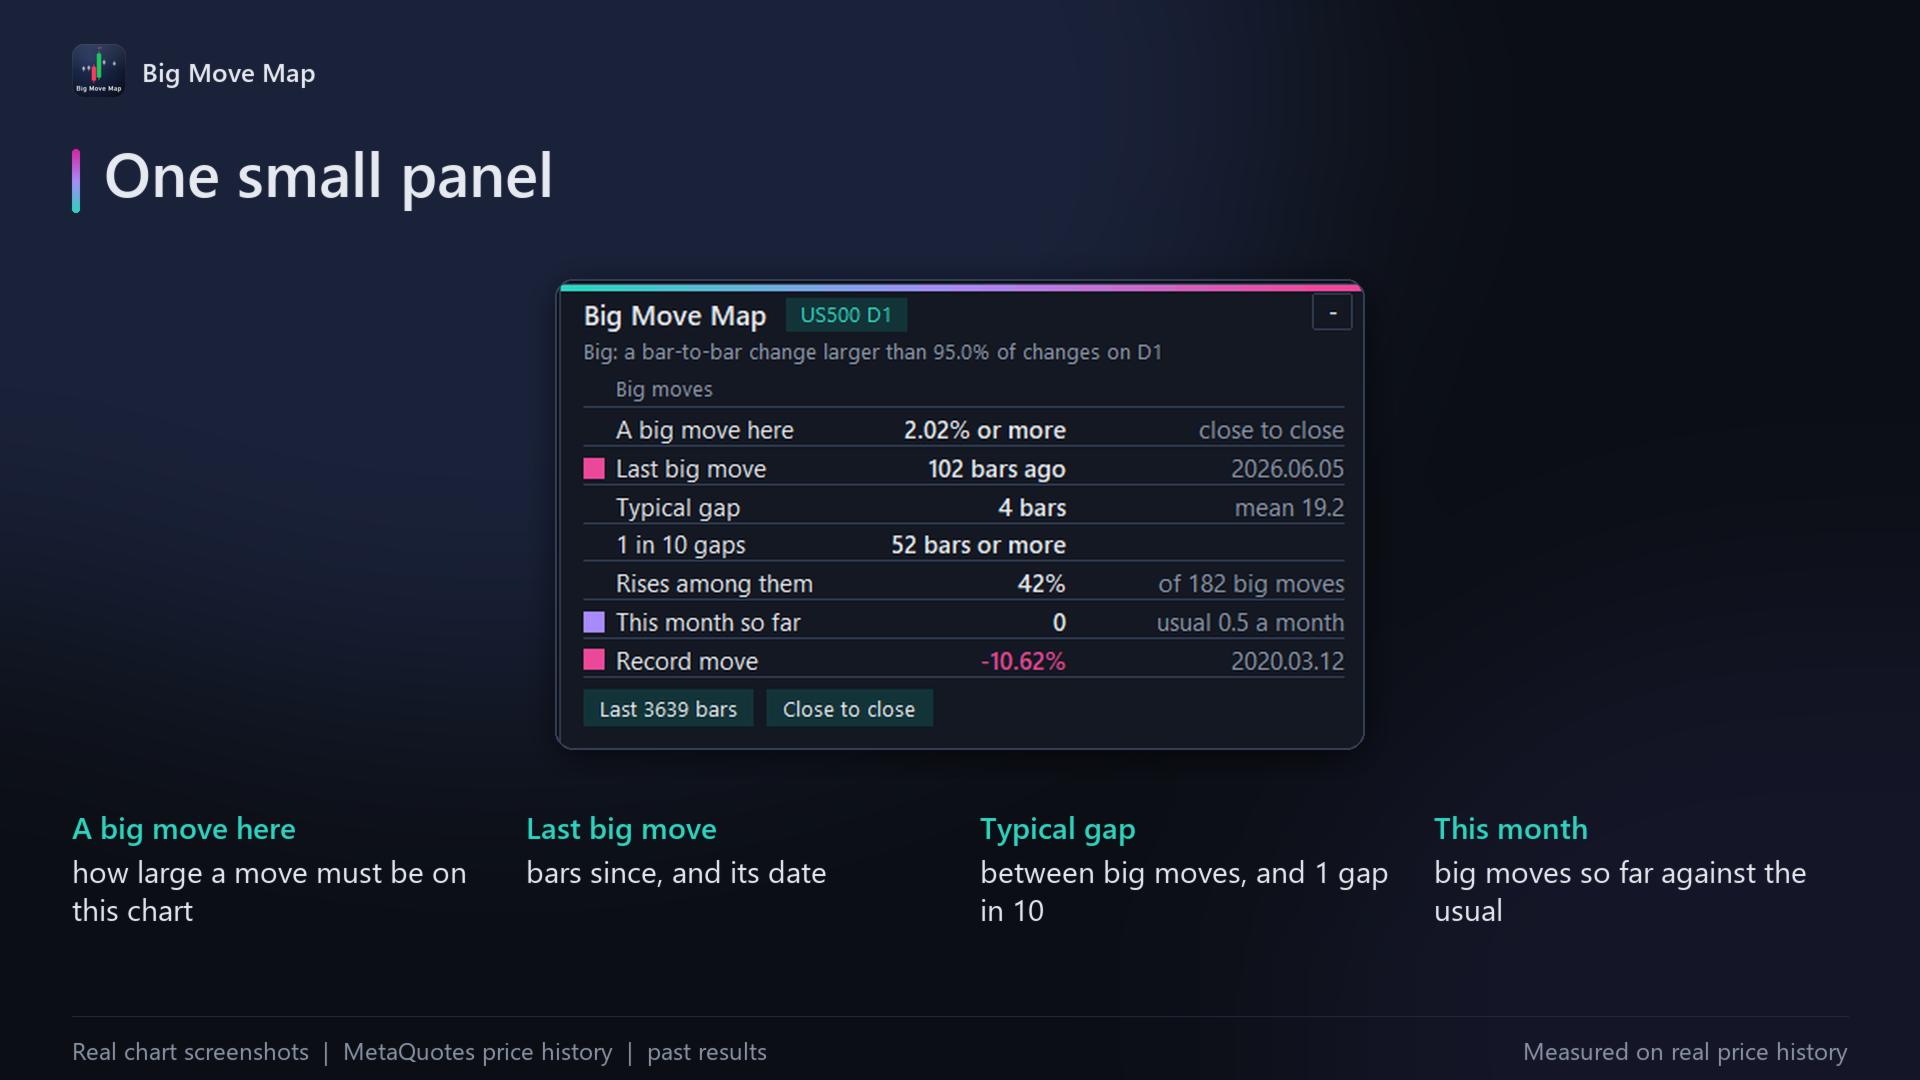
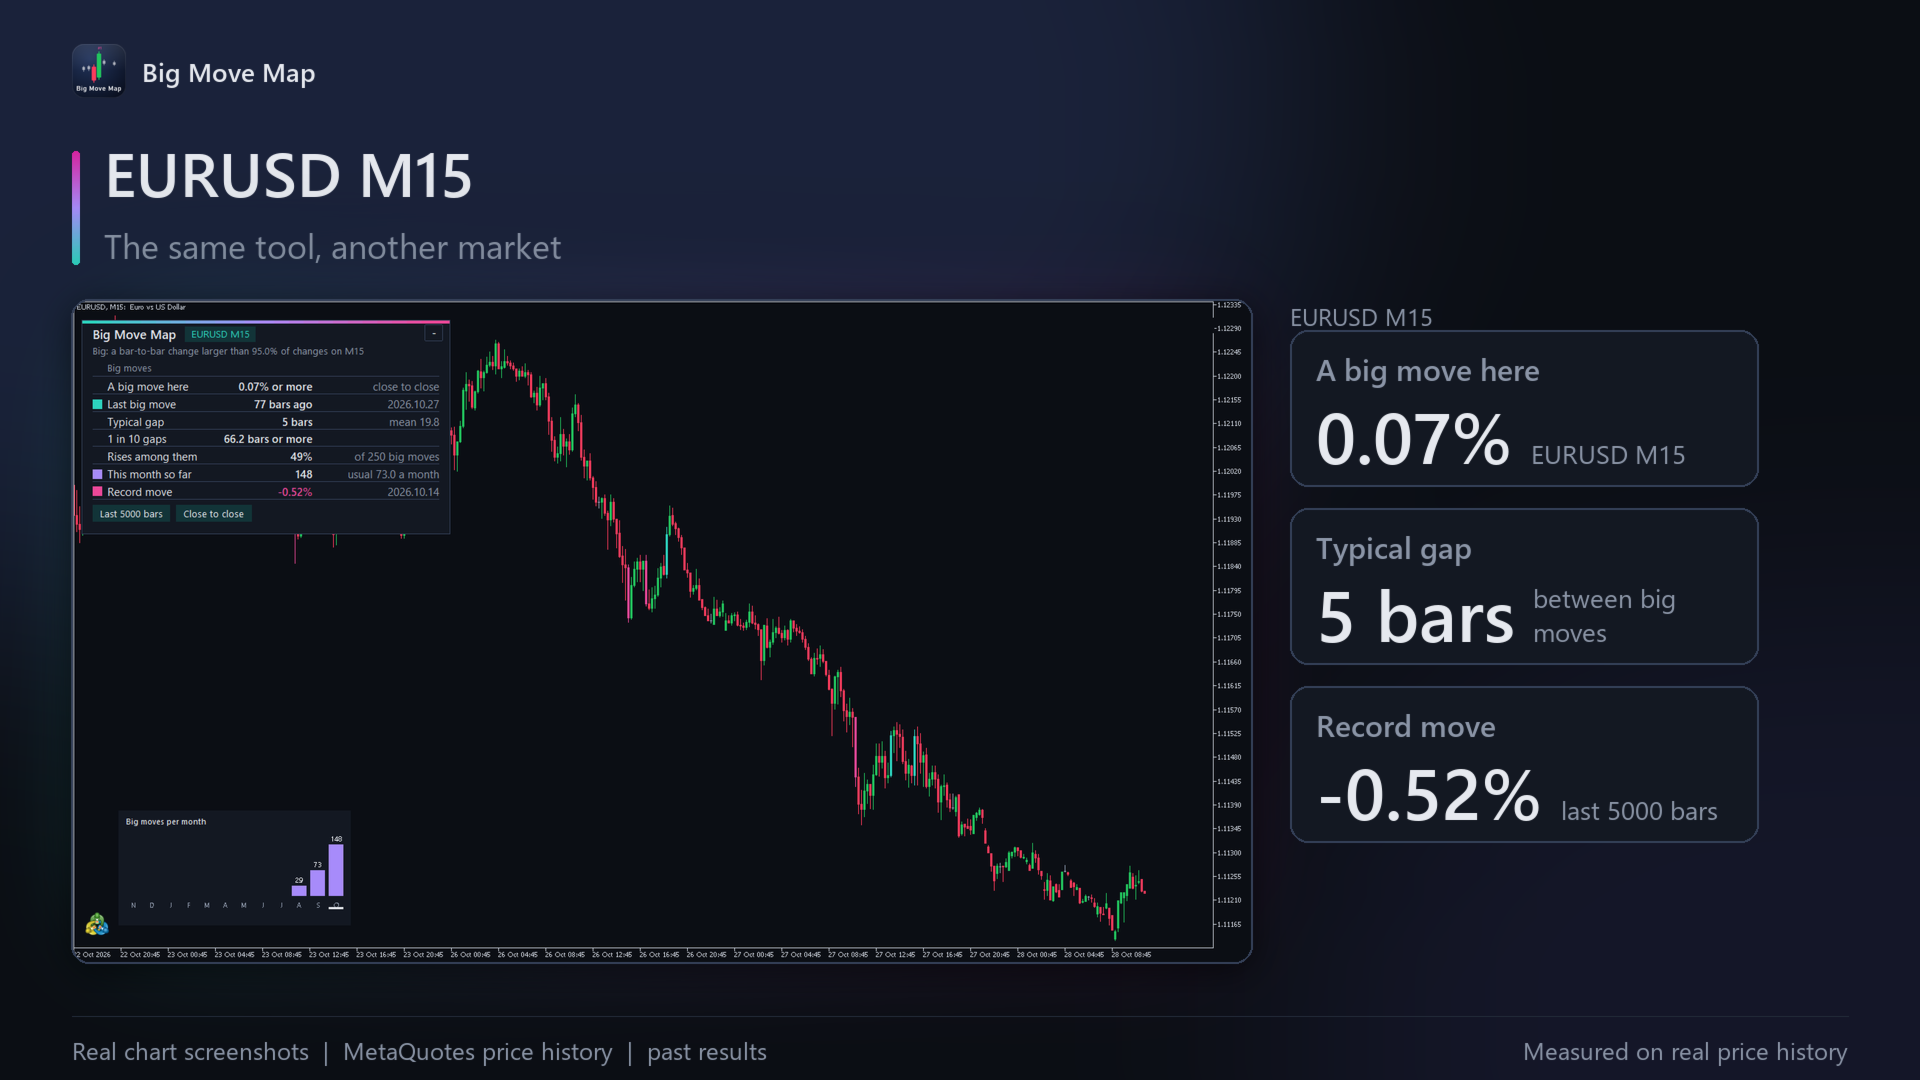
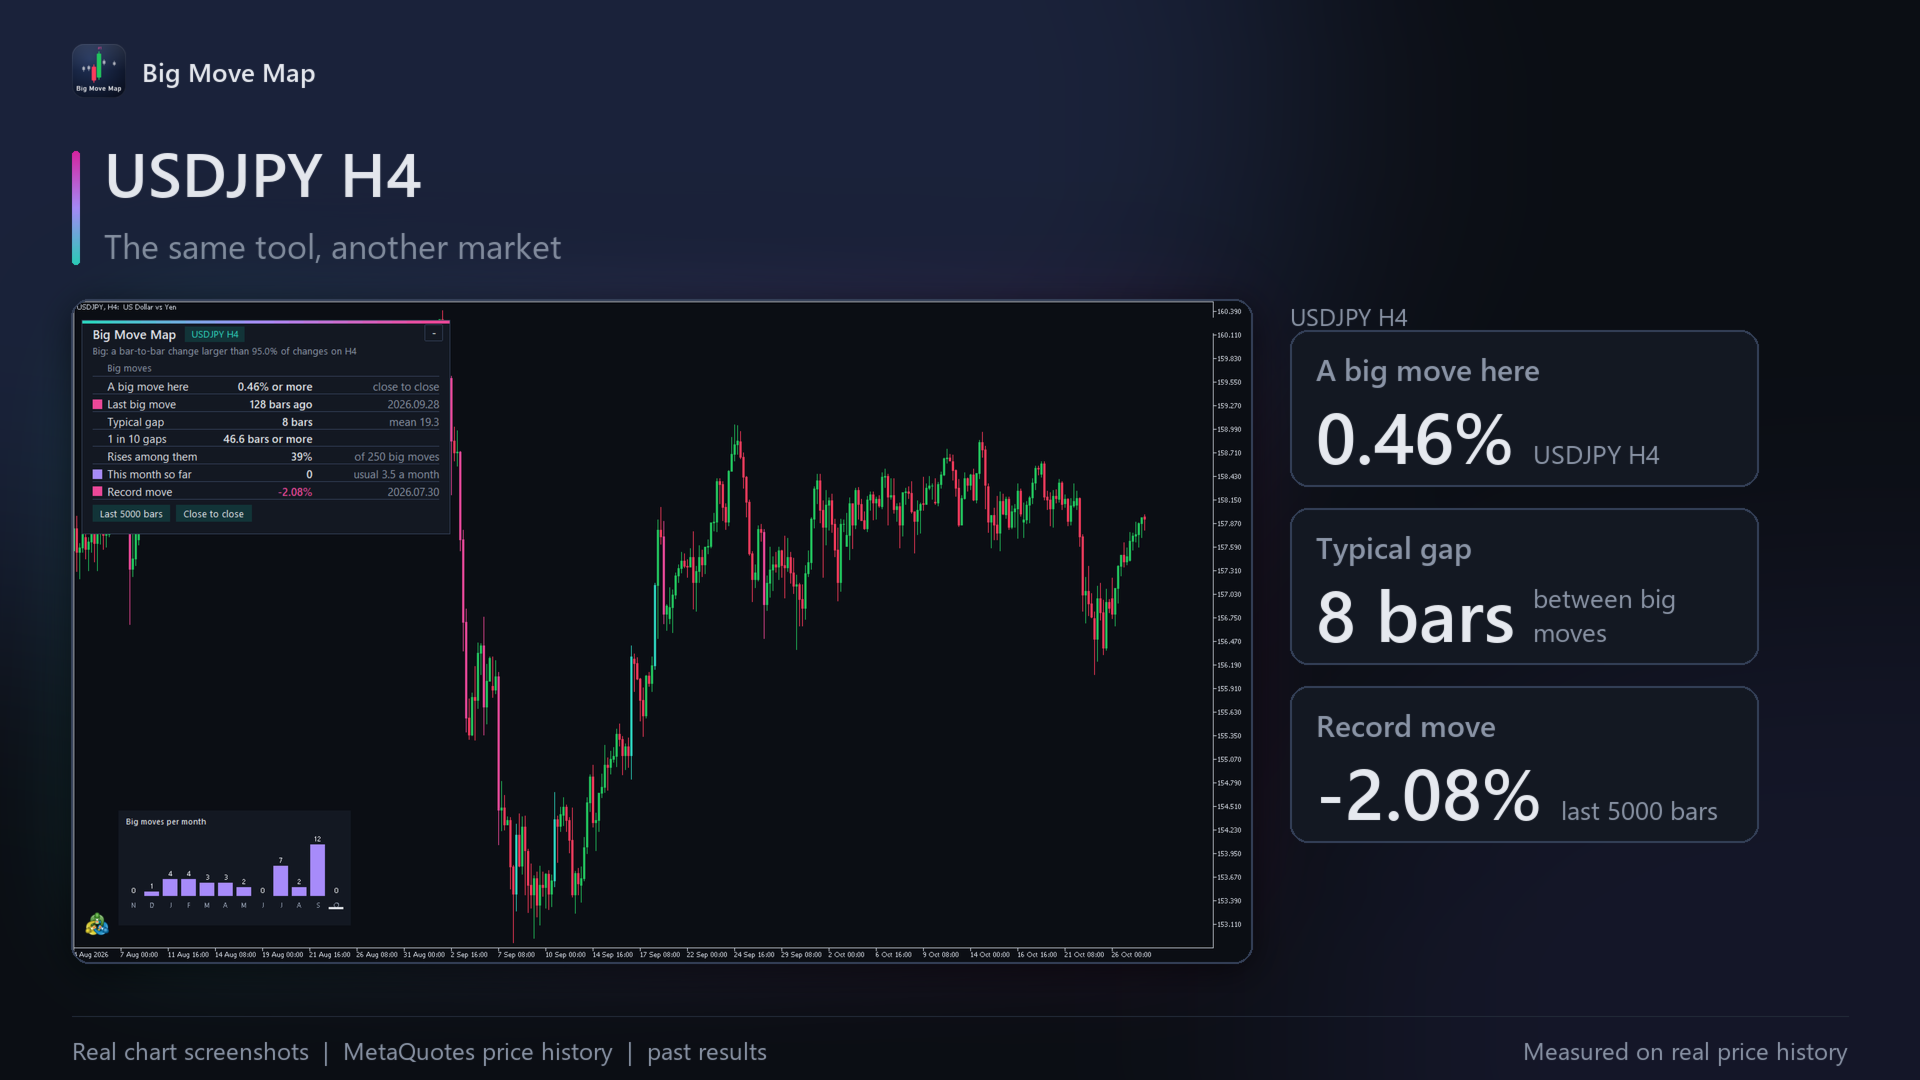
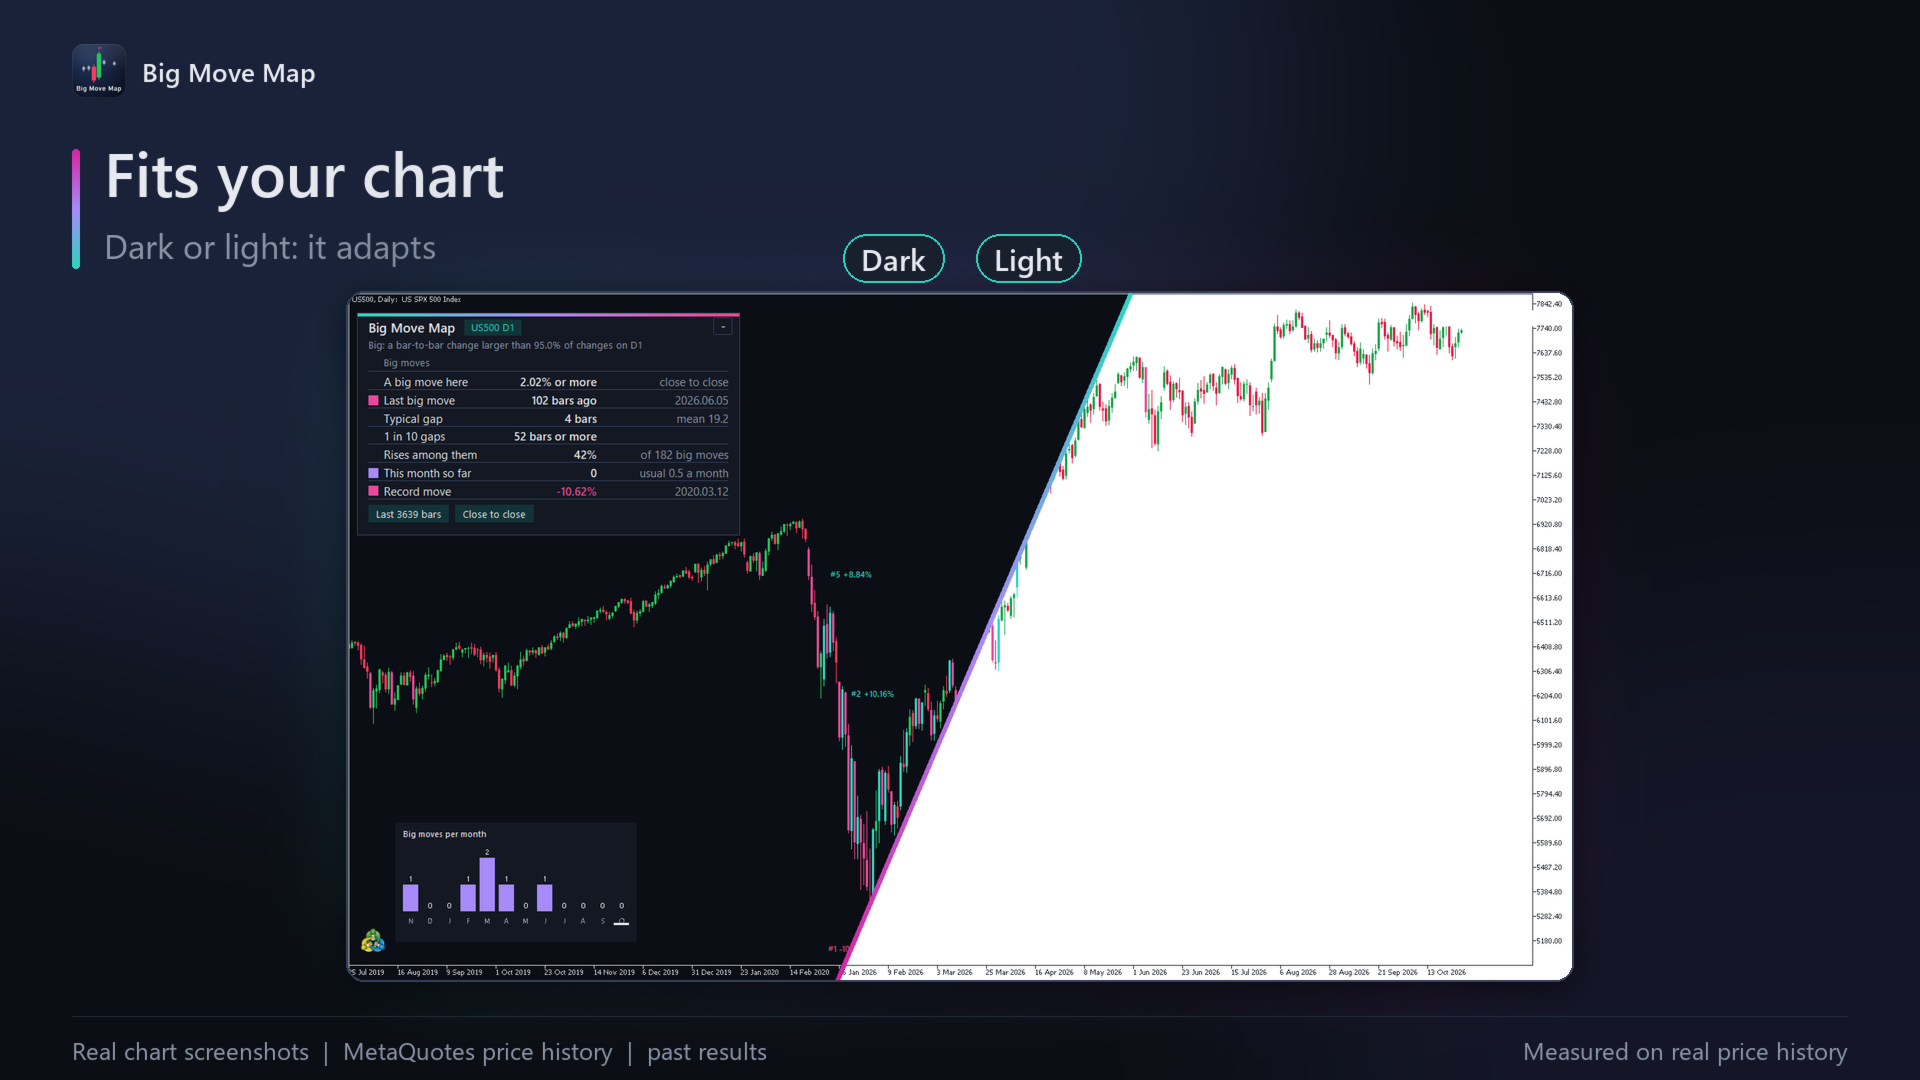
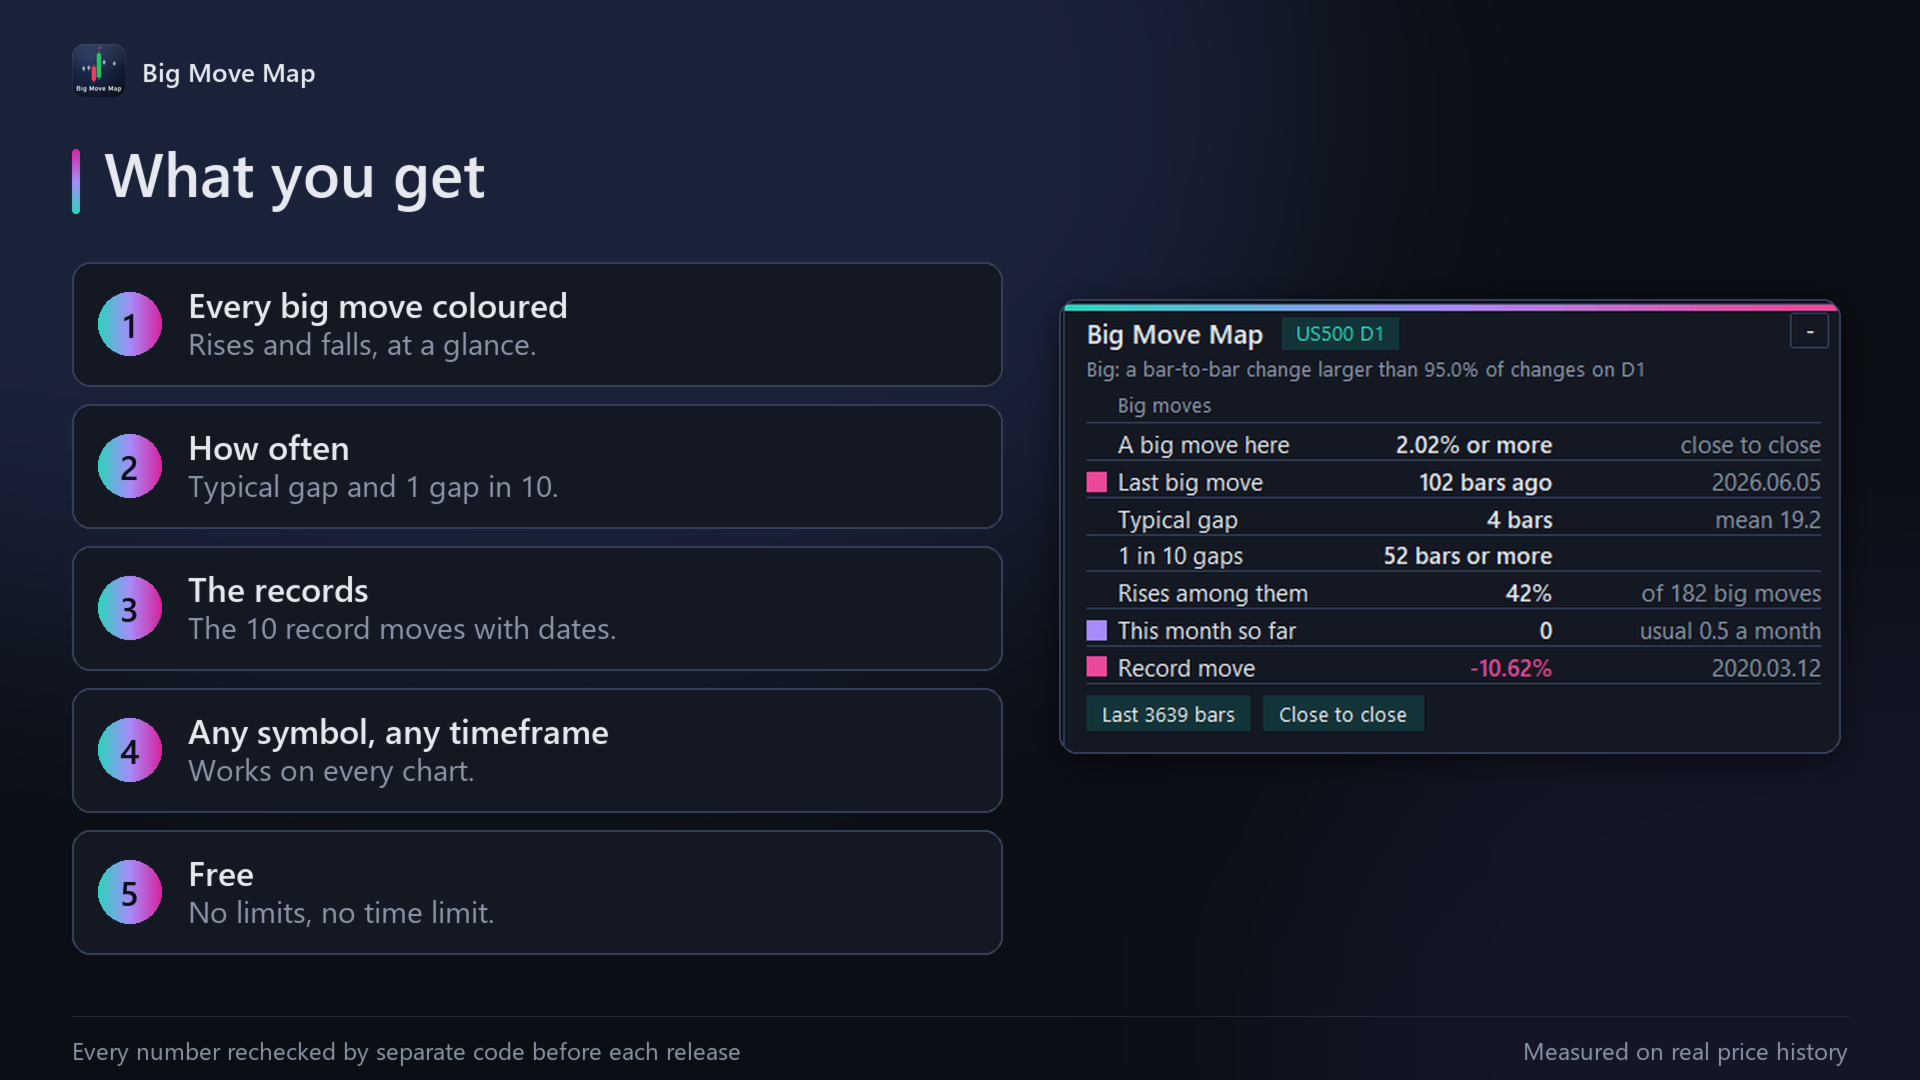
Every candle with a big move is redrawn in colour on the price chart: aqua for a big rise, pink for a big fall. The 10 record moves are labelled with their rank and size. A small panel shows how large a move must be to count as big on this chart, the bars since the last big move and its date, the typical gap between big moves and the 1-in-10 gap, the share of big moves that were rises, the big moves this month against the usual number per month, and the record move. A strip in the lower-left corner shows the big moves in each of the last 12 months.

How it works

Each candle's move is its close against the previous close, in percent. A move is big when it is larger than 95% of all moves on this symbol and timeframe (you can set 80% to 99.5%), so "big" follows each market's own history and the same setting fits gold, currencies and indices on any timeframe. The last 5000 bars are studied by default. Only finished candles count.

How it was tested

Every figure (which candles are big, the size a big move needs, the gaps, the monthly counts and the 10 records) is recomputed by a separate implementation from the same broker data and matches it to the last decimal, on gold, EURUSD, US500 and USDJPY across H1, M15, D1 and H4, at settings from 80% to 99% and several history lengths.

Results and risks

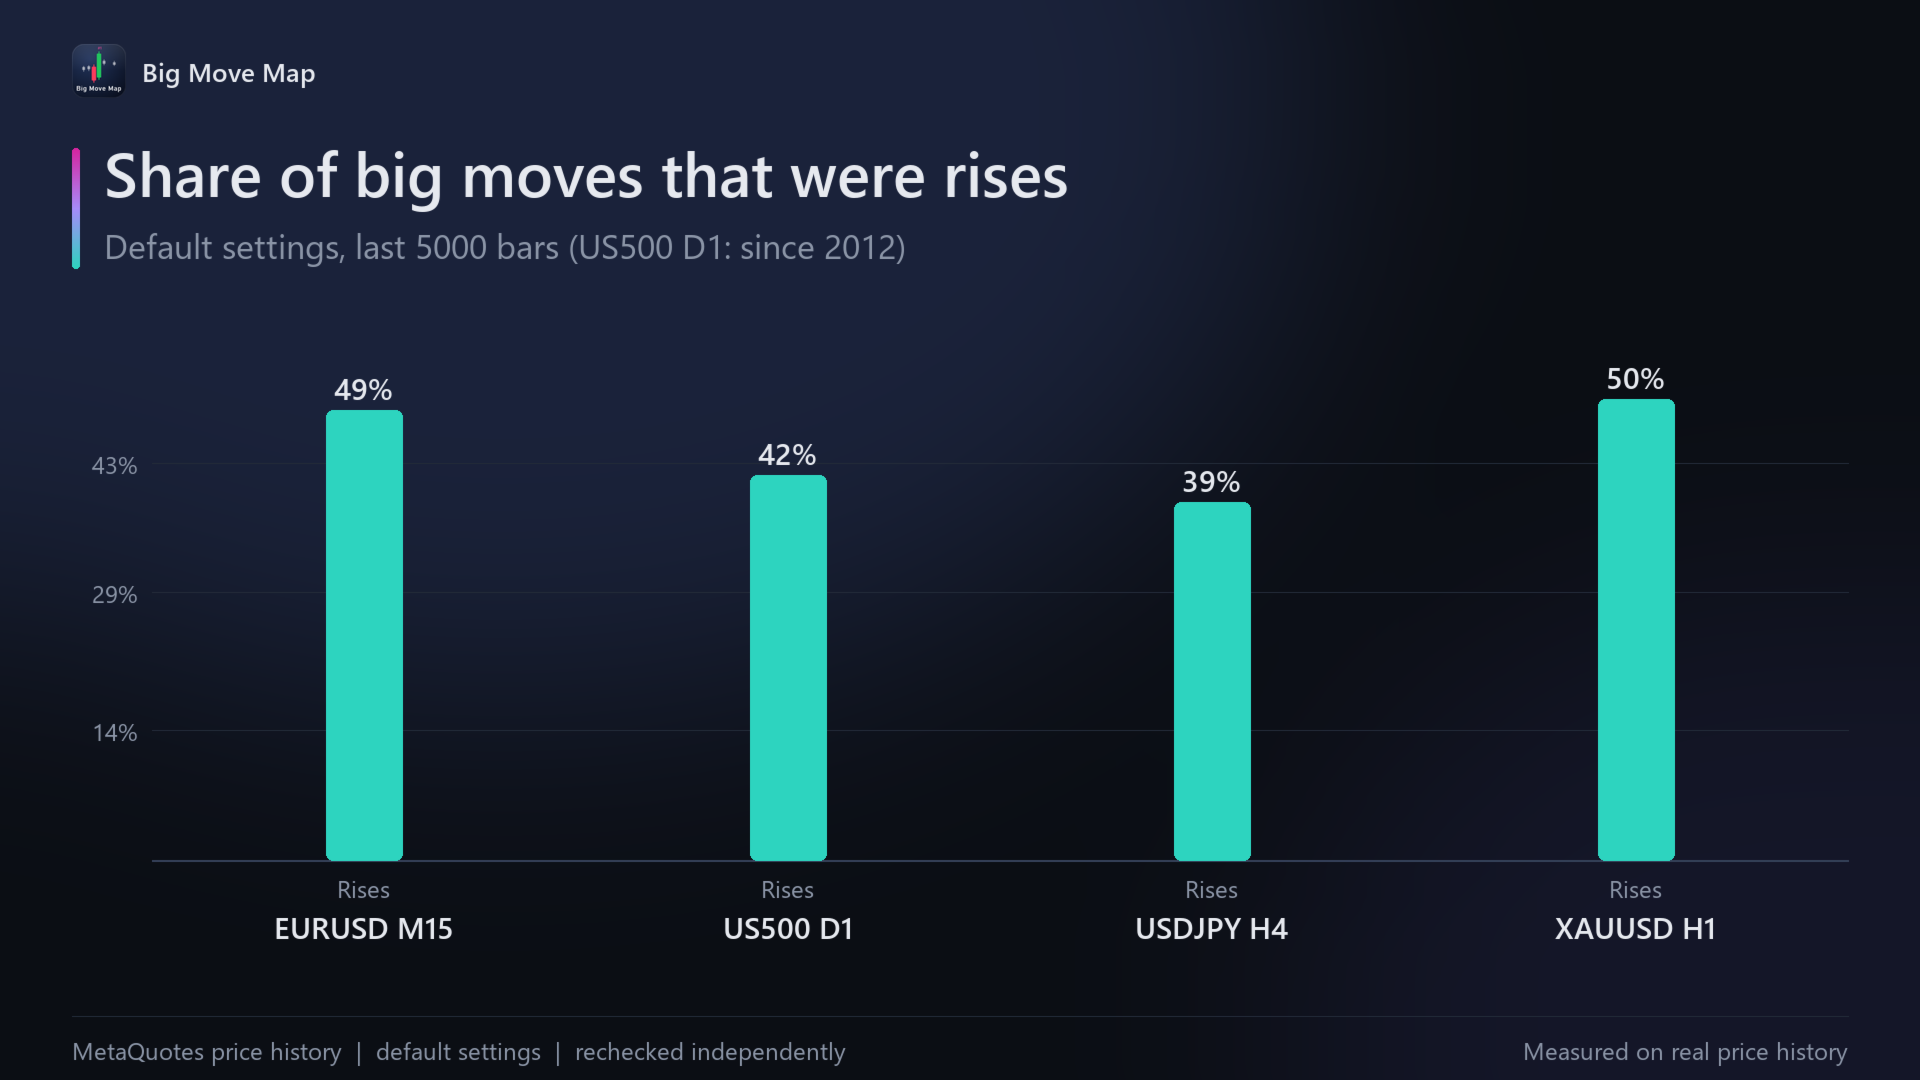
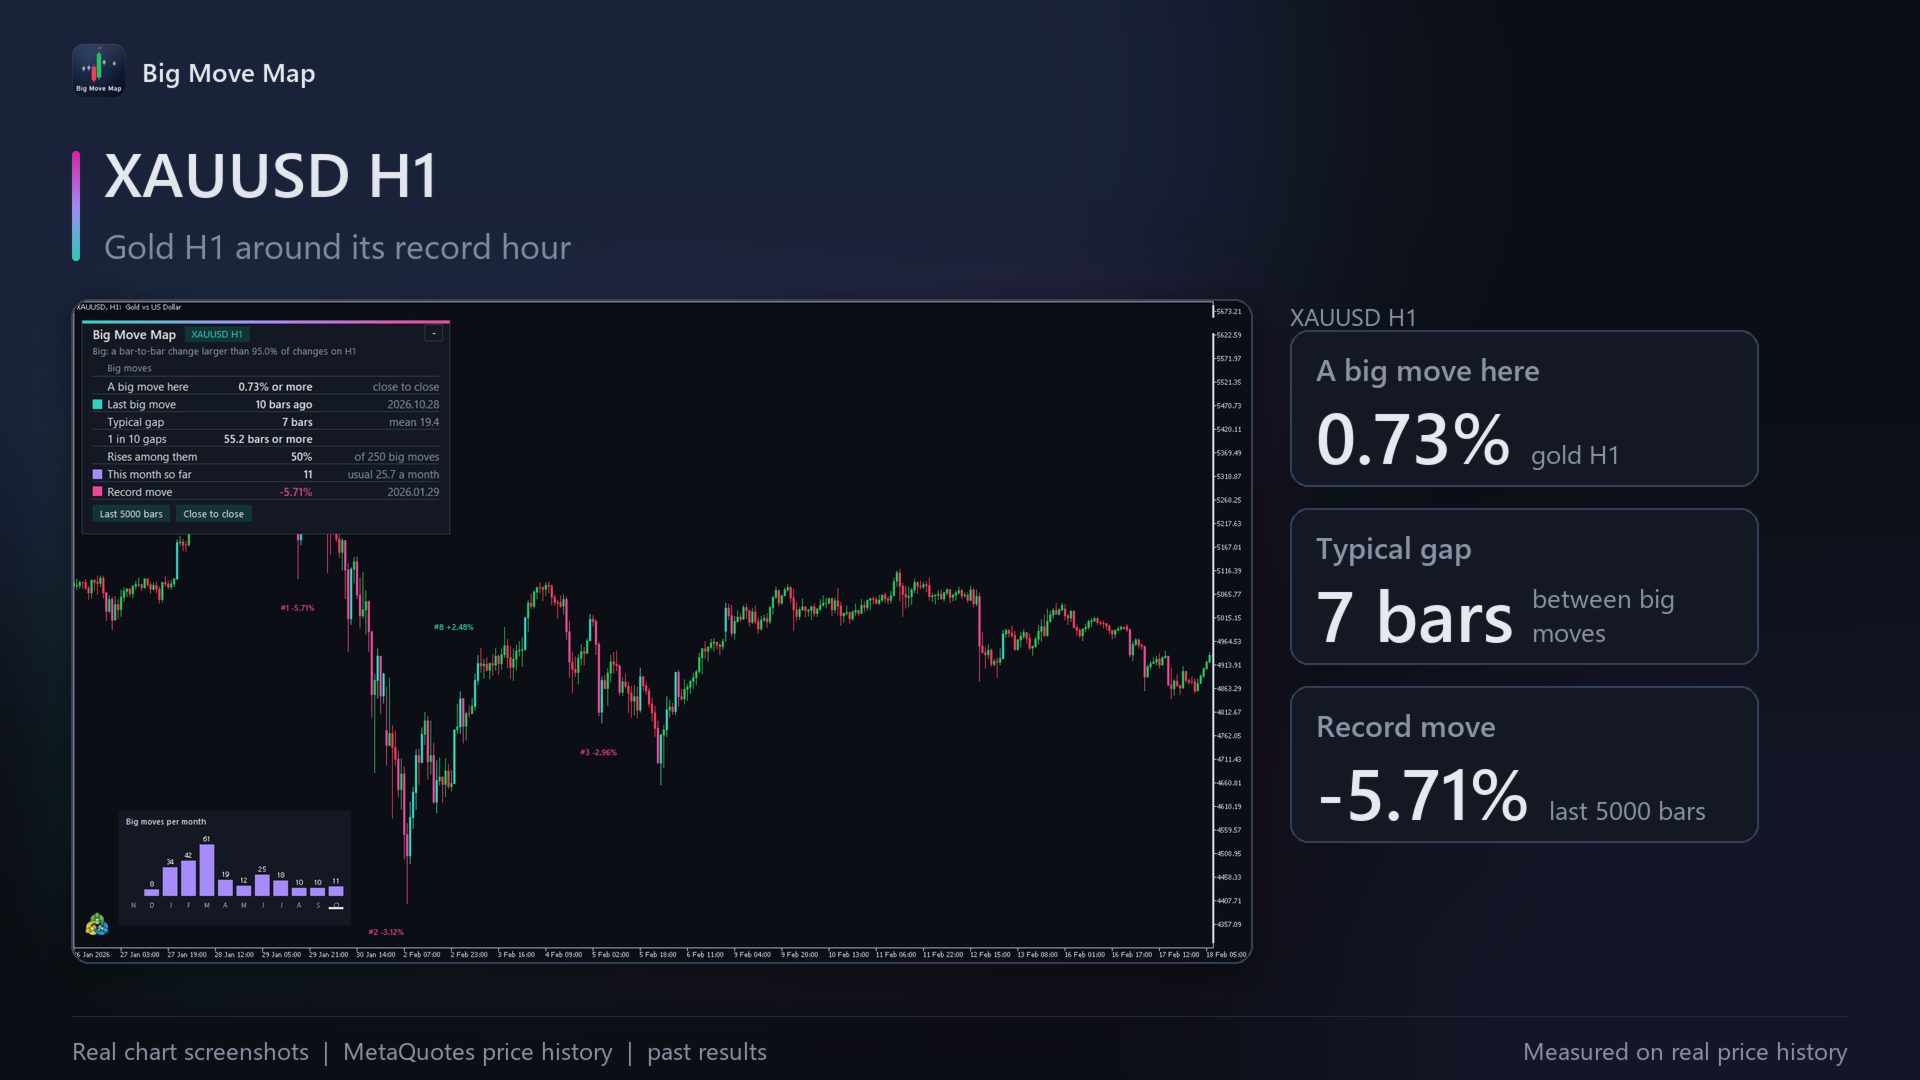
On US500 D1 since August 2012, a big day was a move of 2.02% or more; there were 182, and 42% of them were rises. The typical gap between big days was 4 days, the average 19. The record moves were -10.62% on 12 March 2020, +10.16% on 24 March 2020 and +10.14% on 9 April 2025. On gold H1 over the last 5000 bars, a big hour was 0.73% or more, and the typical gap between big hours was 7 bars. These describe past moves, not the future: a move can always be larger than any before it.

Recommended use

Any symbol and any timeframe, from M1 to monthly, with at least 200 finished candles. Typical uses: seeing at a glance where the big moves were on the chart, how long it has been since the last one, whether this month has had more than usual, and when the record moves happened.

Inputs

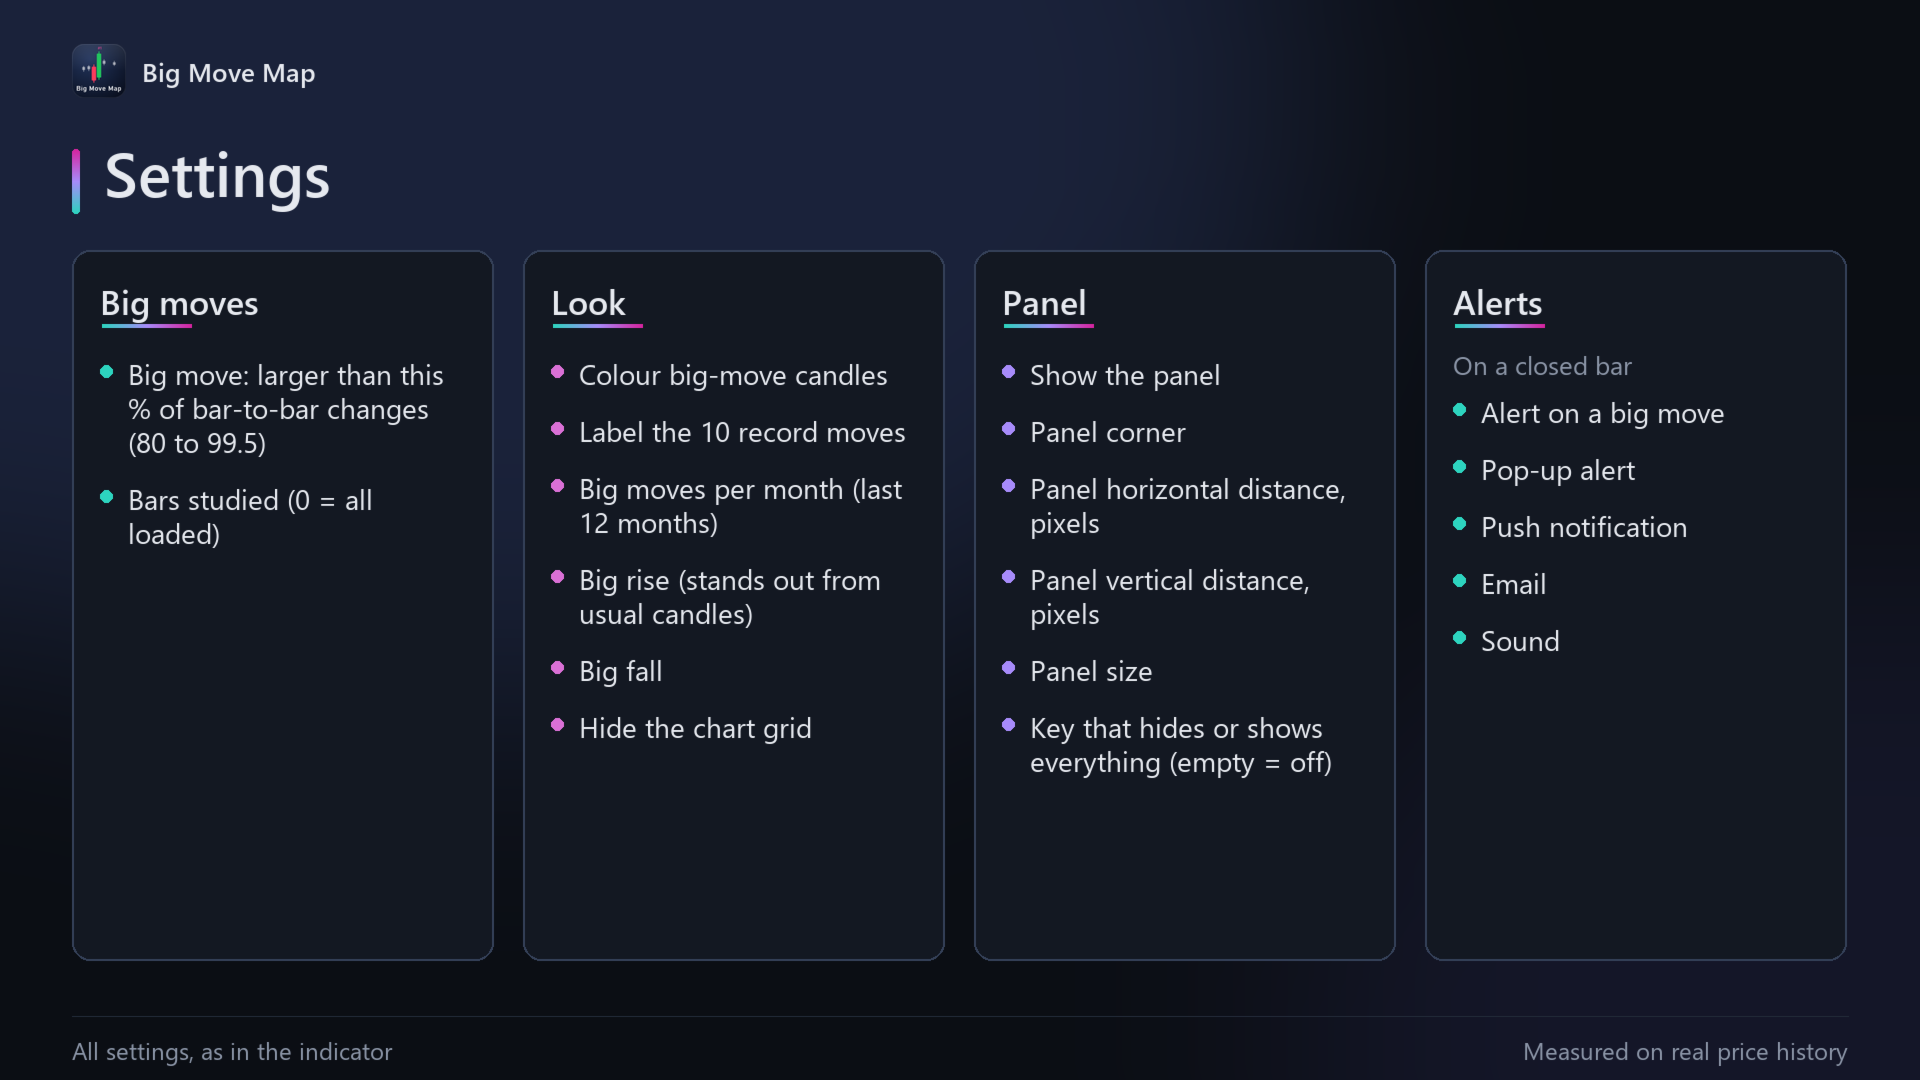
  • Big move: larger than this share of moves (95% by default, 80% to 99.5%).
  • Bars studied: 5000 by default; 0 uses all loaded history.
  • Coloured candles, record labels and the monthly strip: each can be switched off.
  • Colours for big rises and big falls.
  • Panel: show or hide, any chart corner, distance from the edges in pixels, and size (small, normal, large). One key (H by default) hides or shows everything the indicator draws.
  • Alert on a big move: pop-up, push, email or sound, on a closed bar.
  • Hide the chart grid: on by default.

Risk notice

Trading forex, metals, indices and other leveraged products carries a high risk of loss. Big Move Map is an analysis tool: it does not give investment advice or trading recommendations, and it does not guarantee any result. All figures describe past data, and past behaviour does not guarantee future behaviour. You are responsible for your own trading decisions.

Support

Questions? Message me through MQL5 chat.

Useful? A short review helps other traders find it.

A full guide with pictures: https://www.mql5.com/en/blogs/post/778639
Prodotti consigliati
L'indicatore costruisce le quotazioni attuali, che possono essere confrontate con quelle storiche e su questa base fanno una previsione del movimento dei prezzi. L'indicatore ha un campo di testo per una rapida navigazione fino alla data desiderata. Opzioni: Simbolo - selezione del simbolo che visualizzerà l'indicatore; SymbolPeriod - selezione del periodo da cui l'indicatore prenderà i dati; IndicatorColor - colore dell'indicatore; HorisontalShift - spostamento delle virgolette disegnate d
JT360 DNA Mini PnL Pointer V1.04 Public Compatto. Chiaro. Sempre sott’occhio. JT360 DNA Mini PnL Pointer è un indicatore leggero per MetaTrader 5 che mostra il profitto o la perdita flottante aggregata di tutte le posizioni aperte sul simbolo del grafico corrente. La sua visualizzazione compatta sul grafico combina il PnL basato sul rischio, espresso in R, una sottile mini-barra e una matrice di colori personalizzabile. I colori distintivi JT360, turchese e magenta, evidenziano i valori estremi
FREE
Price Magnet — Price Density and Attraction Levels Indicator Price Magnet is a professional analytical tool designed to identify key support and resistance levels based on statistical Price Density. The indicator analyzes a specified historical period and detects price levels where the market spent the most time. These zones act as “magnets,” attracting price action or forming a structural base for potential reversals. Unlike traditional Volume Profile tools, Price Magnet focuses on price-time d
Order Book, known also as Market Book, market depth, Level 2, - is a dynamically updated table with current volumes of orders to buy and to sell specific financial instument at price levels near Bid and Ask. MetaTrader 5 provides the means for receiving market book from your broker, but in real time only, without access to its history. The indicator OrderBook Cumulative Indicator accumulates market book data online and visualizes them on the chart. In addition, the indicator can show the market
Mirror Chart MT5
Andrej Hermann
5 (1)
The Mirror Chart MT5 is a overlay indicator specifically designed to project a second financial instrument directly onto the main chart window. This tool is invaluable for traders who rely on correlation analysis, as it visualizes the price movements of two different instruments in real time. Unlike traditional overlays, this indicator utilizes intelligent, dynamic centering and scaling logic. It continuously analyzes the visible price range in the current window for both symbols and calculates
FREE
Deriv Synthetic HTF Candle Projection GMT2 Higher Timeframe Candle Projection & Previous Levels Tool for Deriv Synthetic Indices (MT5) Overview Deriv Synthetic HTF Candle Projection GMT2 is a professional MetaTrader 5 indicator built specifically for Deriv Synthetic indices . It projects the current forming Higher Timeframe (HTF) candle onto the chart and automatically draws key reference levels from previous candles. This indicator is designed to help traders maintain higher timeframe context
FREE
FibRetrace Zones Zone di ritracciamento di Fibonacci dell'ultimo swing FibRetrace Zones è il complemento visivo gratuito dell'Expert Advisor FibRetrace. Disegna i livelli di ritracciamento di Fibonacci ed evidenzia la zona di pullback dell'ultimo swing, così vedete dove si allineano gli ingressi prima di operare. La zona è colorata in base alla direzione: verde per i setup rialzisti, rosso per quelli ribassisti. Funziona su qualsiasi simbolo e qualsiasi timeframe. CARATTERISTICHE PRINCIPALI Rile
FREE
Easy Correlations Indicator The Easy Correlations Indicator is designed to help traders analyze the relationship between two correlated instruments. By monitoring the distance between their Relative Strength Index (RSI) values, the indicator highlights situations where one instrument has moved significantly further than the other. This creates potential trading opportunities: Sell the stronger instrument (overstretched RSI) Buy the weaker instrument (lagging RSI) Because the positions are opened
FREE
BoxInside MT5
Evgeny Shevtsov
5 (4)
This indicator calculates the volume profile and places labels that correspond to the VAH, VAL and POC levels, for each candle individually. Indicator operation features The indicator works on the timeframes from M3 to MN, but it uses the history data of smaller periods: M1 - for periods from M3 to H1, M5 - for periods from H2 to H12, M30 - for the D1 period, H4 - for the W1 period, D1 - for the MN period. The color and location of the VAL, VAH and POC labels on the current candle are considere
FREE
The Horizontal Ray Tool is a lightweight, professional charting utility designed to streamline support and resistance mapping on MetaTrader 5. It brings rapid, one-click horizontal level placement directly to your live chart, eliminating the workspace clutter associated with infinite horizontal lines or manually drawn trendlines. Key Features: Interactive On-Screen Button: Spawns a clean, responsive "DRAW RAY" button docked directly on your chart canvas. A single click drops an independent hor
FREE
Italian Questo indicatore funge da assistente avanzato per l'analisi dei grafici per i trader che amano operare con i Pattern Grafici (Chart Patterns). È progettato per ridurre il carico dell'analisi visiva e aumentare la precisione nell'ottenere profitti. Caratteristiche principali di questo indicatore dal punto di vista dell'utilizzo pratico: 1. Rilevamento automatico dei pattern (Automated Pattern Detection) Risparmia tempo e riduce le distorsioni (Bias): Non è necessario tracciare manualment
Haven Volume Profile
Maksim Tarutin
4.64 (14)
Haven Volume Profile è un indicatore multifunzionale per l'analisi del profilo di volume che aiuta a identificare i livelli di prezzo chiave basati sulla distribuzione del volume di scambi. È stato progettato per i trader professionisti che desiderano comprendere meglio il mercato e identificare i punti di ingresso e di uscita cruciali per le loro operazioni. Altri prodotti ->  QUI Caratteristiche principali: Calcolo del Point of Control (POC) - il livello con la massima attività commerciale, ut
FREE
Follow The Line MT5
Oliver Gideon Amofa Appiah
4.6 (35)
This indicator obeys the popular maxim that: "THE TREND IS YOUR FRIEND" It paints a GREEN line for BUY and also paints a RED line for SELL. (you can change the colors). It gives alarms and alerts of all kinds. IT DOES NOT REPAINT and can be used for all currency pairs and timeframes. Yes, as easy and simple as that. Even a newbie can use it to make great and reliable trades. NB: For best results, get my other premium indicators for more powerful and reliable signals. Get them here: https://www.m
FREE
Bookmap pro
Ahmed Mohammed Bakr Bakr
FREE Bookmap Volume Heatmap Indicator Overview The   Bookmap Volume Heatmap   is a custom MetaTrader 5 (MQL5) indicator that creates a visual heatmap of trading volume distribution across price levels, similar to professional trading platforms like Bookmap. It provides traders with a clear visualization of where significant trading activity has occurred within a specified price range. Key Features 1.   Volume Distribution Visualization Creates color-coded rectangles on the chart representing vol
FREE
Best SAR MT5
Ashkan Hazegh Nikrou
4.33 (3)
Descrizione:  siamo felici di presentare il nostro nuovo indicatore gratuito basato su uno degli indicatori professionali e popolari nel mercato forex (PSAR) questo indicatore è una nuova modifica sull'indicatore SAR parabolico originale, nell'indicatore pro SAR puoi vedere l'incrocio tra i punti e il grafico dei prezzi, questo il crossover non è un segnale ma parla del potenziale di fine movimento, puoi iniziare a comprare con un nuovo punto blu e posizionare lo stop loss un atr prima del pri
FREE
This is a multi timeframe version of the  Supply and Demand indicator . It allows you to analyze a chart using the law of supply and demand on three different timeframes at a time. You will see zones of sales and purchases and determine the most profitable points to open positions. The indicator is based on the principle of market fractality. Supply and demand zones show places where a strong buyer or seller has made the price reverse and change its direction. The indicator has several types of
FREE
Volume Profile shows where volume has built up by price over the last N bars. It draws a horizontal histogram to the right of the last bar and marks three reference levels: the Point of Control, and the high and low of the Value Area. How it works - The price range of the last N bars (200 by default) is split into rows (40 by default). - Each bar's volume is spread evenly over its high-low range and added to the rows it touches. You can use tick volume (always available in MT5) or real volume w
FREE
A professional tool for trading - the divergence indicator between the RSI and the price, which allows you to receive a signal about a trend reversal in a timely manner or catch price pullback movements (depending on the settings). The indicator settings allow you to adjust the strength of the divergence due to the angle of the RSI peaks and the percentage change in price, which makes it possible to fine-tune the signal strength. The indicator code is optimized and is tested very quickly as par
FREE
Koryu Delta Koryu Delta è un indicatore MetaTrader 5. Identifica i punti di inversione di tendenza utilizzando l'analisi dei punti pivot e i dati del volume delta. Rileva i pattern di Market Shift e mostra segnali basati sulle dinamiche di mercato. Questo strumento può essere utilizzato dai trader che fanno scalping, swing trading o investimenti a lungo termine. Analizza fino a 500 barre storiche per individuare pattern passati. Utilizza la logica a barre chiuse per i segnali. Caratteristiche d
FREE
BKT Pro Tooco Un toolkit avanzato per supporto e resistenza in MetaTrader 5 che rileva i livelli di swing in tempo reale con quattro algoritmi di rilevamento selezionabili, senza ridisegnare i segnali confermati. BKT Pro Tooco è un indicatore di supporto e resistenza per MetaTrader 5, progettato per i trader che necessitano di un rilevamento affidabile di zone in molteplici strutture di mercato. L'indicatore offre quattro metodi di rilevamento indipendenti, consentendo al trader di abbinare l'al
FREE
VR Grid Mt5
Vladimir Pastushak
3 (9)
L'indicatore Griglia VR è progettato per creare una griglia grafica con impostazioni definite dall'utente. A differenza della griglia standard , VR Grid viene utilizzata per costruire livelli circolari . A seconda della scelta dell'utente, il passaggio tra i livelli rotondi può essere arbitrario. Inoltre, a differenza di altri indicatori e utilità, VR Grid mantiene la posizione della griglia anche quando cambia l'intervallo di tempo o si riavvia il terminale. È possibile ottenere impostazioni, f
FREE
VFI Quantum
Nikita Berdnikov
5 (1)
Introducing VFI (Volume Flow Indicator) – a trading indicator that analyzes the relationship between volume and price movement to identify key trading opportunities. The indicator displays the strength and direction of volume flow, providing clear signals about potential entry and exit points. Signals are formed based on zero line crossovers, crossovers between the VFI line and its exponential moving average (EMA), and when the indicator exits overbought and oversold zones. Attention! This stra
FREE
Overview Reversal Probability Profile is a price-action analysis indicator that identifies historical swing points, groups them into price clusters, and displays a profile of potential reversal zones directly on the MetaTrader 5 chart. The indicator combines pivot detection, K-Means clustering, and a profile-based visualisation to help traders assess areas where historical price reactions have occurred. It also provides configurable reversal signals, ATR-based risk references, and a visual repr
FREE
Cumulative Delta MT5
Evgeny Shevtsov
4.49 (63)
The indicator analyzes the volume scale and splits it into two components - seller volumes and buyer volumes, and also calculates the delta and cumulative delta. The indicator does not flicker or redraw, its calculation and plotting are performed fairly quickly, while using the data from the smaller (relative to the current) periods. The indicator operation modes can be switched using the Mode input variable: Buy - display only the buyer volumes. Sell - display only the seller volumes. BuySell -
FREE
RSI abcd
Francisco Gomes Da Silva
3.75 (4)
RSI ABCD Pattern Finder: Strategia Tecnica 1. Come Funziona l'Indicatore Combina il RSI classico con il rilevamento automatico di pattern armonici ABCD . Componenti Principali RSI standard (periodo regolabile) Marcatori di massimi e minimi (frecce) Pattern ABCD (linee verdi/rosse) Filtri ipercomprato (70) e ipervenduto (30) 2. Configurazione su MT5 period = 14 ; // Periodo RSI size = 4 ; // Dimensione massima del pattern OverBought = 70 ; // Livello ipercomprato OverSold = 30 ; // Livello iperve
FREE
Necessary for traders: tools and indicators Waves automatically calculate indicators, channel trend trading Perfect trend-wave automatic calculation channel calculation , MT4 Perfect trend-wave automatic calculation channel calculation , MT5 Local Trading copying Easy And Fast Copy , MT4 Easy And Fast Copy , MT5 Local Trading copying For DEMO Easy And Fast Copy , MT4 DEMO Easy And Fast Copy , MT5 DEMO The homeopathic indicator is also called the CCI indicator. The CCI indicator was proposed
FREE
Il livello Premium è un indicatore unico con una precisione superiore all'80% delle previsioni corrette! Questo indicatore è stato testato dai migliori Specialisti di Trading per più di due mesi! L'indicatore dell'autore che non troverai da nessun'altra parte! Dagli screenshot puoi vedere di persona la precisione di questo strumento! 1 è ottimo per il trading di opzioni binarie con un tempo di scadenza di 1 candela. 2 funziona su tutte le coppie di valute, azioni, materie prime, criptovalu
FVG Indicator is a high-precision smart money tool that identifies Fair Value Gaps (FVG) and grades them based on displacement, volume, and market structure. Core Features Graded Signals : Automatically ranks gaps into Grade A (Elite) , B , C , and D based on strength. Visual Mitigation : Boxes automatically "truncate" (stop extending) when price reclaims the gap, aligning perfectly with the original logic. Trend Filtering : Uses a 50-period EMA to ensure you only trade in the direction of the d
Fimathe PCM Indicador
Cristiano Rodrigo Olegini
5 (4)
Velas Forex FIMATHE PCM Indicator (GRATUITO) Il Velas Forex FIMATHE PCM Indicator è un indicatore gratuito progettato per aiutare i trader ad analizzare il mercato in modo semplice, rapido ed efficace. Il suo obiettivo è facilitare l'identificazione delle condizioni di mercato attraverso segnali visivi chiari, consentendo ai trader di prendere decisioni operative con maggiore sicurezza. Miglior risultato per XAUUSD: Timeframe: 5M Ora del server MT5: 02:00 Gestione del rischio: 1 Take Profit: in
FREE
Panic Meter limited
Dmitriy Gurenko
1 (1)
The indicator measures the frequency of incoming ticks to analyze the market activity. Bullish and bearish ticks are analyzed separately, informing about the currently predominant market sentiment. According to observations, an increase in the frequency of ticks (panic) indicates the beginning of strong price changes, and an increase in the frequency of ticks in a particular direction not only accompanies a price change in this direction, but also often anticipates it. The indicator is indispens
FREE
Gli utenti di questo prodotto hanno anche acquistato
Trend Sniper X
Sarvarbek Abduvoxobov
4.86 (43)
Trend Sniper X è un indicatore trend-following multi-timeframe per MetaTrader 5 che aiuta i trader a identificare la direzione del trend e i potenziali punti di inversione con chiarezza e precisione. per MT4: https://www.mql5.com/en/market/product/193245 Informazioni sul prezzo: Il prezzo attuale è promozionale ed è soggetto a modifiche con il rilascio di futuri aggiornamenti e nuove funzionalità. Offerta Bonus: Per ricevere GRATIS l'Auto-Trade Assistant EA per questo indicatore, invia un messa
Un nuovo Re in città - Indicatore + Gestione ordini (TP1 + TP2 + TP3) + Invio opzionale di segnali Telegram INCLUSO (GRATIS) (SISTEMA COMPLETO DI TRADING e SEGNALI) Il nostro miglior EA per l’Oro: Gold Slayer Questo indicatore include una strategia avanzata, un sistema di trading con gestione ordini personalizzabile e un sistema mean reversion che combina estensioni di envelope, supportato da molteplici filtri intelligenti di conferma come RSI per individuare ingressi di inversione ad alta proba
Smart Trend Trading System — MetaTrader 5 Dopo l'acquisto, inviami un messaggio su MQL5 per ricevere GRATUITAMENTE Smart Universal Expert Advisor, insieme al corso online, al manuale PDF e all'accesso al gruppo privato. STTS riunisce la direzione del trend, i segnali di entrata e uscita, le zone di inversione e i livelli di prezzo importanti direttamente sul grafico. Segui il sistema manualmente oppure collega un EA compatibile separato per eseguire le operazioni automaticamente con le impostazi
Zoryk Gold
Reda El Koutbane
4.76 (17)
ZORYK — Sistema avanzato di segnali XAUUSD per MetaTrader 5 Conosci sicuramente questa sensazione. Passi molto tempo ad analizzare l’oro. Aspetti il punto d’ingresso corretto. Finalmente apri l’operazione e il prezzo inizia immediatamente a muoversi contro di te. Chiudi troppo presto, sposti lo Stop Loss o esiti per alcuni secondi. Successivamente il mercato raggiunge esattamente l’obiettivo che avevi previsto inizialmente, ma senza di te nella posizione. Il problema non era sempre la direzione.
M5 Sniper
MeanFX
5 (3)
Porta il tuo vantaggio nel trading sotto i riflettori! M5 Sniper è un nuovo indicatore di MeanFX. Combina segnali di trading precisi con livelli TP/SL adattivi , creando così le migliori operazioni statistiche possibili! Il prezzo aumenta ogni 5 acquisti, il prossimo prezzo è di 69$ Scrivimi dopo l'acquisto per ricevere consigli/guida e un EA bonus Cosa lo rende diverso? Performance statistica comprovata su Gold XAUUSD ( funziona su quasi ogni asset , concentrandosi sulla padronanza di un singol
SuperScalp Pro
Van Minh Nguyen
4.54 (37)
SuperScalp Pro - Professional Multi-Layer Confluence Scalping System SuperScalp Pro è un indicatore di scalping avanzato che potenzia il Supertrend classico con diversi filtri intelligenti di conferma. Aiuta a individuare opportunità di trading Buy/Sell con una maggiore probabilità di successo, riducendo significativamente i falsi segnali. Le frecce Buy e Sell vengono visualizzate chiaramente direttamente sul grafico, insieme ai livelli di Stop Loss e Take Profit basati sull’ATR, calcolati autom
SMC Intraday Formula
VividMind Digital Solutions
5 (26)
Cominciamo con la verità. Nessun indicatore da solo ti renderà profittevole. Se qualcuno ti dice il contrario, ti sta vendendo un sogno. Qualsiasi indicatore che mostra frecce perfette di acquisto/vendita può essere reso impeccabile — basta ingrandire la giusta sezione della storia e catturare solo i trade vincenti. Noi non lo facciamo.  SMC Intraday Formula è uno strumento. Legge la struttura del mercato per te, identifica le zone a più alta probabilità e ti mostra esattamente come appare la t
GoldenX Entry MT5
VividMind Digital Solutions
5 (17)
GoldenX Entry è un indicatore per MT5 con un algoritmo adattivo Smart Entry Trend, un sistema di scoring dei segnali, un rilevatore del regime di mercato e un filtro di volatilità. Ogni segnale include un livello di ingresso calcolato, tre livelli di Take-Profit (TP1, TP2, TP3) e un livello di Stop-Loss. È costruito su più livelli analitici progettati per adattarsi a diverse condizioni di mercato, combinando un sistema analitico multilivello con un ottimizzatore integrato e un sistema di traccia
La leggenda ritorna: Entry Points Pro 10. Il rilancio del leggendario indicatore che per 3 anni è rimasto nella Top-3 del MQL5 Market. Oltre 600 recensioni su due versioni, migliaia di trader lo usano ogni giorno per operare, oltre 28.000 download della demo   MT4+MT5 . Ho letto ogni vostra recensione degli ultimi cinque anni — e invece di promesse ho inserito nella versione 10 le risposte. Dall'autore che opera sui mercati dal 1999 e tiene all'onestà, alla propria reputazione e ai propri client
M1 Sniper MT5
Oleg Rodin
5 (7)
M1 SNIPER   è un sistema di indicatori di trading facile da usare. Si tratta di un indicatore a freccia progettato per l'intervallo temporale M1. L'indicatore può essere utilizzato come sistema autonomo per lo scalping sull'intervallo temporale M1 e come parte del tuo sistema di trading esistente. Sebbene questo sistema di trading sia stato progettato specificamente per il trading sull'intervallo temporale M1, può comunque essere utilizzato anche con altri intervalli temporali. Inizialmente ho p
Auto Optimized SpeedAngle è un sistema di vettorizzazione del momento di livello istituzionale che elimina l'overfitting ( curve-fitting ) attraverso l'ottimizzazione continua Walk-Forward (WFO). Invece di affidarsi a input statici che si degradano quando i regimi di mercato cambiano, l'indicatore recalibra dinamicamente i suoi parametri utilizzando la validazione Out-of-Sample (OOS), assicurando che i segnali visualizzati rappresentino reali vantaggi statistici anziché anomalie storiche. Quadro
Gann Made Easy è un sistema di trading Forex professionale e facile da usare che si basa sui migliori principi del trading utilizzando la teoria di mr. WD Gann. L'indicatore fornisce segnali ACQUISTA e VENDI accurati, inclusi i livelli di Stop Loss e Take Profit. Puoi fare trading anche in movimento utilizzando le notifiche PUSH. CONTATTAMI DOPO L'ACQUISTO PER RICEVERE GRATUITAMENTE LE ISTRUZIONI DI TRADING E OTTIMI INDICATORI EXTRA! Probabilmente hai già sentito parlare molte volte dei metodi d
Prossimo aggiornamento — Versione 2.52 in arrivo! [NOVITÀ] Preparati a 4 nuove funzionalità principali progettate per migliorare la tua analisi di mercato e il tuo flusso di lavoro nel trading Portiamo l’analisi di mercato a un livello superiore con 4 nuove funzionalità progettate per soddisfare le tue esigenze di trading. Ecco le novità: 1. TRADE OVERVIEW DASHBOARD 2. CONFLUENCE AT ZONE 3. STRONG & WEAK HIGH/LOW 4. OTE 1. TRADE OVERVIEW DASHBOARD Una dashboard che ti aiuta a comprendere più fa
Gold Entry Sniper
Tahir Mehmood
5 (21)
Gold Entry Sniper – Dashboard ATR Multi-Timeframe per Scalping e Swing Trading sull’Oro Gold Entry Sniper è un indicatore avanzato per MetaTrader 5 che offre segnali di acquisto/vendita precisi per XAUUSD e altri strumenti, basato sulla logica ATR Trailing Stop e l' analisi multi-timeframe . Caratteristiche e Vantaggi Analisi Multi-Timeframe – Visualizza trend su M1, M5, M15 in un'unica dashboard. Trailing Stop Basato su ATR – Stop dinamici che si adattano alla volatilità. Dashboard Professional
Power Candles MT5
Daniel Stein
4.58 (12)
Power Candles V3 - Indicatore di forza ad ottimizzazione automatica Power Candles V3 trasforma la forza delle valute e degli strumenti in un piano di trading attuabile su ogni grafico a cui è collegato. Invece di limitarsi a colorare le candele, esegue un'auto-ottimizzazione in tempo reale in background e ti fornisce i migliori valori di Stop Loss, Take Profit e soglia di segnale per il simbolo che hai davanti. Basta un clic per adottarlo nel trading live: i raggi di ingresso, Stop Loss e Take P
Adaptive Price Action Engine Acquista un indicatore, ricevi l'EA gratis Analisi Auto-Ottimizzata del Trend e dei Pattern Candlestick Multi-Timeframe I mercati cambiano continuamente e non tutti i pattern di Price Action hanno lo stesso valore in ogni condizione di mercato. Adaptive Price Action Engine è progettato per adattarsi alle condizioni di mercato in continua evoluzione, combinando struttura del trend, analisi Multi-Timeframe, pattern Candlestick e ottimizzazione statistica in un unico fr
FiboSniper Pro
Van Minh Nguyen
5 (4)
FiboSniper Pro – Multi-Filter Fibonacci System with Auto SL/TP and Control Panel FiboSniper Pro è un indicatore tecnico che combina Fibonacci Envelopes dinamici con diversi filtri di conferma per generare segnali Buy e Sell selezionati. I livelli di Fibonacci vengono calcolati sulla base di Moving Average e ATR e successivamente filtrati tramite ADX, EMA, RSI, ATR, Volume, Time e struttura delle candele. L’indicatore visualizza direttamente sul grafico i livelli automatici di Stop Loss e Take Pr
Gold Trend Coach MT5
Cristhian Alexander Gaibor Cuasquer
5 (2)
Gold Trend Coach è un indicatore di trend per l'oro (XAUUSD) su MetaTrader 5 con segnali di acquisto e vendita, stop loss e tre obiettivi di take profit, confermati alla chiusura della candela, una dashboard coach multi-timeframe e avvisi sul tuo telefono e su Telegram. Costruito per lo scalping su M5 e l'intraday su M15 durante le sessioni di Londra e New York. Gold Trend Coach: segnali di trend sull'oro XAUUSD con ingresso, stop e tre obiettivi. Prezzo di lancio $39 per le prime 20 copie, poi
Tokyo mt5 Indicator
Vasiliy Strukov
5 (12)
Il Tokyo Indicator offre una chiara panoramica visiva della direzione del trend, dei potenziali segnali di trading e delle condizioni di mercato. La sua linea di trend a gradini, codificata a colori, distingue le fasi rialziste (in blu) da quelle ribassiste (in magenta). Frecce direzionali dedicate evidenziano potenziali opportunità di acquisto e vendita al variare del trend visualizzato. Una dashboard integrata riunisce in un'unica visualizzazione pratica il segnale corrente, il bias di mercato
Boba Analysis Suite
Trade Ready Solutions LLC
5 (2)
Boba Analysis Suite Boba Analysis Suite è un indicatore di analisi per MetaTrader 5. Riunisce la struttura del mercato, le zone di prezzo rilevanti e il contesto generale del mercato in un’unica visualizzazione del grafico. Sviluppato sulla base dell’esperienza pratica come trader e formatore di trading, supporta un processo di analisi strutturato: valutare la direzione del mercato, individuare livelli importanti e analizzare congiuntamente più intervalli temporali. Analisi nel contesto del merc
Atomic Analyst MT5
Issam Kassas
4.46 (63)
Atomic Analyst — MetaTrader 5 Dopo l'acquisto, inviami un messaggio su MQL5 per ricevere GRATUITAMENTE Smart Universal Expert Advisor, insieme al corso online, al manuale PDF e all'accesso al gruppo privato. Atomic Analyst riunisce l’azione del prezzo, la direzione del trend, i segnali di entrata e uscita, lo Stop Loss e diversi livelli di Take Profit direttamente sul grafico. INDIVIDUA IL SEGNALE. COMPRENDI IL CONTESTO OPERATIVO. Atomic Analyst organizza la sua analisi in informazioni visive ch
Quantum TrendPulse
Bogdan Ion Puscasu
5 (26)
Ecco   Quantum TrendPulse   , lo strumento di trading definitivo che combina la potenza di   SuperTrend   ,   RSI   e   Stocastico   in un unico indicatore completo per massimizzare il tuo potenziale di trading. Progettato per i trader che cercano precisione ed efficienza, questo indicatore ti aiuta a identificare con sicurezza le tendenze di mercato, i cambiamenti di momentum e i punti di entrata e uscita ottimali. Caratteristiche principali: Integrazione SuperTrend:   segui facilmente l'andame
Trend Catcher ind mt5
Ramil Minniakhmetov
5 (18)
INDICATORE TREND CATCHER L'indicatore Trend Catcher analizza i movimenti dei prezzi di mercato, utilizzando una combinazione di indicatori di analisi del trend proprietari dell'autore e personalizzati. Identifica la vera direzione del mercato filtrando il rumore a breve termine e concentrandosi sulla forza del momentum sottostante, sull'espansione della volatilità e sul comportamento della struttura dei prezzi. Utilizza inoltre una combinazione di indicatori personalizzati di smoothing e filtr
Neuro Poseidon MT5
Daria Rezueva
4.75 (52)
Neuro Poseidon is a new indicator by Daria Rezueva. It combines precise trading signals with adaptive TP/SL levels - creating best possible trades as a result! Message me and get  Neuro Poseidon Assistant  as a gift to automize your trading process! What makes it stand out? 1. Proven profitability on all assets and timeframes 2. Only confirmed BUY and SELL signals present on the chart 3. Adaptive TP & SL levels generated by the software for each trade 4. Easy to understand - suitable for al
Azimuth Pro
Ottaviano De Cicco
5 (7)
Azimuth Pro V2: Synthetic Fractal Structure and Confirmed Entries for MT5 Overview Azimuth Pro is a multi-level swing structure indicator by Merkava Labs . Four nested swing layers, swing-anchored VWAP, ABC pattern detection, three-timeframe structural filtering, and closed-bar confirmed entries — one chart, one workflow from micro-swings to macro-cycles. This is not a blind signal product. It is a structure-first workflow for traders who care about location, context, and timing. Halloween P
Smart Price Action Concepts — MetaTrader 5 Dopo l'acquisto, inviami un messaggio su MQL5 per ricevere GRATUITAMENTE Smart Universal Expert Advisor, insieme al corso online, al manuale PDF e all'accesso al gruppo privato. Osserva la struttura. Identifica le zone. Costruisci il tuo piano di trading. Riunisci Smart Money Concepts (SMC), analisi in stile ICT e azione del prezzo in un grafico organizzato. Identifica la struttura del mercato, gli order block, i livelli di riferimento della liquidità e
Unix Scalper
Issam Kassas
4 (4)
Unix Scalper — MetaTrader 5 Dopo l'acquisto, inviami un messaggio su MQL5 per ricevere GRATUITAMENTE Smart Universal Expert Advisor, insieme al corso online, al manuale PDF e all'accesso al gruppo privato. Individua il setup. Esamina il piano. Scegli come operare. UNIX Scalper riunisce analisi di mercato, indicazioni BUY/SELL/WAIT e livelli Entry, Stop Loss, TP1 e TP2 in un unico pannello organizzato. VISUALIZZA IL SEGNALE E IL PIANO • Indicazioni chiare: BUY, SELL o WAIT. • Livelli definiti: E
Indicatore multi-valuta di forza e momentum MT5 Dynamic Forex28 Navigator è l'evoluzione dei nostri indicatori popolari da lungo tempo e unisce la potenza di tre strumenti in uno: Advanced Currency Strength28 Indicator (700 recensioni) Advanced Currency IMPULSE with ALERT (530 recensioni) CS28 Combo Signals (bonus attuale) I due indicatori precedenti hanno insieme più di 1.200 recensioni sul MQL5 Market e sono un punto di riferimento nella comunità MT4 dal 2016. Dynamic Forex28 Navigator MT5 por
Break and Retest Hunter
Mohamed Hassan
3.67 (3)
Break and Retest Hunter is a powerful MetaTrader 5 indicator designed to automatically identify support and resistance levels, breakout structures, and potential retest opportunities in real time. Bonus Indicator: After purchasing Break and Retest Hunter , contact me to receive Trade Indicator Assistant EA completely free as a bonus utility. $65 for the next 10 copies . Next price is $120.  Combining adaptive market analysis, clear BUY/SELL signals, Fibonacci-based profit targets, and a premiu
Volatility Master for MetaTrader is a real-time dashboard tool that scans up to  50 symbols  to identify high-volatility , trending markets instantly. With bullish/bearish signals, customizable alerts, and a user-friendly interface, it helps you avoid range-bound conditions and focus on high-probability trades. Clarity leads to confidence. Trade confidently and protect your capital effectively with this powerful dashboard. We don't offer free or bonus indicators in exchange of reviews from you.
Altri dall’autore
Swing Size Ruler colours every swing on the chart by its size and measures the swing you are in now against all past swings on this symbol and timeframe: "this up swing is longer than 82% of past up swings". On gold H1, a typical up swing covered 10,309 points in 16 bars, and 1 swing in 10 covered 23,327 points or more. Closed bars only, so it never repaints. Every number is verified against a separate implementation before each release. What it does Each finished swing is drawn on the price cha

FREE
What kind of day is it: a trend day, a range day, a reversal, an inside or an outside day? Day Type Map names every day on your chart, shows what today is so far, and how this symbol's past days were split between the six types. On gold over the last 250 days, 32% were range days, 17% trend-up days and 16% reversals. Free, clear, and checked against a separate implementation. What it does Each recent day is underlined and named in its own colour: trend up, trend down, range, reversal, inside or
FREE
How far is price below its high, and how long has it been there? Drawdown Map shows it on any chart: the drawdown now, the bars below the peak, the rise needed to get back, the maximum drawdown and the maximum time below a peak on this chart, and how often past drawdowns this deep got back to their peak within a set number of bars. Closed bars only, so it never repaints. Every number is verified against a separate implementation before each release. What it does Drawdown Map draws the drawdown i
FREE
Wick Map
Anna Makwana
Wick Map shows where long wicks happen on your symbol: a dot on every long upper and lower wick, a wick clock that splits them by hour of the day, and today's long wicks against the usual for the same hours. On EURUSD M15, 32% of the candles opening at 00:00 broker time had a long lower wick, against 17% over all hours. On US500 D1, long lower wicks came on 19.8% of days and long upper wicks on 11.8%. Closed bars only, so it never repaints. Every number is verified against a separate implementat
FREE
A ruler that tells you whether a move is big. Drag it over any move and it shows the size in points and percent, the number of bars and the time it took, the value per lot, and how often past spans of the same number of bars on this symbol reached that far. On gold H1, a usual 5-bar span reached 4,782 points, and 1 span in 10 reached 10,089 points. Free, clear, and checked against a separate implementation. What it does A ruler line is placed over the recent move when you attach the indicator; d
FREE
How much room is left before a funded-account challenge's loss limit? Prop Floor Monitor shows it on the chart at a glance: the daily-loss floor, the maximum-loss floor, which one is closer, and the price at which this symbol's open position would reach it. The daily reset follows the time zone you choose, with its daylight saving: the reset moment was checked against the IANA time zone database at 18,688 moments from 2024 to 2027, including every clock change, with no difference. Every number i
FREE
How big is a normal Asia, London or New York session on this symbol, and how does today's compare? Session Ranges answers from the symbol's own history: the typical and big size of each session, today's size so far as a multiple of normal, and a box around every session of the last days, tinted quiet, normal or big. Free, clear, and checked against a separate implementation. What it does Session Ranges draws a box around each Asia, London and New York session on the recent days, from the session
FREE
A candle countdown that also tells you how big the current candle already is. On gold H1, the usual 16:00 candle was 3119 points and the usual 23:00 candle 645 points: the same timeframe, very different candles by hour. Candle Timer Pulse shows the time left in the current candle and compares its size so far with the usual candle of this timeframe at this hour, from the symbol's own history. Free, clear, and checked against a separate implementation. What it does Beside the forming candle, a cou
FREE
Is today's move normal or unusual for this market? Daily Range Stats answers it from the symbol's own history: how big a typical, a big and a very big day usually is, how today ranks against past days, and where today's high or low would sit if it became one of those days. Free, clear, and checked against a separate implementation. What it does A small table on the chart shows how big a typical day, a big day (1 in 5 days) and a very big day (1 in 20 days) is on this symbol over the past days yo
FREE
Filtro:
Nessuna recensione
Rispondi alla recensione