DinexSpace Risk to Lot Calculator

  • Indicatori
  • Huu Tho Tran
    Huu Tho Tran
    DinexSpace - studio di automazione del trading per MetaTrader 5.
    Validiamo la tua idea di trading con costi reali in due fasi prima di programmarla. Se l'idea non supera la validazione ci fermiamo e non paghi il robot.
    Storico live
  • Versione: 1.0

Risk to Lot Calculator turns "how much am I willing to lose on this trade" into a lot size. It takes your contract data straight from the broker, so it works the same on forex, gold, indices and crypto CFDs.


How it works

- Risk per trade is a percent of your balance (or equity, or a manual amount) or a fixed amount in the account currency.

- The stop loss can be a price, a distance in points or a multiple of ATR.

- The loss for 1.00 lot at the stop is the stop distance divided by the tick size, times the symbol's tick value (loss side). This includes the conversion to your account currency done by the terminal.

- The lot size is rounded down to the broker's lot step, so the money at risk is never above your target. The panel shows the risk after rounding.

- It also shows the take-profit for a chosen R multiple and the margin needed, calculated by the terminal for the current account.

- Entry, stop-loss and take-profit lines are drawn on the chart.


Inputs

- Account: balance source, manual balance, risk mode and value.

- Trade: direction, entry (0 = current price), stop-loss mode, price, points, ATR length and multiple, R multiple.

- Display: lines on/off, panel corner.


Limits

- If the lot is below the broker's minimum, the panel says so instead of rounding up.

- Tick value can change with exchange rates, and the real fill price can differ from the entry used here.

- Margin comes from the terminal's own calculation for the current account and may differ on other accounts.


The indicator only calculates and draws. It never places, changes or closes orders.

Prodotti consigliati
RelicusRoad Daily Pivots è un indicatore di punti pivot giornalieri per MetaTrader 4 e MetaTrader 5 che divide il range del giorno precedente in livelli Fibonacci e li estende sopra e sotto di esso, da meno 100 a più 200 per cento. Invece dei classici floor pivot, il range completato precedente viene trattato come una scala in cui il minimo è 0% e il massimo è 100%. Diciannove livelli vengono stampati come brevi marcatori colorati al bordo destro del grafico, così l'ampiezza del movimento di ogg
FREE
Pin Bars MT5
Yury Emeliyanov
Main purpose:   "Pin Bars"   is designed to automatically detect pin bars on financial market charts. A pin bar is a candle with a characteristic body and a long tail, which can signal a trend reversal or correction. How it works:   The indicator analyzes each candle on the chart, determining the size of the body, tail and nose of the candle. When a pin bar corresponding to predefined parameters is detected, the indicator marks it on the chart with an up or down arrow, depending on the directi
FREE
Universal Box MT5
Sergey Ermolov
4.43 (7)
Dual Striker - un nuovo Expert Advisor per il trading sull'Oro. Segnale live +150% ->   Conto Reale Senza Martingala e senza mediazione delle posizioni Provalo gratuitamente sulla tua piattaforma di trading:   Expert Advisor Dual Striker Universal Box   traccia sul grafico   gli intervalli di prezzo   che possono essere utilizzati in seguito per fare trading sul breakout di un intervallo di prezzo. Sono molte le strategie che si possono applicare a questo indicatore. L'indicatore è impostato di
FREE
Raymond Cloudy Day
The Hung Ngo
5 (3)
Raymond Cloudy Day Indicator for MT5 – Pivot-Based Reversal and Trend Levels Raymond Cloudy Day Indicator is a pivot-based level indicator for MetaTrader 5 (MT5). It was developed by Ngo The Hung based on Raymond’s original idea and is designed to give a structured view of potential reversal zones, trend extensions and support/resistance levels directly on the chart. The default settings are optimised for XAUUSD on the H1 timeframe, but the indicator can be tested and adjusted for other symbols
FREE
Trade Behavior Mirror legge esclusivamente lo storico delle operazioni già chiuse del proprio conto e conta un solo schema: aprire una nuova posizione poco dopo una perdita realizzata, con un lotto superiore al proprio volume abituale. Lo strumento non prevede nulla e non dà alcun consiglio. Ogni numero nel pannello è qualcosa che è già accaduto su questo conto. Come vengono costruiti i numeri: legge fino a 31 giorni di operazioni chiuse su tutti i simboli e tutti i magic number - è una fotogra
FREE
Dynamic Key Levels
Rodrigo Ivan Ahumada Pena
Key Levels S/R — Dynamic Support & Resistance Structure Key Levels S/R is a precise and reliable indicator that identifies true Support and Resistance levels based on confirmed swing structure. Instead of guessing or repainting, it waits for market validation before marking any level — giving traders clean, trustworthy zones to work with. This tool is ideal for breakout traders, pullback traders, and anyone who uses pending orders at structurally meaningful price levels. How the Logic Works The
FREE
Reversal Composite Candles
MetaQuotes Ltd.
3.69 (16)
The idea of the system is to indentify the reversal patterns using the calculation of the composite candle. The reversal patterns is similar to the "Hammer" and "Hanging Man" patterns in Japanese candlestick analysis. But it uses the composite candle instead the single candle and doesn't need the small body of the composite candle to confirm the reversal. Input parameters: Range - maximal number of bars, used in the calculation of the composite candle. Minimum - minimal size of the composite can
FREE
TradeVision Pro
Ian Nganga Comba
TradeVisonPro Forex Analyzer Pro Dashboard di analisi e monitoraggio dei conti di trading MT5 TradeVisonPro Forex Analyzer Pro è una soluzione di analisi del trading e monitoraggio dei conti progettata per gli utenti di MetaTrader 5. Il prodotto organizza i dati di trading MT5 in una dashboard web strutturata, consentendo ai trader di visualizzare le informazioni del conto, monitorare le posizioni aperte, analizzare lo storico delle operazioni, seguire le strategie, mantenere un diario di tradin
FREE
High Low Open Close
Alexandre Borela
4.98 (46)
Se ti piace questo progetto, lascia una recensione a 5 stelle. Questo indicatore disegna i prezzi aperti, alti, bassi e di chiusura per i specificati periodo e può essere regolato per un determinato fuso orario. Questi sono livelli importanti guardati da molti istituzionali e professionali commercianti e può essere utile per voi per conoscere i luoghi dove potrebbero essere più attivo. I periodi disponibili sono: Giorno precedente. Settimana precedente. Mese precedente. Precedente trimestre. A
FREE
Liquidity Sweep Candles marks candles that take out the high or the low of the previous candle (a liquidity sweep) and classifies them by where they close. Three types The signal candle [1] is compared with the previous candle [2]. FU : the candle sweeps the high (low) of [2] and closes beyond it. The weakest type: in most cases this is an ordinary trend candle. AFU : the candle sweeps the high (low) of [2] and closes back inside the range of [2]. SFU : the candle sweeps the high (low) of [2] an
FREE
TrendVision AI
Murtadha Majid Jeyad Al-Khuzaie
TrendVision AI – Smart Trend Channels & Price Forecasting for MetaTrader 5 Discover market structure and explore potential future price direction with TrendVision AI, an advanced technical indicator for MetaTrader 5 that combines automatic trendline analysis with a machine-learning-based price forecasting model. How Does TrendVision AI Work? TrendVision AI analyzes historical candlestick data within a configurable lookback window. It automatically draws two trendlines directly on the chart:
FREE
Donchian Breakout And Rsi
Mattia Impicciatore
4.5 (2)
Descrizione generale Questo indicatore è una versione avanzata del classico Donchian Channel , arricchita con funzioni operative per il trading reale. Oltre alle tre linee tipiche (massimo, minimo e linea centrale), il sistema rileva i breakout e li segnala graficamente con frecce sul grafico, mostrando solo la linea opposta alla direzione del trend per semplificare la lettura. L’indicatore include: Segnali visivi : frecce colorate al breakout Notifiche automatiche : popup, push e email Filtro R
FREE
ZumikoFx Trading Stats
Michal Piotr Kochanski
ZumikoFX Trading Stats - Professional Account Dashboard Overview ZumikoFX Trading Stats is a comprehensive, real-time account monitoring dashboard designed for serious traders who need complete visibility of their trading performance. This indicator displays all crucial trading statistics in an elegant, easy-to-read panel positioned in the top-right corner of your chart. Key Features Complete Account Monitoring Balance & Equity - Real-time account status with current balance and equity includ
FREE
Bohemia Gold MT5
Vladislav Taska
4.8 (5)
Bohemia Gold MT5 is  Trend & Volatility EA trading system designed specifically for Gold (XAUUSD) . It combines higher-timeframe trend filtering , trend detection , volatility-based SL management , and advanced trade management to adapt market conditions. It uses style logic focused on trend strength, volatility, and capital protection. NOTE:   Based on backtests, I found better trading results with the following setup: D1/H4/H2 (Trend/ADX/ATR & trade). The SET file can be downloaded here … bohe
FREE
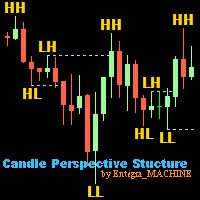
Candle Perspective Structure Indicator MT5 is a simple indicator that defines and displays the candlestick structure of the market. This indicator will suit both experienced traders and beginners who find it difficult to follow the structure visually. If you want to see more high-quality products or order the development/conversion of your own products, visit my partners' website: 4xDev Get 10% OFF on manual strategies automation services or indicator development/conversion services at 4xDev
FREE
Free automatic Fibonacci is an indicator that automatically plots a Fibonacci retracement based on the number of bars you select on the BarsToScan setting in the indicator. The Fibonacci is automatically updated in real time as new highest and lowest values appears amongst the selected bars. You can select which level values to be displayed in the indicator settings. You can also select the color of the levels thus enabling the trader to be able to attach the indicator several times with differe
FREE
Smc Session Killzone and Breakout The Smc Session Killzone and Breakout indicator automates the institutional session trading model for MetaTrader 5. It draws the Asian, London, and New York session ranges as labelled boxes on the chart, detects when price sweeps beyond the Asian session high or low, and fires a non-repainting entry signal after a Market Structure Shift is confirmed. All signals are based on closed bars and do not repaint. The underlying model follows the sequence that institut
FREE
Show Pips for MT5
Roman Podpora
4.5 (32)
Questo indicatore informativo sarà utile per coloro che vogliono essere sempre informati sulla situazione attuale del conto. VERSION MT 4 -   More useful indicators L'indicatore mostra dati come profitto in punti, percentuale e valuta, nonché lo spread per la coppia corrente e il tempo fino alla chiusura della barra nell'intervallo di tempo corrente. Esistono diverse opzioni per posizionare la linea delle informazioni sulla carta: A destra del prezzo (corre dietro al prezzo); Come commento (nell
FREE
VFI Quantum
Nikita Berdnikov
5 (1)
Introducing VFI (Volume Flow Indicator) – a trading indicator that analyzes the relationship between volume and price movement to identify key trading opportunities. The indicator displays the strength and direction of volume flow, providing clear signals about potential entry and exit points. Signals are formed based on zero line crossovers, crossovers between the VFI line and its exponential moving average (EMA), and when the indicator exits overbought and oversold zones. Attention! This stra
FREE
Automatic Trendlines
Pasi Hakamaki
4.69 (51)
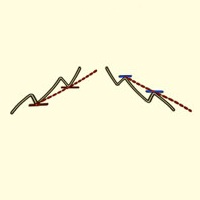
The indicator draws trendlines on chart. This indicator has six inputs. User can specify alternative labels for both lines. If multiple instances of the indicator are used, the labels must differ. User can set width and color of the lines and depth which specifies what significant peaks should be used. For example, Depth=10 sets trendlines using the current peaks and valleys that have at least 10 bars to the right and to the left and that have highs/lows less/greater than the peak's high/low. In
FREE
Trader Panel Alpha X
Alvaro Garcia Batelli
Are you tired of the slow, clunky, and uninformative default order panel in MetaTrader 5? Discretionary trading demands speed, precision, and above all, clear information. Clicking through multiple menus, dragging stops one by one, and lacking a consolidated view of your risk are barriers that cost you time and, most importantly, money. Professional trading requires professional tools. Trader Panel Alpha X Pro is the definitive solution. It's not just another "order ticket"; it's a complete trad
FREE
PZ Fibonacci MT5
PZ TRADING SLU
4.57 (14)
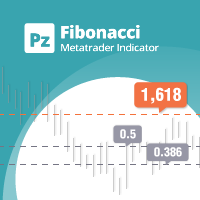
Are you tired of plotting Fibonacci retracements or extensions manually? This indicator displays Fibo retracements or extensions automatically, calculated from two different price points, without human intervention or manual object anchoring. [ Installation Guide | Update Guide | Troubleshooting | FAQ | All Products  | Get Help ] Easy to use Manual anchoring is not needed Perfect for price confluence studies The indicator evaluates if retracements or extensions are needed Once drawn, you can m
FREE
Value Chart Candlesticks
Flavio Javier Jarabeck
4.57 (14)
The idea of a Value Chart indicator was presented in the very good book I read back in 2020 , " Dynamic Trading Indicators: Winning with Value Charts and Price Action Profile ", from the authors Mark Helweg and David Stendahl. The idea is simple and the result is pure genius: Present candlestick Price analysis in a detrended way! HOW TO READ THIS INDICATOR Look for Overbought and Oversold levels. Of course, you will need to test the settings a lot to find the "correct" one for your approach. It
FREE
Nexora EA Monitoring System — Free Remote Position Monitor for MetaTrader 5 (VPS-Friendly) Nexora Monitor is a free, read-only MetaTrader 5 indicator that displays a live dashboard of your open positions — designed for traders who run an Expert Advisor on a VPS and want to check its status from a separate MT5 desktop terminal without remoting into the VPS itself. Attach it to a chart on any MT5 desktop terminal (Windows or Mac) logged into the same trading account and it reconstructs a clear s
FREE
Renko bricks drawn as time-anchored boxes on your ordinary chart, so brick structure and real time stay visible together. A renko brick prints when price moves a set distance, ignoring how long that takes. That strips out the sideways noise a time chart is full of. The usual way to see them is a separate offline chart, which loses the clock. This draws the same bricks over your normal candles instead, so you keep the time axis, your other indicators, and your orders. How the bricks are built Onl
FREE
Synthetic Beast
Lesedi Oliver Seilane
Synthetic Beast — Multi-Timeframe Trend & Entry Indicator (FREE) Synthetic Beast is a multi-timeframe signal indicator built for traders who want clean, confluence-based entries without screen-watching. It reads the M15 timeframe as your directional bias and the M1 timeframe for precise entries, then scores every setup so you instantly know how strong it is. How it works: The indicator combines a proprietary trend engine across two timeframes. Large arrows mark M15 trend shifts (your higher-ti
FREE
EasyTrading Panel Basic by Vexo EasyTrading Panel Basic is a free manual trade execution panel for MetaTrader 5. It provides a streamlined workflow for placing market orders with automatic risk-based lot sizing, stop loss, and take profit calculation. The panel works on any symbol and any timeframe. How It Works The panel displays on-chart with your account balance, current lot size, risk percentage, reward-to-risk ratio, and calculated stop loss. All values update in real time as you adjust par
FREE
Pivot MT5
Dmitrij Isaenko
The indicator draws daily support and resistance lines on the chart, as well as the Pivot level (reversal level). Adapted to work in MT5 The standard timeframe for calculating support and resistance levels is D1. You can choose other timeframes according to your strategy (for example, for M1-M15, the optimal timeframe for calculations is H1) The function for calculating support and resistance levels has been updated; in this calculation option, fibonacci levels are taken into account, respec
FREE
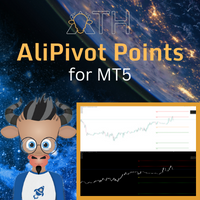
AliPivot Points is a Meta Trader 5 Indicator that draws you the latest pivot points. You can choose from timeframes ranging from 1 Minute to 1 Month. Calculation methods for pivot points includes: Classic Pivot Points Camarilla Pivot Points Fibonacci Pivot Points Woodie Pivot Points You can personalize the line colors, style, and width to suit your preference. The indicator displays values on the right side of the chart. AliPivot Points values can also be utilized by developers for creating Expe
FREE
The selective pin bar is designed to identify reversals. To use the selective pin bar effectively, traders typically look for Strong Rejection: The tail of the pin bar should extend significantly beyond the surrounding price action. It indicates that there was a sharp rejection of higher or lower prices during the trading period. A strong rejection suggests that the market sentiment may be changing.
FREE
Gli utenti di questo prodotto hanno anche acquistato
Trend Sniper X
Sarvarbek Abduvoxobov
4.86 (42)
Trend Sniper X è un indicatore trend-following multi-timeframe per MetaTrader 5 che aiuta i trader a identificare la direzione del trend e i potenziali punti di inversione con chiarezza e precisione. per MT4: https://www.mql5.com/en/market/product/193245 Informazioni sul prezzo: Il prezzo attuale è promozionale ed è soggetto a modifiche con il rilascio di futuri aggiornamenti e nuove funzionalità. Offerta Bonus: Per ricevere GRATIS l'Auto-Trade Assistant EA per questo indicatore, invia un messa
Smart Trend Trading System — MetaTrader 5 Dopo l'acquisto, inviami un messaggio su MQL5 per ricevere GRATUITAMENTE Smart Universal Expert Advisor, insieme al corso online, al manuale PDF e all'accesso al gruppo privato. STTS riunisce la direzione del trend, i segnali di entrata e uscita, le zone di inversione e i livelli di prezzo importanti direttamente sul grafico. Segui il sistema manualmente oppure collega un EA compatibile separato per eseguire le operazioni automaticamente con le impostazi
Zoryk Gold
Reda El Koutbane
4.78 (18)
ZORYK — Sistema avanzato di segnali XAUUSD per MetaTrader 5 Conosci sicuramente questa sensazione. Passi molto tempo ad analizzare l’oro. Aspetti il punto d’ingresso corretto. Finalmente apri l’operazione e il prezzo inizia immediatamente a muoversi contro di te. Chiudi troppo presto, sposti lo Stop Loss o esiti per alcuni secondi. Successivamente il mercato raggiunge esattamente l’obiettivo che avevi previsto inizialmente, ma senza di te nella posizione. Il problema non era sempre la direzione.
Un nuovo Re in città - Indicatore + Gestione ordini (TP1 + TP2 + TP3) + Invio opzionale di segnali Telegram INCLUSO (GRATIS) (SISTEMA COMPLETO DI TRADING e SEGNALI) Il nostro miglior EA per l’Oro: Gold Slayer Questo indicatore include una strategia avanzata, un sistema di trading con gestione ordini personalizzabile e un sistema mean reversion che combina estensioni di envelope, supportato da molteplici filtri intelligenti di conferma come RSI per individuare ingressi di inversione ad alta proba
M5 Sniper
MeanFX
5 (3)
Porta il tuo vantaggio nel trading sotto i riflettori! M5 Sniper è un nuovo indicatore di MeanFX. Combina segnali di trading precisi con livelli TP/SL adattivi , creando così le migliori operazioni statistiche possibili! Il prezzo aumenta ogni 5 acquisti, il prossimo prezzo è di 69$ Scrivimi dopo l'acquisto per ricevere consigli/guida e un EA bonus Cosa lo rende diverso? Performance statistica comprovata su Gold XAUUSD ( funziona su quasi ogni asset , concentrandosi sulla padronanza di un singol
SMC Intraday Formula
VividMind Digital Solutions
5 (26)
Cominciamo con la verità. Nessun indicatore da solo ti renderà profittevole. Se qualcuno ti dice il contrario, ti sta vendendo un sogno. Qualsiasi indicatore che mostra frecce perfette di acquisto/vendita può essere reso impeccabile — basta ingrandire la giusta sezione della storia e catturare solo i trade vincenti. Noi non lo facciamo.  SMC Intraday Formula è uno strumento. Legge la struttura del mercato per te, identifica le zone a più alta probabilità e ti mostra esattamente come appare la t
SuperScalp Pro
Van Minh Nguyen
4.54 (37)
SuperScalp Pro - Professional Multi-Layer Confluence Scalping System SuperScalp Pro è un indicatore di scalping avanzato che potenzia il Supertrend classico con diversi filtri intelligenti di conferma. Aiuta a individuare opportunità di trading Buy/Sell con una maggiore probabilità di successo, riducendo significativamente i falsi segnali. Le frecce Buy e Sell vengono visualizzate chiaramente direttamente sul grafico, insieme ai livelli di Stop Loss e Take Profit basati sull’ATR, calcolati autom
Auto Optimized SpeedAngle è un sistema di vettorizzazione del momento di livello istituzionale che elimina l'overfitting ( curve-fitting ) attraverso l'ottimizzazione continua Walk-Forward (WFO). Invece di affidarsi a input statici che si degradano quando i regimi di mercato cambiano, l'indicatore recalibra dinamicamente i suoi parametri utilizzando la validazione Out-of-Sample (OOS), assicurando che i segnali visualizzati rappresentino reali vantaggi statistici anziché anomalie storiche. Quadro
Boba Analysis Suite
Trade Ready Solutions LLC
5 (1)
Boba Analysis Suite Boba Analysis Suite è un indicatore di analisi per MetaTrader 5. Riunisce la struttura del mercato, le zone di prezzo rilevanti e il contesto generale del mercato in un’unica visualizzazione del grafico. Sviluppato sulla base dell’esperienza pratica come trader e formatore di trading, supporta un processo di analisi strutturato: valutare la direzione del mercato, individuare livelli importanti e analizzare congiuntamente più intervalli temporali. Analisi nel contesto del merc
GoldenX Entry MT5
VividMind Digital Solutions
5 (17)
GoldenX Entry è un indicatore per MT5 con un algoritmo adattivo Smart Entry Trend, un sistema di scoring dei segnali, un rilevatore del regime di mercato e un filtro di volatilità. Ogni segnale include un livello di ingresso calcolato, tre livelli di Take-Profit (TP1, TP2, TP3) e un livello di Stop-Loss. È costruito su più livelli analitici progettati per adattarsi a diverse condizioni di mercato, combinando un sistema analitico multilivello con un ottimizzatore integrato e un sistema di traccia
La leggenda ritorna: Entry Points Pro 10. Il rilancio del leggendario indicatore che per 3 anni è rimasto nella Top-3 del MQL5 Market. Centinaia di recensioni entusiaste (589 su due versioni), migliaia di trader lo usano ogni giorno per operare, 31.000+ download della demo   MT4+MT5 . Ho letto ogni vostra recensione degli ultimi cinque anni — e invece di promesse ho inserito nella versione 10 le risposte. Dall'autore che opera sui mercati dal 1999 e tiene all'onestà, alla propria reputazione e a
Adaptive Price Action Engine Acquista un indicatore, ricevi l'EA gratis Analisi Auto-Ottimizzata del Trend e dei Pattern Candlestick Multi-Timeframe I mercati cambiano continuamente e non tutti i pattern di Price Action hanno lo stesso valore in ogni condizione di mercato. Adaptive Price Action Engine è progettato per adattarsi alle condizioni di mercato in continua evoluzione, combinando struttura del trend, analisi Multi-Timeframe, pattern Candlestick e ottimizzazione statistica in un unico fr
ARIPoint
Temirlan Kdyrkhan
1 (4)
ARIPoint is a powerful trading companion designed to generate high-probability entry signals with dynamic TP/SL/DP levels based on volatility. Built-in performance tracking shows win/loss stats, PP1/PP2 hits, and success rates all updated live. Key Features: Buy/Sell signals with adaptive volatility bands Real-time TP/SL/DP levels based on ATR Built-in MA Filter with optional ATR/StdDev volatility Performance stats panel (Success, Profit/Loss, PP1/PP2) Alerts via popup, sound, push, or email Cu
Gann Made Easy è un sistema di trading Forex professionale e facile da usare che si basa sui migliori principi del trading utilizzando la teoria di mr. WD Gann. L'indicatore fornisce segnali ACQUISTA e VENDI accurati, inclusi i livelli di Stop Loss e Take Profit. Puoi fare trading anche in movimento utilizzando le notifiche PUSH. CONTATTAMI DOPO L'ACQUISTO PER RICEVERE GRATUITAMENTE LE ISTRUZIONI DI TRADING E OTTIMI INDICATORI EXTRA! Probabilmente hai già sentito parlare molte volte dei metodi d
M1 Sniper MT5
Oleg Rodin
5 (7)
M1 SNIPER   è un sistema di indicatori di trading facile da usare. Si tratta di un indicatore a freccia progettato per l'intervallo temporale M1. L'indicatore può essere utilizzato come sistema autonomo per lo scalping sull'intervallo temporale M1 e come parte del tuo sistema di trading esistente. Sebbene questo sistema di trading sia stato progettato specificamente per il trading sull'intervallo temporale M1, può comunque essere utilizzato anche con altri intervalli temporali. Inizialmente ho p
FiboSniper Pro
Van Minh Nguyen
5 (4)
FiboSniper Pro – Multi-Filter Fibonacci System with Auto SL/TP and Control Panel FiboSniper Pro è un indicatore tecnico che combina Fibonacci Envelopes dinamici con diversi filtri di conferma per generare segnali Buy e Sell selezionati. I livelli di Fibonacci vengono calcolati sulla base di Moving Average e ATR e successivamente filtrati tramite ADX, EMA, RSI, ATR, Volume, Time e struttura delle candele. L’indicatore visualizza direttamente sul grafico i livelli automatici di Stop Loss e Take Pr
Gold Entry Sniper
Tahir Mehmood
5 (21)
Gold Entry Sniper – Dashboard ATR Multi-Timeframe per Scalping e Swing Trading sull’Oro Gold Entry Sniper è un indicatore avanzato per MetaTrader 5 che offre segnali di acquisto/vendita precisi per XAUUSD e altri strumenti, basato sulla logica ATR Trailing Stop e l' analisi multi-timeframe . Caratteristiche e Vantaggi Analisi Multi-Timeframe – Visualizza trend su M1, M5, M15 in un'unica dashboard. Trailing Stop Basato su ATR – Stop dinamici che si adattano alla volatilità. Dashboard Professional
Tokyo mt5 Indicator
Vasiliy Strukov
5 (10)
Il Tokyo Indicator offre una chiara panoramica visiva della direzione del trend, dei potenziali segnali di trading e delle condizioni di mercato. La sua linea di trend a gradini, codificata a colori, distingue le fasi rialziste (in blu) da quelle ribassiste (in magenta). Frecce direzionali dedicate evidenziano potenziali opportunità di acquisto e vendita al variare del trend visualizzato. Una dashboard integrata riunisce in un'unica visualizzazione pratica il segnale corrente, il bias di mercato
Get Ready for Major New Features in Our Next Update — Version 2.52 Coming Soon! [NEW]  We’re taking market analysis to the next level with 4   new features designed to meet your trading needs. Introducing: TRADE OVERVIEW DASHBOARD  CONFLUENCE AT ZONE  OTE   Strong & Weak High/Low  1. TRADE OVERVIEW DASHBOARD A dashboard that helps you see the overall market picture more easily, with key information from multiple timeframes and trading guidance to support your trading decisions, helping you an
Break and Retest Hunter
Mohamed Hassan
3.67 (3)
Break and Retest Hunter is a powerful MetaTrader 5 indicator designed to automatically identify support and resistance levels, breakout structures, and potential retest opportunities in real time. Bonus Indicator: After purchasing Break and Retest Hunter , contact me to receive Trade Indicator Assistant EA completely free as a bonus utility. $65 for the next 10 copies . Next price is $120.  Combining adaptive market analysis, clear BUY/SELL signals, Fibonacci-based profit targets, and a premiu
Apex Patterns PRO Acquista l'indicatore - Ottieni GRATUITAMENTE l'Expert Advisor basato su di esso. Intelligenza auto-ottimizzante per pattern grafici e breakout Gli scanner di pattern tradizionali si basano su input fissi, registrando spesso prestazioni inferiori quando la volatilità e le strutture del mercato cambiano. Apex Patterns PRO è progettato per adattarsi alle mutevoli condizioni di mercato combinando il riconoscimento dei pattern grafici strutturali, il filtraggio del momentum e l'au
Gold Trend Coach MT5
Cristhian Alexander Gaibor Cuasquer
5 (2)
Gold Trend Coach è un indicatore di trend per l'oro (XAUUSD) su MetaTrader 5 con segnali di acquisto e vendita, stop loss e tre obiettivi di take profit, confermati alla chiusura della candela, una dashboard coach multi-timeframe e avvisi sul tuo telefono e su Telegram. Costruito per lo scalping su M5 e l'intraday su M15 durante le sessioni di Londra e New York. Gold Trend Coach: segnali di trend sull'oro XAUUSD con ingresso, stop e tre obiettivi. Prezzo di lancio $39 per le prime 20 copie, poi
Neuro Poseidon MT5
Daria Rezueva
4.75 (52)
Neuro Poseidon is a new indicator by Daria Rezueva. It combines precise trading signals with adaptive TP/SL levels - creating best possible trades as a result! Message me and get  Neuro Poseidon Assistant  as a gift to automize your trading process! What makes it stand out? 1. Proven profitability on all assets and timeframes 2. Only confirmed BUY and SELL signals present on the chart 3. Adaptive TP & SL levels generated by the software for each trade 4. Easy to understand - suitable for al
Trend Catcher ind mt5
Ramil Minniakhmetov
5 (18)
INDICATORE TREND CATCHER L'indicatore Trend Catcher analizza i movimenti dei prezzi di mercato, utilizzando una combinazione di indicatori di analisi del trend proprietari dell'autore e personalizzati. Identifica la vera direzione del mercato filtrando il rumore a breve termine e concentrandosi sulla forza del momentum sottostante, sull'espansione della volatilità e sul comportamento della struttura dei prezzi. Utilizza inoltre una combinazione di indicatori personalizzati di smoothing e filtr
Unix Scalper
Issam Kassas
4 (4)
Unix Scalper — MetaTrader 5 Dopo l'acquisto, inviami un messaggio su MQL5 per ricevere GRATUITAMENTE Smart Universal Expert Advisor, insieme al corso online, al manuale PDF e all'accesso al gruppo privato. Individua il setup. Esamina il piano. Scegli come operare. UNIX Scalper riunisce analisi di mercato, indicazioni BUY/SELL/WAIT e livelli Entry, Stop Loss, TP1 e TP2 in un unico pannello organizzato. VISUALIZZA IL SEGNALE E IL PIANO • Indicazioni chiare: BUY, SELL o WAIT. • Livelli definiti: E
Advanced Supply Demand MT5
Bernhard Schweigert
4.53 (15)
La migliore soluzione per qualsiasi principiante o trader esperto! Questo indicatore è uno strumento di trading unico, di alta qualità e conveniente perché abbiamo incorporato una serie di funzionalità proprietarie e una nuova formula. Con questo aggiornamento, sarai in grado di mostrare fusi orari doppi. Non solo potrai mostrare una TF più alta, ma anche entrambe, la TF del grafico, PIÙ la TF più alta: SHOWING NESTED ZONES. Tutti i trader di domanda di offerta lo adoreranno. :) Informazioni imp
FX Trend MT5 NG
Daniel Stein
5 (6)
FX Trend NG: La Nuova Generazione di Intelligenza di Trend Multi-Mercato Panoramica FX Trend NG è uno strumento professionale di analisi del trend multi-timeframe e monitoraggio dei mercati. Ti consente di comprendere la struttura completa del mercato in pochi secondi. Invece di passare tra numerosi grafici, puoi identificare immediatamente quali strumenti sono in trend, dove il momentum sta diminuendo e dove esiste un forte allineamento tra i timeframe. Offerta di Lancio – Ottieni FX Trend NG
Presentazione       Quantum Breakout PRO   , l'innovativo indicatore MQL5 che sta trasformando il modo in cui scambi le zone di breakout! Sviluppato da un team di trader esperti con un'esperienza di trading di oltre 13 anni,       Quantum Breakout PRO       è progettato per spingere il tuo viaggio di trading a nuovi livelli con la sua strategia innovativa e dinamica della zona di breakout. Quantum Breakout Indicator ti fornirà frecce di segnalazione sulle zone di breakout con 5 zone target di
Scalper Vault è un sistema di trading potente e completo, progettato per i trader che desiderano ottenere risultati costanti nel trading intraday. Questo indicatore ad alta precisione funge da sistema di trading autonomo, offrendo analisi di livello istituzionale sia per il mercato Forex che per le Opzioni Binarie. CONTATTAMI DOPO L'ACQUISTO PER RICEVERE I MIEI CONSIGLI DI TRADING E UN FANTASTICO BONUS! Eliminando le congetture e le complesse analisi manuali, Scalper Vault ti permette di concen
Volatility Master for MetaTrader is a real-time dashboard tool that scans up to  50 symbols  to identify high-volatility , trending markets instantly. With bullish/bearish signals, customizable alerts, and a user-friendly interface, it helps you avoid range-bound conditions and focus on high-probability trades. Clarity leads to confidence. Trade confidently and protect your capital effectively with this powerful dashboard. We don't offer free or bonus indicators in exchange of reviews from you.
Altri dall’autore
Daily and Previous Day Levels draws the reference levels intraday traders check every morning: the previous day's high, low and close, today's open, today's running high and low, and the previous week's high and low. How it works - Values come straight from the symbol's own D1 and W1 bars, so the day follows your broker's server day. - Each day gets its own line segment, from the day's first bar to its last. Past days stay readable and old lines never shift. You choose how many days to keep (5
FREE
Session Boxes draws the Asia (Tokyo), Europe (London) and US (New York) trading sessions as rectangles on an intraday chart. Each box spans the session's high and low, so you can see where each market traded, how wide the range was and where sessions overlap. How it works - Session hours are entered in each market's local time (Tokyo 09:00-18:00, London 08:00-17:00 and New York 08:00-17:00 by default). - UK and US daylight saving are applied automatically, so the boxes stay on the right bars al
FREE
ATR Stop Levels draws price levels a chosen number of ATRs below and above the current price. It shows at a glance where a volatility-based stop would sit for a long or a short position, without measuring by hand. How it works - ATR (Average True Range) measures the typical bar range. You can smooth it with RMA (Wilder's original method), SMA or EMA. - Up to three multipliers (1.5, 2 and 3 by default). Each draws a dashed level below price and one above, with a label showing the price and the d
FREE
Market Sessions Clock is a small panel that shows, at a glance, which markets are open right now and when the next one opens or closes. How it works - Four sessions: Sydney, Tokyo, London and New York. Each has its own on/off switch and hours. - Hours are entered in each market's local time (for example 08:00-17:00 London), and daylight saving is applied automatically for Sydney, London and New York. - For every session the panel shows Open or Closed, the time left until it closes or until it n
FREE
Average Daily Range (ADR) Panel shows how far a symbol usually travels in a day and how much of that typical range today has already covered. It is a quick way to judge whether today is quiet, normal or unusually active. How it works - The daily range is the D1 bar's high minus its low. ADR is the average of that range over the last 5, 10 and 20 completed days; today's unfinished day is not included. - Today's range is the current D1 bar's high minus its low so far. - "Used of ADR" is today's r
FREE
ATR Volatility Percentile answers a simple question: is the market quiet or busy compared with its own recent past? Raw ATR values are hard to compare across symbols and periods. A percentile puts them on one 0-100 scale. How it works - ATR (Average True Range, Wilder's smoothing, length 14 by default) measures the typical bar range. - The indicator compares the current ATR with the previous N values (250 bars by default). The percentile is the share of those values that were lower than or equa
FREE
ATR Trailing Stop Line draws where a volatility-based trailing stop would sit. For a long position the line stays a fixed number of ATRs below the highest point reached. For a short position it stays above the lowest point. The line only moves in the position's favour and never moves back. How it works - ATR (Average True Range, Wilder's smoothing) measures the typical bar range. The line sits a chosen multiple of it (3 by default) away from price. - On each bar the line is pulled up (long side
FREE
Account Info Panel puts the numbers you check most often into one small panel on the chart, so you do not have to switch to the Trade tab. What it shows - Balance and equity. - Floating P/L of open positions. - Closed today: profit, swap, commission and fees of deals closed since the start of the server day. Deposits and withdrawals are excluded. - Margin used and free margin. - Margin level, highlighted when it falls below 200%. - Today's drawdown: how far equity is below its level at the star
FREE
Correlation Matrix shows how closely up to six symbols have moved together. It helps to avoid holding several positions that are really the same bet, and to see when a usual relationship between markets breaks down. How it works - The reference bars are the last N closed bars (60 by default) of the chosen timeframe (D1 by default) on the chart symbol. - For each symbol the indicator finds the bar at the same time with iBarShift and takes its return, so symbols with different trading hours are c
FREE
Currency Strength Meter ranks the eight major currencies (USD, EUR, GBP, JPY, CHF, CAD, AUD, NZD) from strongest to weakest over a recent period. It uses all 28 pairs they form, so it shows whether a move belongs to one currency or to the other side of the pair. How it works - For each pair the indicator takes the percent change between the last closed bar and the bar N bars before it on the chosen timeframe (24 H1 bars by default). - A currency gains that change when it is the base of a pair a
FREE
Drawdown Monitor keeps an eye on your account and tells you how deep the current drawdown is. Its alerts fire before a bad day turns into a worse one. How it works - DD from peak: how far equity is below its highest value. The peak is stored in a terminal global variable per account, so it survives restarts. It can be reset with an input. - Floating DD: how far equity is below balance, which is the loss on open positions. - Today DD: how far equity is below the equity at the start of the server
FREE
Fibonacci Auto Levels draws Fibonacci retracement levels automatically, so you do not have to drag the Fibonacci tool by hand every time the chart moves. How it works - The indicator looks at the last N bars (100 by default) and finds the highest high and the lowest low. - The direction follows which extreme came last. - Low after the high: the last swing was down. Level 0 sits at the low and level 1 at the high, so the levels show how far price has bounced back up. - High after the low: the la
FREE
Heikin Ashi Smoothed draws a cleaner version of Heikin Ashi candles. Regular Heikin Ashi already averages prices to reduce noise; this version smooths twice, before and after the Heikin Ashi step, so small swings disappear and longer moves stand out. How it works 1. The bar's open, high, low and close are smoothed with an exponential moving average (length 10 by default). 2. Heikin Ashi candles are built from those smoothed prices: close = average of the four prices, open = midpoint of the prev
FREE
Inside/Outside Bar Highlighter colours two common candle patterns so they are easy to spot on any chart: - Inside bar: the bar's high is below the previous high and its low is above the previous low. The range has contracted inside the previous bar. - Outside bar: the bar's high is above the previous high and its low is below the previous low. The range has expanded beyond the previous bar on both sides. How it works - The indicator draws a coloured candle on top of each matching bar. Inside ba
FREE
Multi-Timeframe Trend Panel shows, in one small panel, what a moving average is doing on four timeframes at once (M15, H1, H4 and D1 by default). You can see whether the timeframes agree without switching charts. How it works - For each timeframe the indicator reads the moving average (EMA 50 by default) on the last closed bar and on the bar a few bars before it (5 by default). - The change between the two is compared with ATR(14) of the same timeframe: - rising when the average went up by more
FREE
Opening Range Levels marks the high, low and middle of the opening range, the first minutes of a session you choose, and carries those levels through the rest of the day. How it works - You set the window and its time zone: New York (default 09:30-10:00), London, Tokyo or your broker's server time. - US and UK daylight saving are applied automatically. Your broker's server offset is detected from the terminal; most brokers shift their clock with US daylight saving, which is the default, and a f
FREE
Day and Week Separators draws vertical lines at the start of each day, week and month on intraday charts, with an optional day-of-week label at each line. It is a small visual aid that makes it easier to see where one trading day ends and the next begins. How it works - Day, week and month separators each have their own switch, colour and line style. - When several periods start on the same bar, only the strongest line is drawn: month over week, week over day. - The trading day can start at the
FREE
Pivot Points draws the classic floor-trader levels from the previous day, week or month: a central pivot plus resistance (R) levels above and support (S) levels below. Three common formulas are included. Formulas (H, L, C = previous period's high, low, close; P = (H + L + C) / 3; range = H - L) - Classic: R1 = 2P - L, S1 = 2P - H, R2/S2 = P ± range, R3 = H + 2(P - L), S3 = L - 2(H - P). - Fibonacci: P ± 0.382, 0.618 and 1.000 × range. - Camarilla: C ± range × 1.1/12, 1.1/6, 1.1/4 and 1.1/2 (R1-
FREE
Previous Session High Low Alerts marks the high and low of the last completed trading session and alerts you when price comes back to them. Many traders watch where the previous Asian, London or New York session topped and bottomed. This indicator draws those levels and notifies you when they are touched. How it works - You set one session by its start and end in server time (default 10:00-19:00, which matches London hours on many brokers whose servers run at GMT+2/+3). Sessions may run past mi
FREE
Round Number Levels draws horizontal lines at round prices around the current price, for example every 50 dollars on gold, every 100 pips on EURUSD or every 1,000 on Bitcoin. Many traders watch these "psychological" prices, so it is useful to have them on the chart without drawing them by hand. How it works - With the automatic step, the minor step is about one hundredth of the price, rounded to 1, 2 or 5 times a power of ten. Gold near 4,000 gives 50, EURUSD near 1.10 gives 0.01, and Bitcoin n
FREE
Spread Monitor and Logger keeps a record of your broker's spread on the current symbol. It shows when spreads widen (rollover, news, quiet hours) and keeps a simple log you can open in a spreadsheet. How it works - Every second the indicator reads the current spread in points. A sample is only counted while the symbol is quoting (a new tick in the last minute), so closed hours do not pull the statistics down. - The panel shows the current spread, the average, minimum and maximum of the current
FREE
Spread and Swap Info shows the trading costs and timing details of the current symbol in a small panel, so beginners can check them without opening the symbol specification. What it shows - Spread in points, with "(fixed)" when the broker quotes a fixed spread. - Swap long / short with the right unit for the symbol's swap mode: points, a currency (base, margin or account currency), percent per year, or "reopen". When swaps are disabled or both are zero it shows "Swap: none". - Triple swap day,
FREE
Swing High Low Levels marks confirmed swing highs and lows and extends each one to the right as a horizontal level until price breaks it. At a glance you can see which recent swings are still intact and which have already been taken out. How it works - A swing high is a bar whose high is above the highs of the bars on its left and not exceeded by the bars on its right (10 left and 5 right by default). A swing low works the same way with lows. - A swing is confirmed only after the bars on its ri
FREE
Volume Profile shows where volume has built up by price over the last N bars. It draws a horizontal histogram to the right of the last bar and marks three reference levels: the Point of Control, and the high and low of the Value Area. How it works - The price range of the last N bars (200 by default) is split into rows (40 by default). - Each bar's volume is spread evenly over its high-low range and added to the rows it touches. You can use tick volume (always available in MT5) or real volume w
FREE
Session and Anchored VWAP plots the volume-weighted average price (VWAP), the average price paid in a period weighted by volume. Two versions are included: one that resets every day, week or month, and one anchored at a moment you choose. How it works - Periodic VWAP: starts fresh at the beginning of each day (broker server time), each week (Monday) or each month, and accumulates price × volume from there. - Up to two bands at a chosen number of standard deviations show how far price has moved
FREE
Watchlist Scanner puts the key numbers of up to 20 symbols in one panel on any chart, so you can compare markets without opening a chart for each. Columns - Last: current bid. - Chg %: change since the previous daily close, green when up and aqua when down. - Spread: current spread in points. - ATR D1 (%): the daily Average True Range over the last 14 completed days, in price and as a percent of price. It shows how much each symbol typically moves in a day, on a comparable scale. - Range/ATR: t
FREE
Filtro:
Nessuna recensione
Rispondi alla recensione