TLID Volume Profile
- Indicatori
-
Robby Suhendrawan
 Sviluppatore esperto MT4 e MT5 | Oltre 12 anni di esperienza nel trading
 - Versione: 1.0
- Attivazioni: 9
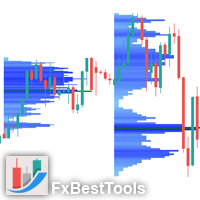
Volume Profile is one of the most powerful analytical tools used by professional and institutional traders. Unlike traditional volume indicators that only show when trades occurred at the bottom of your screen, Volume Profile shows exactly at what price levels those trades happened. This gives you a clear, X-ray vision of the market structure, allowing you to see exactly where smart money and institutions are accumulating or distributing their positions.
How Volume Profile Detects Institutional Orders and Support/Resistance
By plotting volume horizontally against the price scale, this indicator naturally reveals the true supply and demand zones based on actual historical transactions. Based on standard Volume Profile rules, here is how you can read the market:
Point of Control (POC) This is the specific price level that has the highest traded volume within the selected period. The POC represents the fairest price accepted by both buyers and sellers. Institutions build their massive positions around this level. In trading, the POC acts as a massive magnet and a very strong Support or Resistance level. If the price moves far away from the POC, it often naturally gravitates back to it.
Value Area (VA) This is the price range where the majority of trading volume took place, typically set to 70 percent of the total volume. It is bounded by the Value Area High (VAH) and Value Area Low (VAL). When the price is inside the Value Area, the market is in balance. When the price breaks outside the Value Area High or Low, it signals that institutions are aggressively pushing the price to find a new fair value, creating powerful breakout setups. The VAH and VAL lines themselves act as dynamic support and resistance levels.
High Volume Nodes and Low Volume Nodes Thick profile areas are High Volume Nodes, representing high liquidity and strong structural support or resistance. Thin profile areas are Low Volume Nodes, representing low liquidity. Because there is very little historical interest in these thin zones, the price tends to shoot through them very quickly.
Pro Interactive UI and Smart Modes
One of the biggest advantages of this indicator is the on-chart Pro UI panel. You no longer need to open the indicator settings repeatedly to change how you view the market. With just a single click on your chart, you can instantly switch between four highly advanced analytical modes:
Daily Mode Automatically plots a separate volume profile for every single trading day. This is essential for day traders who need to see the previous day POC, VAH, and VAL to plan their daily bias and intraday support/resistance levels.
Session Mode Automatically divides the profile based on major global trading sessions. You can set specific hours for the Asia, London, and New York sessions. This allows you to see the exact volume footprint left by European or US institutions and trade the session overlaps with high accuracy.
Zigzag Mode Automatically draws volume profiles over market swings and trends using algorithmic zigzag calculations. This is an incredible tool for swing traders to analyze the volume distribution within a specific bullish or bearish price wave.
Fixed Range Mode Total freedom at your fingertips. Simply select the Fixed Range button, click twice anywhere on your chart to mark a start and end time, and the indicator will instantly calculate and draw a custom volume profile specifically for that highlighted area. Perfect for analyzing specific consolidations or macro structural zones.
Additional Key Features
Buy and Sell Volume Split The indicator does not just show total volume. It visually splits the histogram bars into aggressive buying volume and aggressive selling volume based on tick price movements. This tells you exactly who was in control at a specific price level.
Integrated VWAP The indicator includes a toggleable Volume Weighted Average Price curve. VWAP is heavily used by algorithmic trading bots and institutions as a baseline for trend direction and fair price valuation.
Fully Customizable You have complete control over the visual aesthetics. You can adjust the density of the volume rows, the exact percentage of the Value Area, and all the colors for the background, session borders, and text labels to perfectly match your charting style.
--- MT4 Version is Here ---
https://www.mql5.com/en/market/product/195637
Your success is my priority. If you love this product, I would greatly appreciate a 5-star review! If you need any assistance with setup or have feature requests, please send me a direct message before leaving feedback. I am always here to help.
Subscribe to TradingLabs ID Channel: https://www.mql5.com/en/channels/tradinglabsid
Check out all my premium trading tools: https://www.mql5.com/en/users/suhendrawan/seller
Contact me for fast support: https://www.mql5.com/en/users/suhendrawan