Multi Timeframe MACD Momentum
- Indicatori
-
Andrea Bonotto
 I have been operating as an independent trader on FOREX for over 10 years, gaining significant experience in implementing programs for Metratrader 4.
 - Versione: 1.0
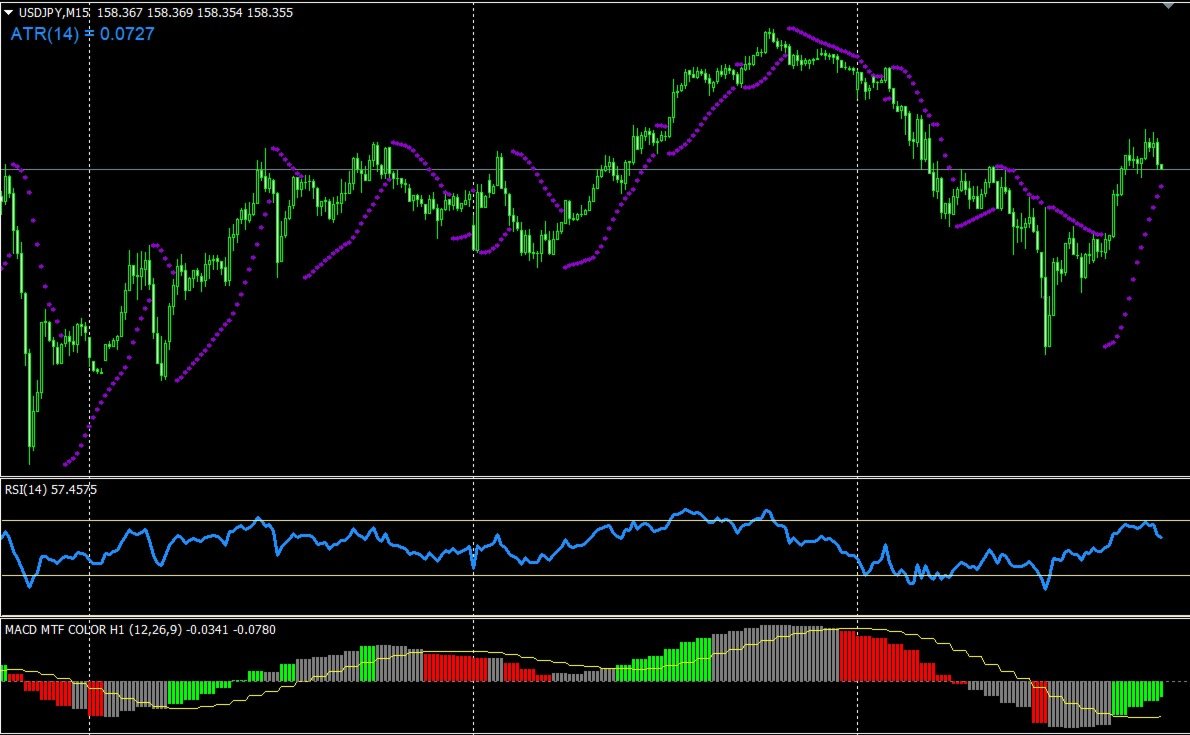
MACD MTF Timeframe Independent Colorized is a MetaTrader 4 indicator designed to make MACD momentum easier to read while allowing the MACD calculation timeframe to be completely independent from the chart timeframe.
Unlike a standard MACD that always follows the timeframe of the active chart, this indicator can calculate its values from a separately selected timeframe. For example, you can keep an M5 chart open while displaying an H1 or H4 MACD, making it useful for multi-timeframe analysis without having to switch charts continuously. The available source timeframes are the current chart timeframe, M5, M15, H1, H4, D1, W1 and MN1. MACD_MTF_Timeframe_Indipendente…
The indicator uses the standard MACD calculation with configurable Fast EMA, Slow EMA, Signal period and Applied Price. The default parameters are the traditional 12/26/9 settings applied to the closing price. The number of chart bars to process can also be limited through the BarsToCompute parameter. MACD_MTF_Timeframe_Indipendente…
How the coloring works
The indicator does not simply color the histogram according to whether the MACD is above or below zero.
For every bar, it calculates:
MACD difference = MACD Main − Signal Line
It then compares this difference with the value from the previous MACD bar. MACD_MTF_Timeframe_Indipendente…
The histogram is displayed in three different states:
- Green – Bullish momentum strengthening: the MACD Main is above the Signal line and the distance between them is increasing.
- Red – Bearish momentum strengthening: the MACD Main is below the Signal line and the negative distance between them is increasing.
- Gray – Neutral / non-confirmed momentum: all other situations, including cases where the MACD/Signal separation is contracting or where the movement does not satisfy the bullish or bearish momentum conditions. MACD_MTF_Timeframe_Indipendente…
The height of the colored histogram represents the MACD Main value itself, while the Signal line is plotted separately in yellow. A zero reference line is also displayed in the indicator window. MACD_MTF_Timeframe_Indipendente…
This distinction is important: the colors describe the behavior of the distance between the MACD and its Signal line, while the histogram position and magnitude continue to represent the actual MACD Main value.
Independent multi-timeframe operation
When the selected MACD timeframe is different from the chart timeframe, each chart bar is mapped to the corresponding bar of the selected MACD timeframe. This allows the same higher-timeframe MACD state to be displayed directly on a lower-timeframe chart. MACD_MTF_Timeframe_Indipendente…
For example:
- M5 chart + H1 MACD: useful for monitoring short-term price action while keeping the broader hourly momentum visible.
- M15 chart + H4 MACD: useful for combining an execution timeframe with a slower directional filter.
- H1 chart + D1 MACD: useful for viewing intraday movements within the context of daily momentum.
- Selecting Chart Timeframe makes the indicator behave as a normal same-timeframe MACD with the additional momentum coloring.
Because the current source-timeframe bar is included in the calculation, the color and values of the most recent bar can change while that source bar is still forming. Once the source-timeframe candle is closed, its MACD values are fixed by the underlying historical data.
Possible uses
The indicator can be used as a momentum filter. A trader may, for example, give more weight to long setups while the histogram is green and to short setups while it is red. Gray can be interpreted as a phase in which momentum is not strengthening in either of the two defined directions.
It can also be used for multi-timeframe confirmation. Instead of opening several charts, a trader can display a higher-timeframe MACD directly on the trading chart and compare lower-timeframe price action with the momentum condition of the higher timeframe.
Another possible use is momentum transition analysis. A change from green or red to gray indicates that the previous expansion between MACD and Signal is no longer continuing under the indicator's rules. Conversely, a transition from gray to green or red identifies a new phase in which bullish or bearish MACD/Signal separation is strengthening.
The indicator may also be combined with price-action tools, support/resistance levels, trend-following indicators, volatility filters or other entry conditions. It is intended primarily as a visual analysis and filtering tool rather than as a complete standalone trading system.
Inputs
The main user-configurable parameters are:
- Timeframe – MACD calculation timeframe, independent from the chart.
- Fast EMA – fast MACD moving-average period.
- Slow EMA – slow MACD moving-average period.
- Signal period – MACD Signal line period.
- Applied Price – price series used for the MACD calculation.
- Bars To Compute – maximum number of chart bars processed and displayed. MACD_MTF_Timeframe_Indipendente…
The indicator does not place, modify or close trades. It provides a visual representation of MACD direction and momentum behavior that can be incorporated into discretionary or systematic trading methods.