Chart Sync Candle

Chart Sync — Sincronizzazione di mirino, salto e disegni tra grafici

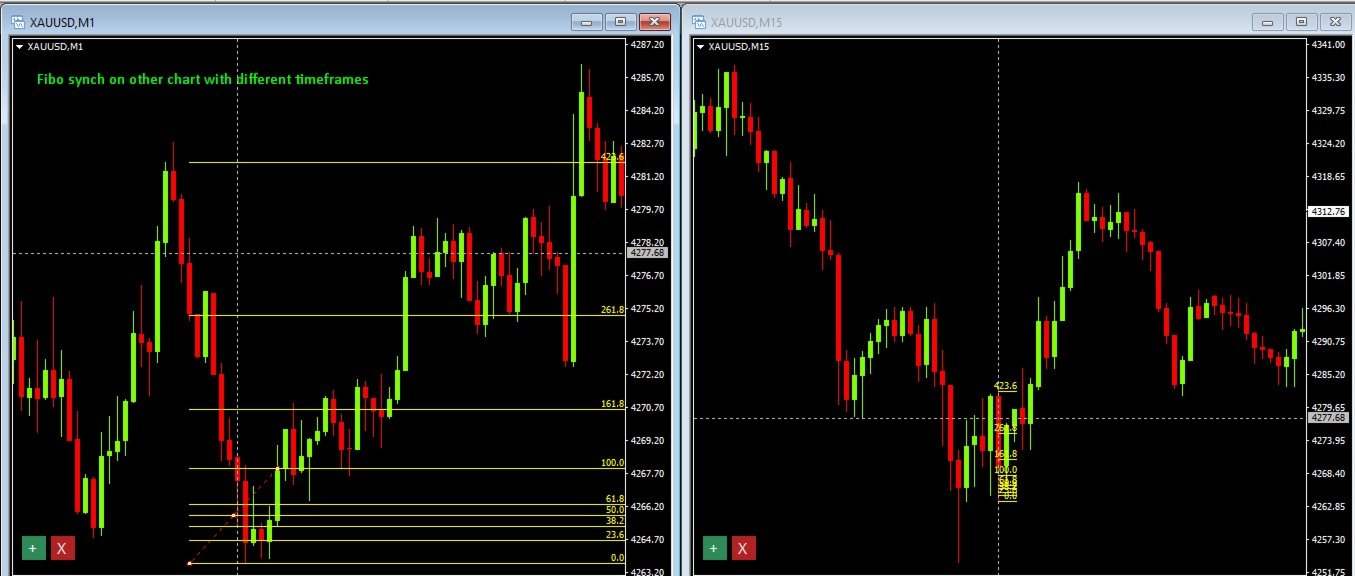
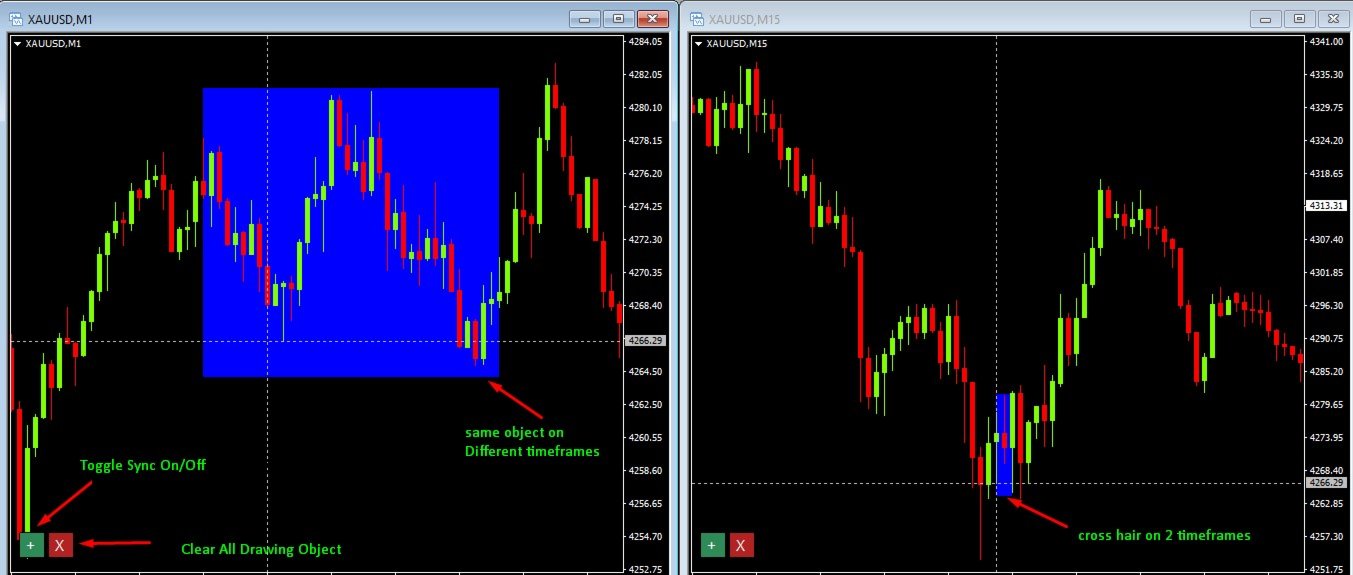
Sincronizza in tempo reale il movimento del mirino, la navigazione a salto al clic e gli oggetti disegnati tra più grafici —pensato per l'analisi multi-timeframe e multi-simbolo.

Caratteristiche principali

  • Sincronizzazione in tempo reale del mirino su tutti i grafici collegati
  • Navigazione a salto al clic — tutti i grafici collegati si centrano sul punto temporale cliccato
  • Sincronizzazione live dei disegni (linee di tendenza, linee H/V, rettangoli, canali, Fibonacci — inclusi livelli e colori personalizzati)
  • Collegamento basato su gruppi — esegui più gruppi di sincronizzazione indipendenti contemporaneamente
  • Blocco opzionale sullo stesso simbolo per confrontare i timeframe di uno stesso strumento
  • Pannello a un clic direttamente sul grafico, senza menu
  • Leggero — nessuna DLL, nessuna dipendenza esterna

Per chi è adatto

  • Trader multi-timeframe che segnano un grafico e vogliono che si rifletta ovunque
  • Trader che confrontano più simboli fianco a fianco
  • Chiunque sia stanco di ridisegnare manualmente la stessa analisi su più finestre di grafico

Parametri

  • Group ID — Collega i grafici tramite nome del gruppo; solo i grafici con lo stesso Group ID si sincronizzano.
  • Same Symbol Only — Limita la sincronizzazione ai grafici che mostrano lo stesso strumento.
  • Start On — Imposta se la sincronizzazione è attiva per impostazione predefinita quando l'indicatore viene collegato.
  • Copy Existing On Start — Copia gli oggetti già disegnati sui grafici collegati quando la sincronizzazione viene attivata.
  • Crosshair Color — Imposta il colore delle linee del mirino sincronizzate.
  • User-Drawn Only — Sincronizza solo gli oggetti disegnati manualmente, ignorando quelli generati dagli indicatori.
  • Show Panel — Mostra o nasconde i pulsanti di attivazione sul grafico.
Prodotti consigliati
FiboZag
Andriy Sydoruk
Indicator FiboZag - transfer the indicator to the chart and the Fibonacci levels will be built automatically on the last ZigZag turn. The main advantage lies in the correct construction of Fibonacci levels and markup of price levels. Simple, visual and effective use. The indicator is not redrawn and does not lag. Works on all currency pairs and on all timeframes.
MA bounce LITE arrows is simplified version of main indicator MA bounce . It's for people who don't need to use all features of main indicator. Lite version shows only arrows on chart when there is high probability of price bounce from selected MA. MA bounce LITE arrows input settings: Current MA period  - period of moving average on current TF Current     MA type   - moving average calculation method  on current TF Current     MA applied price   - applied price of moving average  on current TF
VaviStar è un indicatore basato sui ritracciamenti di trend determinati da segmenti ZigZag. Si teorizza, e le statistiche confermano, che le quotazioni reagiscono a determinati livelli di ritracciamento. Molti usano i livelli di ritracciamento di Fibonacci (23.6%, 38.2%, 61.8%). Si suppone che, una volta che il prezzo vada oltre il 61.8% di ritracciamento, si possa già parlare di inversione di trend. Questo indicatore permette di avere comodamente a grafico un segmento dello ZigZag con i relativ
Auto AndrewFork
Noor Ghani Rahman
1 (1)
Auto Pitchfork Indicator The indicator calculate the Pitch fork for the previous Day (Selectable) with multiple Support and Resistance lines from the Median price which acts as Magnet for the Price that if price touch the above warning (1) or below warning (1) lines and not cross up or down then there is maximum possibilities that it will return to the Median Line, and thus maintain the Price Action in Cyclic Pattern to the Market Move. You are able to select how many warning lines you want to k
Quick Drawing MT4 – Lo strumento di charting definitivo in un clic (100% GRATIS) Stanco di navigare costantemente tra i menu predefiniti di MetaTrader 4 solo per disegnare un semplice rettangolo o una trendline? Per i trader che fanno affidamento su precisione e velocità, in particolare i trader di Price Action, Smart Money Concepts (SMC), Inner Circle Trader (ICT), Supply & Demand (SND) e Support & Resistance (SNR), ogni secondo conta. Marcare i grafici dovrebbe essere un'operazione fluida, non
FREE
Demark mtf
Sergey Fionin
The indicator shows De Mark patterns and gives trading signals in the form of arrows and alerts. Shows De Mark lines on the history of quotes. Has a multiframe., Can show DeMark patterns of higher timeframes on lower timeframes. Has a switchable function for displaying fractals. Trading signals are accompanied by sound alerts, as well as sending them to mail and mobile devices.
The Auto Super Pivot indicator is an indicator designed to calculate support points and resistance points for pivot points. this indicator has the ability to calculate standard pivot, fibonacci, camarilla, woodie and demark pivot points. It also allows you to use all time zones with the time frame feature. Another feature of the indicator is the auto time slice feature. This feature allows automatic calculations without having to set any time zone. Features 6 different pivot calculation modes A
Watermark per Grafici in Stile TradingView Trasmuta i tuoi grafici di MetaTrader 4 rendendoli eleganti e professionali come quelli di TradingView. Sei stanco dell'aspetto predefinito e semplice di MetaTrader? WaterMark MT4 è un indicatore leggero e completamente personalizzabile, progettato per migliorare la tua esperienza di charting aggiungendo filigrane eleganti e moderne direttamente al tuo terminale di trading. Questo indicatore colma il divario visivo tra i grafici standard di MetaTrader e
FREE
VR Pivot
Vladimir Pastushak
VR Pivot is an indicator of key pivot points. Pivot points are a special type of support and resistance levels that are used to determine the strongest price zones. Professional traders use pivot levels to determine prices at which there is a high probability of a price reversal. The levels are calculated using special mathematical formulas, which include the closing, opening, high, and low prices of the previous time period. The most effective is the daily period. It is important to note that a
Possible Price reversals levels - based on  Fibonacci + Support +  Resistance Levels Auto levels drawn based on input index (Bars Count )  ---->>> Price Over 50% Fibo line ---> UP TREND ---> BUY when price drop near Support Lines  ---->>> Price Down 50% Fibo line ---> DOWN TREND ---> SELL when price goes up  near Resistance Lines  --->>> The more close price levels ----> the more possibility for price reversals --->>> are you a scalper --> try it on M1 charts with big index like 5000 bars  or
Smart Trendlines
Suvashish Halder
5 (2)
Smart Trendlines – No.1 Trendlines Indicator Smart Trendlines is a precision tool that automatically draws trendlines based on every valid pivot point, helping traders identify key support and resistance zones. It continuously adjusts as new market pivots form, providing a live and accurate reflection of price structure. Whether you’re tracking trends, preparing for reversals, or anticipating breakouts — this indicator keeps you one step ahead. It works seamlessly across all assets including For
support resistance levels indicator mt4: Questo strumento è un indicatore multi-timeframe che identifica e traccia le linee di supporto e resistenza, così come i livelli di Fibonacci, su un grafico con la stessa precisione dell'occhio umano. I livelli di supporto e resistenza TW per il forex hanno un algoritmo complesso che scansiona il grafico per identificare i precedenti livelli di stabilizzazione dei prezzi e rimbalzi, registrando il numero di tocchi. Sei stanco di disegnare manualmente i
The indicator plots flexible support and resistance levels (dots). A special phase of movement is used for construction. Levels are formed dynamically, that is, each new candle can continue the level or complete it. The level can provide resistance or support to the price even where it is no longer there. Also, support and resistance levels can change roles. The importance of levels is affected by: the amount of time the level is formed and the number of touches. The significance of these lev
Fibonacci Trend Marker   — è un indicatore di tendenza che analizza il comportamento della candela corrente rispetto all’intervallo Alto-Basso (High-Low, HL) delle candele precedenti utilizzando i livelli di ritracciamento di Fibonacci. Monitora visivamente la forza del trend, segnalando un possibile indebolimento o inversione attraverso un cambio di colore della candela. Caratteristiche: Progettato per trader orientati al trend, aiuta a identificare rapidamente i cambiamenti di tendenza basat
TD Combo is better when you have sharp directional moves, because it requires only thirteen price bars from start to finish compared to TD Sequential which needs at least 22 bars. The criteria for a Setup within TD Combo are the same with those required for a Setup within TD Sequential. The difference is that the count starts at bar 1 of the setup and not from bar 9 and TD Combo requires four conditions to be satisfied simultaneously. Requirements for a TD Combo Buy Countdown - Close lower or
Super Trend Channels MT4 Indicator Looking for a versatile and powerful channel indicator for your MetaTrader 4 trading platform? Look no further than the "Super Trend Channels" indicator! This advanced tool is designed to help traders identify trend channels accurately, enabling you to make informed trading decisions with confidence. Key Features: Multi-Channel Support: The "Super Trend Channels" indicator supports multiple channels simultaneously. You can visualize various channel types, inclu
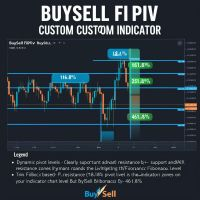
BuySell FibPiv Fibonacci Pivot Level Indicator with Dynamic Support and Resistance Zones Overview BuySell FibPiv is a Fibonacci pivot-based technical analysis indicator designed to calculate dynamic support and resistance levels using previous session price data. The indicator applies Fibonacci expansion and retracement calculations to generate multiple pivot-based levels for intraday and swing trading analysis. It provides: Central pivot calculation Fibonacci-based support and resistance zones
Smart Pivot Points per MetaTrader 4: Livelli chiari per un trading intelligente Smart Pivot Points è un indicatore professionale per MetaTrader 4 che calcola e visualizza automaticamente un set completo di livelli di trading chiave sul grafico. Trasforma il caos dell'andamento dei prezzi in una mappa chiara e strutturata, evidenziando supporto, resistenza, equilibrio dei prezzi e potenziali zone target. Progettato per i trader che apprezzano la chiarezza, lo strumento funziona su qualsiasi merc
TCL Auto Pivot Points
Stratos Digital (PVT) Ltd
TCL Auto Pivot Points is a daily, weekly, and monthly pivot-point indicator for MetaTrader 4. It calculates classic institutional support and resistance levels (R1 through R3 and S1 through S3) using a choice of four formulas and plots them automatically on the chart. What It Plots The indicator draws seven horizontal lines: the central Pivot Point (P), three Resistance levels (R1, R2, R3) above it, and three Support levels (S1, S2, S3) below. The lines update at the start of each pivot period (
FREE
A Fibonacci indicator is best used with other indicators like Pivots, Support/Resistance etc. Price tends to use Fibo levels as Support or Resistance lines. So, this indicator is very useful to know when price might reverse or if a level is crossed, price might continue the trend. Also, to find the best Take Profit and StopLoss lines. Don't use Fibo Indicator alone for trading as it might not always be accurate. Use it to make your strategies better as a supporting indicator. Settings: Auto Fib
FREE
Investment Castle Support and Resistance MT4
Ahmed Alaaeldin Abdulrahman Ahmed Elherzawi
4.71 (7)
Investment Castle Support & Resistance — Automatic Buy/Sell Levels Stop drawing support and resistance by hand. This indicator maps the key Buy and Sell levels for you automatically and colours the candles by bias, so the side the market favours is obvious at a glance. It is the same Support & Resistance engine built into the Investment Castle EA. What it does for you Automatic Buy/Sell levels: support and resistance are detected and plotted for you — no manual drawing. Colour-coded bias: cand
FREE
Pivot Trend
Harun Celik
5 (2)
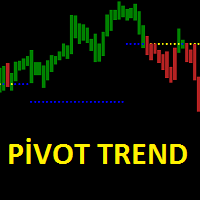
Pivot trend indicator is a trend indicator that uses standard pivot calculation and some indicators. The purpose of the indicator is to calculate the possible trends using the pivot point. And to give the user an idea about trend direction. You can use this display as a trend indicator. Or with other indicators suitable for your strategy. Features The green bar represents the upward trend. The red bar represents the downward trend. The blue pivot point represents the upward trend. The yellow pi
Fibo Linear Channel
Igor Semyonov
4 (1)
Colored indicator of the linear channel based on the Fibonacci sequence. It is used for making trading decisions and analyzing market sentiment. The channel boundaries represent strong support/resistance levels, as they are the Fibonacci proportion levels. Users can select the number of displayed lines of channel boundaries on the chart by means of the input parameters. Attaching multiple instances of the indicator to the chart with different calculation periods leads to displaying a system of c
Provides instant signals on the chart in panel form. Equipped with signal description and trading analysis tools such as drawing auto trendlines, support/resistance area, regression channel, Fibonacci levels, Pivot levels and current signal price, signal time, signal expiry and stoploss recommendation. Also sending alert messages to all available mt4 alert tool. A detailed description panel provides information about where the signal comes from and what indicators are behind the signal. Includin
Italo Volume Indicator
Italo Santana Gomes
4.92 (79)
BUY INDICATOR AND GET EA FOR FREE AS A BONUS + SOME OTHER GIFTS! ITALO VOLUME INDICATOR  is the best volume indicator ever created, and why is that? The Indicator works on all time-frames and assets, indicator built after 7 years of experience on forex and many other markets. You know many volume indicators around the internet are not complete, does not help, and it's difficult to trade, but the Italo Volume Indicator is different , the Italo Volume Indicator shows the wave volume, when market
Mean Reversion Supply Demand Indicator Mean Reversion Supply Demand is the indicator to detect the important supply demand zone in your chart. The concept of supply demand trading relies on the quantity mismatching between buying and selling volumes in the financial market. Typically, supply demand zone serves to predict the turning point. The wave pattern, for any supply demand zone to work as an successful trade, looks like the price must touch the base zone, move away and then return to zone
NO REPAINT ADVANCED CHART PATTERN INDICATOR By definition, a price ( chart)  pattern is a recognizable configuration of price movement that is identified using a series of  trendlines  and/or curves. When a price pattern signals a change in trend direction, it is known as a reversal pattern; a continuation pattern occurs when the trend continues in its existing direction following a brief pause. Advanced Chart Pattern Tracker is designed to find the MOST ACCURATE patterns. A special script is a
This is the Full Version, to get the free version please contact me. The free version works on “GBPCHF” charts. All symbols and time frames scanner. Harmonic Pattern Harmonic patterns are used in technical analysis that traders use to find trend reversals. They are considered one of the most accurate technical analysis tools, as they allow traders to predict the future price movement direction and the potential trend targets. Also, unlike many other technical tools, the number of false signals
RelicusRoad Daily Pivots è un indicatore di punti pivot giornalieri per MetaTrader 4 e MetaTrader 5 che divide il range del giorno precedente in livelli Fibonacci e li estende sopra e sotto di esso, da meno 100 a più 200 per cento. Invece dei classici floor pivot, il range completato precedente viene trattato come una scala in cui il minimo è 0% e il massimo è 100%. Diciannove livelli vengono stampati come brevi marcatori colorati al bordo destro del grafico, così l'ampiezza del movimento di ogg
FREE
Fair Value Gap (FVG) & Inversion Fair Value Gap (iFVG) Nelle metodologie ICT (Inner Circle Trader) e Smart Money Concepts (SMC), un Fair Value Gap (FVG)—noto anche come squilibrio (imbalance)—si verifica quando il prezzo si muove con un momento estremo, lasciando dietro di sé un vuoto di liquidità. Questi vuoti non colmati agiscono come magneti per la futura azione dei prezzi, rendendoli le zone di ritracciamento e di ingresso a più alta probabilità per i trader professionisti. Ma non tutti i FV
Gli utenti di questo prodotto hanno anche acquistato
Trend SniperX MT4
Sarvarbek Abduvoxobov
5 (5)
Trend Sniper X è un indicatore di trend-following multi-timeframe per MetaTrader 5 che aiuta i trader a identificare la direzione del trend e i potenziali punti di inversione con chiarezza e precisione. Per MT5: https://www.mql5.com/en/market/product/181101 Informazioni sul prezzo: Il prezzo attuale è promozionale ed è soggetto a modifiche con il rilascio dei prossimi aggiornamenti e nuove funzionalità. Canale Code2Profit Domina il mercato con l'analisi multi-timeframe! Come massimizzare il tuo
Zoryk Gold mt4
Reda El Koutbane
5 (3)
ZORYK — Sistema avanzato di segnali e pianificazione per XAUUSD su MetaTrader 4 Conosci sicuramente questa situazione. Analizzi l’oro, aspetti l’ingresso e finalmente apri la posizione. Il prezzo si muove immediatamente contro di te. Chiudi troppo presto, sposti lo Stop Loss oppure esiti per alcuni secondi. Poco dopo, il mercato raggiunge esattamente la direzione e l’obiettivo che avevi previsto, ma senza di te. Il problema non era sempre la direzione. Il vero problema era l’incertezza. No
PRO Renko System
Oleg Rodin
5 (31)
PRO Renko System è un sistema di trading altamente accurato appositamente progettato per il trading di grafici RENKO. Questo è un sistema universale che può essere applicato a vari strumenti di trading. Il sistema neutralizza efficacemente il cosiddetto rumore di mercato che consente di accedere a segnali di inversione accurati. L'indicatore è molto facile da usare e ha un solo parametro responsabile della generazione del segnale. Puoi facilmente adattare lo strumento a qualsiasi strumento di
Currency Strength Wizard è un indicatore molto potente che ti fornisce una soluzione all-in-one per un trading di successo. L'indicatore calcola la potenza di questa o quella coppia forex utilizzando i dati di tutte le valute su più intervalli di tempo. Questi dati sono rappresentati in una forma di indice di valuta facile da usare e linee elettriche di valuta che puoi utilizzare per vedere il potere di questa o quella valuta. Tutto ciò di cui hai bisogno è collegare l'indicatore al grafico che
Atomic Analyst
Issam Kassas
5 (14)
Atomic Analyst — MetaTrader 4 Per domande sul prodotto, indicazioni sulla configurazione o supporto tecnico, scrivimi direttamente qui su MQL5. L’indicatore trasforma calcoli complessi del mercato in semplici segnali visivi, candele colorate, letture del trend, livelli di stop-loss e diverse zone di take-profit che i trader possono capire rapidamente e usare in condizioni reali di mercato. Principali utilizzi di trading: Scalping e trading intraday: Progettato per decisioni rapide, frecce chiar
Gann Made Easy
Oleg Rodin
4.84 (173)
Gann Made Easy è un sistema di trading Forex professionale e facile da usare che si basa sui migliori principi del trading utilizzando la teoria di mr. WD Gann. L'indicatore fornisce segnali ACQUISTA e VENDI accurati, inclusi i livelli di Stop Loss e Take Profit. Puoi fare trading anche in movimento utilizzando le notifiche PUSH. CONTATTAMI DOPO L'ACQUISTO PER RICEVERE GRATUITAMENTE LE ISTRUZIONI DI TRADING E OTTIMI INDICATORI EXTRA! Probabilmente hai già sentito parlare molte volte dei metodi d
Smart Trend Trading System è un indicatore per MetaTrader 4 che riunisce informazioni sul trend, segnali di entrata e uscita e livelli di prezzo in un unico grafico. Combina più di 10 strumenti di trading in un unico sistema, inclusi rilevamento del trend, zone di inversione, Smart Cloud, logica di trailing stop, supporto e resistenza, colorazione delle candele, avvisi e analisi multi-timeframe. Il sistema è progettato per aiutarti a operare in diverse condizioni di mercato: Mercati in trend: I
Top Bottom Tracker è un indicatore basato su sofisticati algoritmi che analizza l'andamento del mercato ed è in grado di rilevare i massimi e i minimi del trend / Versione MT5 . Il prezzo aumenterà progressivamente fino a raggiungere i 500$. Prossimo prezzo --> 99$ Caratteristiche Nessuna riverniciatura Questo indicatore non cambia i suoi valori all'arrivo di nuovi dati Coppie di trading Tutte le coppie forex Timeframe Tutti i timeframe Parametri ==== Configurazione dell'indicatore ====
Scalper Vault
Oleg Rodin
5 (40)
Scalper Vault è un sistema di trading potente e completo, progettato per i trader che desiderano ottenere risultati costanti nel trading intraday. Questo indicatore ad alta precisione funge da sistema di trading autonomo, offrendo analisi di livello istituzionale sia per il mercato Forex che per le Opzioni Binarie. CONTATTAMI DOPO L'ACQUISTO PER RICEVERE I MIEI CONSIGLI DI TRADING E UN FANTASTICO BONUS! Eliminando le congetture e le complesse analisi manuali, Scalper Vault ti permette di concen
Neuro Poseidon MT4
Daria Rezueva
4.74 (46)
Neuro Poseidon is a new indicator by Daria Rezueva. It combines precise trading signals with adaptive TP/SL levels - creating best possible trades as a result! Message me and get  Neuro Poseidon Assistant  as a gift to automize your trading process! What makes it stand out? 1. Proven profitability on all assets and timeframes 2. Only confirmed BUY and SELL signals present on the chart 3. Adaptive TP & SL levels generated by the software for each trade 4. Easy to understand - suitable for all
Tokyo mt4 Indicator
Vasiliy Strukov
5 (9)
Il Tokyo Indicator offre una chiara panoramica visiva della direzione del trend, dei potenziali segnali di trading e delle condizioni di mercato. La sua linea di trend a gradini, codificata a colori, distingue le fasi rialziste (in blu) da quelle ribassiste (in magenta). Frecce direzionali dedicate evidenziano potenziali opportunità di acquisto e vendita al variare del trend visualizzato. Una dashboard integrata riunisce in un'unica visualizzazione pratica il segnale corrente, il bias di mercato
Liquidity Scalper System: un sistema di trading basato sulla liquidità in formato indicatore. La maggior parte degli indicatori mostra solo una freccia, poi è il trader a decidere dove mettere lo stop, dove si trova il target e se fidarsi del segnale. Liquidity Scalper System copre l'intero ciclo del trade: trova i pool di liquidità, dà un segnale alla loro rottura, calcola subito Entry, Stop Loss e tre target, e mostra sul pannello le statistiche e i risultati della verifica su dati nuovi. Il
Attualmente 30% di sconto! La soluzione migliore per ogni principiante o trader esperto! Questo software per cruscotti funziona su 28 coppie di valute. Si basa su 2 dei nostri indicatori principali (Advanced Currency Strength 28 e Advanced Currency Impulse). Offre un'ottima panoramica dell'intero mercato Forex. Mostra i valori di forza delle valute avanzate, la velocità di movimento delle valute e i segnali per 28 coppie Forex in tutti i (9) timeframe. Immaginate come migliorerà il vostro tra
SR Liquidity
Oleg Rodin
5 (2)
SR Liquidity è un indicatore di trading progettato per individuare le zone nascoste in cui si concentra la liquidità di mercato e dove il prezzo reagisce con maggiore intensità. Queste aree di liquidità agiscono come potenti livelli di supporto e resistenza, offrendo una mappa chiara dei punti in cui è più probabile che il mercato inverta la propria direzione. Invece di tracciare le classiche linee di supporto e resistenza, SR Liquidity analizza l'effettivo comportamento dei prezzi per individua
AW Prime Oscillator
AW Trading Software Limited
5 (1)
Una combinazione di due oscillatori. Il primo mostra i punti di ingresso, il secondo mostra l'andamento attuale. L'indicatore può visualizzare i segnali dell'oscillatore tramite frecce in due modalità, tutti i segnali dell'oscillatore veloce o segnali solo nella direzione della tendenza attuale. Ha un pannello multi-intervallo temporale e tre tipi di notifiche di segnali. Benefici: Adatto per il trading giornaliero e scalping Filtraggio delle tendenze Configurazione semplice e sensibile Pannello
M1 Sniper
Oleg Rodin
4.97 (30)
M1 SNIPER è un sistema di indicatori di trading facile da usare. Si tratta di un indicatore a freccia progettato per l'intervallo temporale M1. L'indicatore può essere utilizzato come sistema autonomo per lo scalping sull'intervallo temporale M1 e come parte del tuo sistema di trading esistente. Sebbene questo sistema di trading sia stato progettato specificamente per il trading sull'intervallo temporale M1, può comunque essere utilizzato anche con altri intervalli temporali. Inizialmente ho pro
CRT Candle Range Theory HTF MT4 - Ultimate CRT Indicator: Concetti ICT avanzati e sistema di trading Malaysian SnR Padroneggia le orme dei Market Maker con l'indicatore Candle Range Theory più avanzato. Sblocca il vero potere degli Smart Money Concepts (SMC) e fai trading con la stessa precisione delle istituzioni grazie all'Ultimate CRT Indicator. Costruito esclusivamente per i trader seri, questo indicatore automatizza la teoria CRT, un pilastro centrale dei Concetti ICT (Inner Circle Trader),
Cycles Predictor Indicator This indicator uses past market cycles to predict future price movements. The indicator scans through past data and considers  combinations  of cycles. When cycles  coincide  at the same future date/time then it is considered a valid future prediction. The predictions are drawn as vertical lines on the right side of the chart in the future. A prediction will often result in type of candle (ex. bull or bear) and/or a reversal point (ex. bottom or top) forming at this ex
Segnale GoldRush Trend Arrow L'indicatore GoldRush Trend Arrow Signal fornisce un'analisi precisa e in tempo reale dei trend, pensata appositamente per gli scalper ad alta velocità e a breve termine nel mercato XAU/USD. Progettato specificamente per il timeframe di 1 minuto, questo strumento mostra frecce direzionali che indicano chiari punti di ingresso, consentendo agli scalper di navigare con sicurezza nelle condizioni di mercato volatili. L'indicatore è composto da frecce di avviso PRIMA
Break and Retest Hunter MT4 is a powerful MetaTrader 5 indicator designed to automatically identify support and resistance levels, breakout structures, and potential retest opportunities in real time. Bonus Indicator: After purchasing Break and Retest Hunter , contact me to receive Trade Indicator Assistant EA completely free as a bonus utility. $65 for the next 10 copies . Next price is $120.  Combining adaptive market analysis, clear BUY/SELL signals, Fibonacci-based profit targets, and a pre
ForexTrendMT4
Andriy Sydoruk
5 (1)
ForexTrendMT4 Indicator: A Reliable Tool for Market Tracking The ForexTrendMT4 indicator offers reliable market trend tracking, filtering out sudden fluctuations and market noise. This tool helps identify trends and signals favorable entry points into the market using arrows. It is suitable for both scalping on shorter timeframes and long-term trading strategies. Based on the principles of technical analysis, ForexTrendMT4 takes into account the cyclical nature of the market. Key Features and A
CRT Multi-Timeframe Market Structure & Liquidity Sweep Indicator Non-Repainting | Multi-Asset | MT5 Version Available MT5 Version:   https://www.mql5.com/en/market/product/162075 Full User Guide — explains what each feature does and why:   https://www.mql5.com/en/blogs/post/767525 Quick Start User Guide  — explains how to configure and in what order:  https://www.mql5.com/en/blogs/post/767540 Indicator Overview CRT Ghost Candle HTF Fractal is a complete institutional-grade market structure too
Super Signal – Skyblade Edition Sistema professionale di segnali di tendenza senza repaint / senza ritardo con tasso di vincita eccezionale | Per MT4 / MT5 Funziona meglio su timeframe più bassi, come 1 minuto, 5 minuti e 15 minuti. Caratteristiche principali: Super Signal – Skyblade Edition è un sistema intelligente di segnali progettato specificamente per il trading di tendenza. Utilizza una logica di filtraggio multilivello per identificare esclusivamente i movimenti direzionali forti, supp
ATTUALMENTE SCONTATO DEL 40% La soluzione migliore per ogni principiante o trader esperto! Questo indicatore è uno strumento di trading unico, di alta qualità e conveniente perché abbiamo incorporato una serie di caratteristiche proprietarie e una nuova formula. Con un solo grafico è possibile leggere la forza delle valute per 28 coppie Forex! Immaginate come migliorerà il vostro trading perché sarete in grado di individuare l'esatto punto di innesco di una nuova tendenza o di un'opportunità
Volume Orderflow Profile
Suvashish Halder
5 (2)
Introducing Volume Orderflow Profile , a versatile tool designed to help traders visualize and understand the dynamics of buying and selling pressure within a specified lookback period. Perfect for those looking to gain deeper insights into volume-based market behavior! MT5 Version -  https://www.mql5.com/en/market/product/122657 The indicator gathers data on high and low prices, along with buy and sell volumes, over a user-defined period. It calculates the maximum and minimum prices during this
Smart Price Action Concepts — MetaTrader 4 Per domande sul prodotto, indicazioni sulla configurazione o supporto tecnico, scrivimi direttamente qui su MQL5. Funzionalità: • Smart Money Concepts SMC • Inner Circle Trading ICT • Price Action PA e Institutional Trading IT • Struttura di mercato in tempo reale e swing structure highs and lows (HH HL LL LH) • Order blocks interni e swing supply and demand in tempo reale • Premium Equilibrium e Discount Zones • Rilevamento automatico Fibonacci con 2 o
VWAP Ultimate Pro MT4 – Persistent Anchored VWAP | Session VWAP | Dynamic Bands & Smart Alerts Bring an Advanced Professional VWAP Workflow to the Classic MetaTrader 4 Platform WHY TRADERS CHOOSE VWAP ULTIMATE PRO MT4? VWAP (Volume-Weighted Average Price) is a widely used benchmark for evaluating fair value, session bias and price positioning. VWAP Ultimate Pro MT4 delivers a complete VWAP workflow optimised for the MT4 architecture, including persistent Anchored VWAP, multiple VWAP periods,
This indicator works on MT4 and is very easy to use. When you receive a signal from it, you wait for that candle with the signal to close and you enter your trade at the beginning of the next new candle . A red arrow means sell and a green arrow means buy. All arrows comes with Alert  like for easy identification of trade signal. Are you okay with that? 1 minute candle 1 minute expire
Trend Lines PRO
Roman Podpora
5 (2)
LINEE DI TENDENZA PRO       Aiuta a capire dove il mercato sta realmente cambiando direzione. L'indicatore mostra reali inversioni di tendenza e punti in cui i principali attori rientrano. Vedi  Linee BOS   Cambiamenti di tendenza e livelli chiave su timeframe più ampi, senza impostazioni complesse o rumore inutile. I segnali non vengono ridisegnati e rimangono sul grafico dopo la chiusura della barra. VERSIONE MT 5     -      Svela il suo massimo potenziale se abbinato all'indicatore   RFI LEVE
Advanced Supply Demand
Bernhard Schweigert
4.91 (302)
Speciale Trading- SCONTO DEL 30% La soluzione migliore per qualsiasi trader principiante o esperto! Questo indicatore è uno strumento di trading unico, di alta qualità e conveniente, perché abbiamo incorporato una serie di funzionalità proprietarie e una nuova formula. Con questo aggiornamento, potrai visualizzare doppie zone di timeframe. Non solo potrai visualizzare un TF più alto, ma anche entrambi, il TF del grafico e il TF più alto: MOSTRA ZONE ANNIDATE. Tutti i trader che operano con Of
Altri dall’autore
Chart Sync — Sincronizzazione di mirino, salto e disegni tra grafici Sincronizza in tempo reale il movimento del mirino, la navigazione a salto al clic e gli oggetti disegnati tra più grafici —pensato per l'analisi multi-timeframe e multi-simbolo. Caratteristiche principali Sincronizzazione in tempo reale del mirino su tutti i grafici collegati Navigazione a salto al clic — tutti i grafici collegati si centrano sul punto temporale cliccato Sincronizzazione live dei disegni (linee di tendenza, li
Filtro:
Nessuna recensione
Rispondi alla recensione