Trade Journal Dashboard
- Utilità
-
Suvashish Halder
 💧 PRO TIP - Don't Open Orders Where You See, Open Them Where Others Can't!
📈 Decoding Market Phases Like Never Before – The SuvashishFx Revolution! - Versione: 1.0
- Attivazioni: 10
Terminial built-in history tab gives you raw numbers. It doesn't give you a picture. It won't tell you that your Tuesdays are bleeding money while your Fridays are carrying the account, or that your real win rate this month is nothing like what you remember it being, or how close you actually are to your own max-drawdown limit right now.
Trade Journal Dashboard turns your raw trade history into a real, honest performance picture — built directly on your chart, refreshed automatically, with no manual logging required.
If you've ever finished a trading week and genuinely weren't sure whether it was a good one or not, this tool exists for you.
🛑 Join To Learn Market Depth - https://www.mql5.com/en/channels/suvashishfx
Features
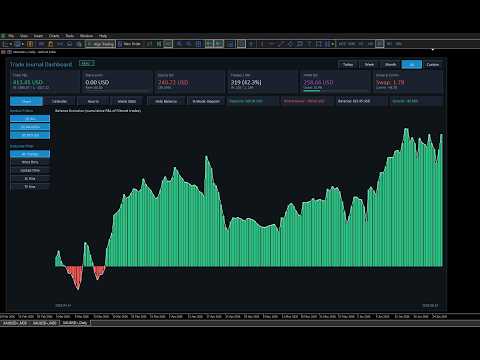
Chart Tab — Balance Evolution
A clean, filterable equity curve built from your actual closed-trade history. Bar-by-bar visualization with a smooth overlaid trend line, so you can see not just where your balance ended up, but the shape of how it got there — the grinds, the spikes, the drawdowns.
Calendar Tab — Your Trading Month, At a Glance
A full month-grid view of your trading activity:
- Every day shows net P&L, % gain, intraday drawdown %, win rate, and trade count
- Week rows total automatically, with their own win rate and drawdown
- A trailing 6-month growth strip shows your month-over-month trend without clicking through each one
- One summary bar that adapts to whatever you're viewing — Today, This Week, This Month, All Time, or a Custom date range
Hourly Tab — When Are You Actually Profitable?
A 7-day × 24-hour performance grid. Instantly see which hours and which days of the week are carrying your account — and which ones are quietly working against you.
Arena Stats — Real Performance Analytics
- Overview: Profit Factor, Max Drawdown, a Sharpe-style consistency ratio, a rules-based Discipline Score, and a Mistake Rate based on your actual stop-loss hits — plus automatically generated Performance Flags (overtrading, loss streaks, inconsistent position sizing) and Positive Feedback for what's working
- Advanced: Hold-time statistics, full drawdown breakdown, win/loss streak tracking, and a cost-of-mistakes estimate
Built for Accuracy, Not Just Pretty Numbers
- Partial closes are handled correctly — if you scale out of a position across multiple closes, it's counted as the one trade it actually was, not several
- Full commission accuracy — both the opening and closing commission on every trade are captured, not just half of it
- True historical percentages — every day/week/month % is calculated against what your balance actually was at that moment, not your current balance, so a $20 gain from three months ago isn't silently shrunk by how much you've grown since
Filter Everything
- Symbol filter (multi-select, with an ALL toggle)
- Outcome filter: All Trades / Wins Only / Losses Only / SL Hits / TP Hits
- Period selector: Today / Week / Month / All / Custom date range
Privacy When You Need It
One click hides every dollar figure across the entire dashboard — perfect for sharing your stats or screen-recording without exposing your account size.
Two Ways to Measure Growth
Toggle between Deposit Mode (every % measured against your fixed deposited capital) and Daily Balance Mode (every % measured against that specific day's true starting balance) — so you can verify your numbers against whichever reference point makes sense to you.
🟢 Live / Demo Badge
Always know at a glance which kind of account you're looking at.
Inputs & Configuration
| Input | What It Does |
|---|---|
| Magic filter | Set to 0 to track every trade on the account, or enter a specific magic number to isolate one EA's performance |
| Daily loss limit (USD) | Your own personal or prop-firm daily loss ceiling — powers the Daily Limit card and its warning bar |
| Max overall drawdown (USD) | Your own max-drawdown rule — powers the "% used" reading on the HWM DD card |
| Panel X / Y position | Where the dashboard sits on your chart |
| Panel width / height | Resize the whole dashboard to fit your monitor |
| Auto-refresh interval | How often (in seconds) the dashboard re-reads your trade history and redraws |
| Max chart bars | Caps how many bars render on the Balance Evolution chart for very large trade histories |
| Calendar font size | Scale the Calendar tab's text up or down for readability |
All inputs are adjustable directly from the EA's Properties dialog — no recompiling needed to tune it to your account or your screen.
Why This Matters
Trading is a game of small, repeated decisions, and almost nobody can hold an accurate picture of hundreds of those decisions in their head. You think you know how you traded this month — but thinking and knowing are different things, and the gap between them is where bad habits hide.
This dashboard doesn't trade for you, and it doesn't manage your risk for you — it shows you the truth about what already happened, clearly enough that the patterns become impossible to ignore. The overtrading day you didn't notice. The hour of the day that's quietly your worst. The week your discipline slipped before the losses started. The real, deposit-relative number behind a "good month" that didn't feel as good once you stopped to actually measure it.
Every serious trader keeps a journal. This is the version that keeps itself — accurate, automatic, and always one chart-refresh away from the truth.