Voluris volume engine MT4

5
  • Indicatori
  • Reda El Koutbane
    Reda El Koutbane
    MQL5 developer specializing in Smart Money Concept and ICT-based Expert Advisors. I understand trading logic deeply — not just syntax. I build FSM-based EAs with proper multi-timeframe analysis, risk management, and state persistence. Trilingual: English, French
  • Versione: 2.10
  • Aggiornato: 26 luglio 2026

only 7 free copies left

VOLURIS — motore Volume Profile


Sai già come fare trading. Semplicemente non riesci a vedere ciò che dovresti vedere.
Questa sensazione l’hai già provata.

Entri. Il prezzo si muove immediatamente contro di te. Vieni stoppato. Poi, subito dopo, il prezzo si gira e va esattamente dove pensavi che sarebbe andato. Avevi ragione. Eri solo entrato troppo presto. O troppo tardi. O entrambe le cose.

Riguardi il grafico e ora lo vedi. C’era un Naked POC proprio sopra la tua entrata. L’area di valore della sessione precedente era esattamente dove il prezzo si è fermato. Il VWAP stava agendo come resistenza e non lo avevi nemmeno sul grafico. Il contesto ti stava dicendo tutto. Semplicemente non avevi lo strumento per leggerlo.

Questo non è un problema di trading. È un problema di informazione.

VOLURIS esiste per risolverlo.

Cos’è VOLURIS

VOLURIS non è un indicatore. È un workspace decisionale completo basato su Volume Profile per MetaTrader 5, progettato da zero per dare ai trader discrezionali le informazioni esatte che i trader professionisti del volume usano per leggere il mercato, tutto in un unico posto, in tempo reale, direttamente sul grafico.

Niente più cinque indicatori separati da far girare mentre provi a costruire l’immagine nella tua testa. Niente più dubbi sul fatto che il prezzo sia dentro o fuori dall’area di valore. Niente più Naked POC persi, rimasti due sessioni indietro ad aspettare di essere testati.

VOLURIS legge il mercato e ti mostra ciò che trova. Ogni sessione. Ogni livello. Ogni segnale. Tutto insieme.

Cosa vedi nel momento in cui lo carichi

Nel secondo in cui VOLURIS appare sul tuo grafico, tutto cambia.

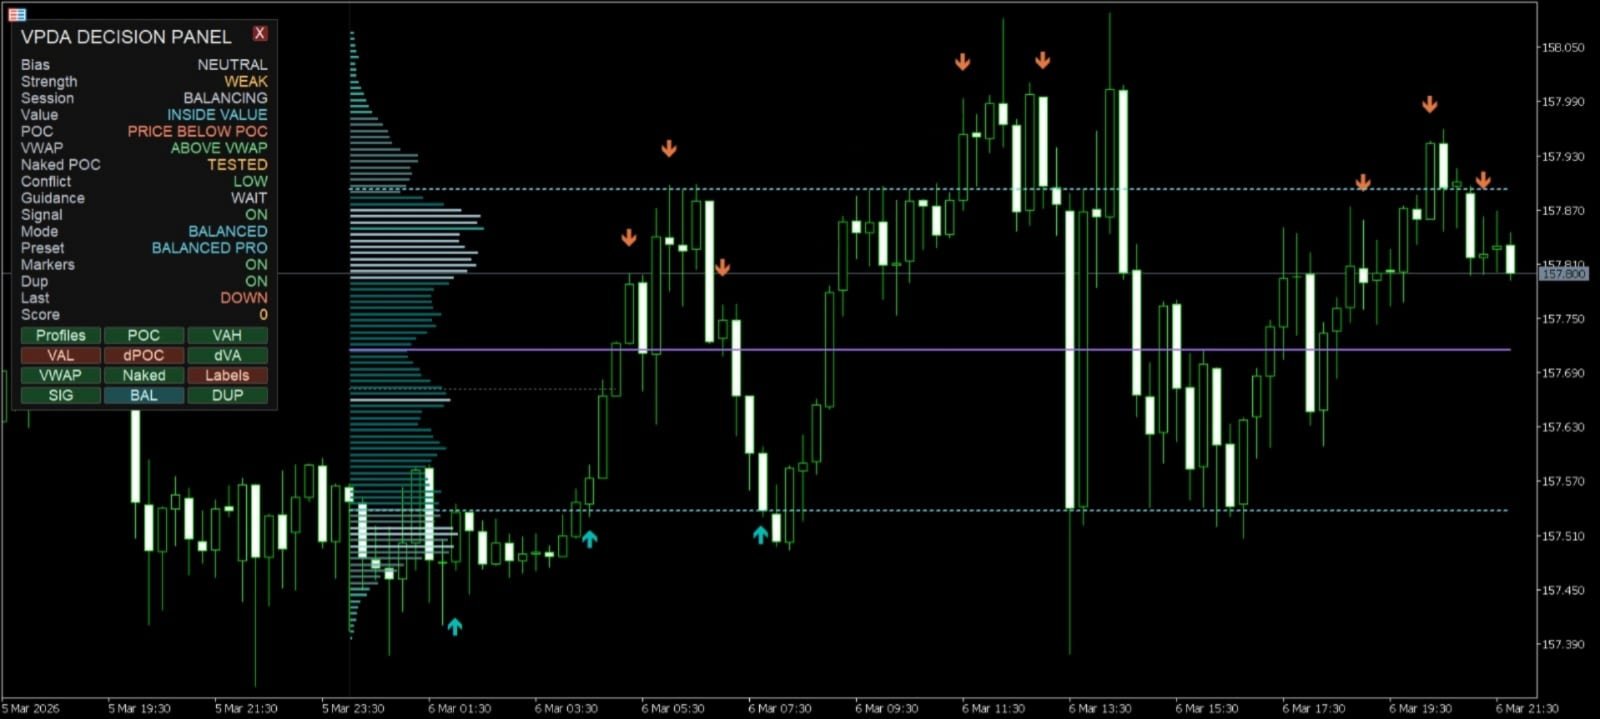
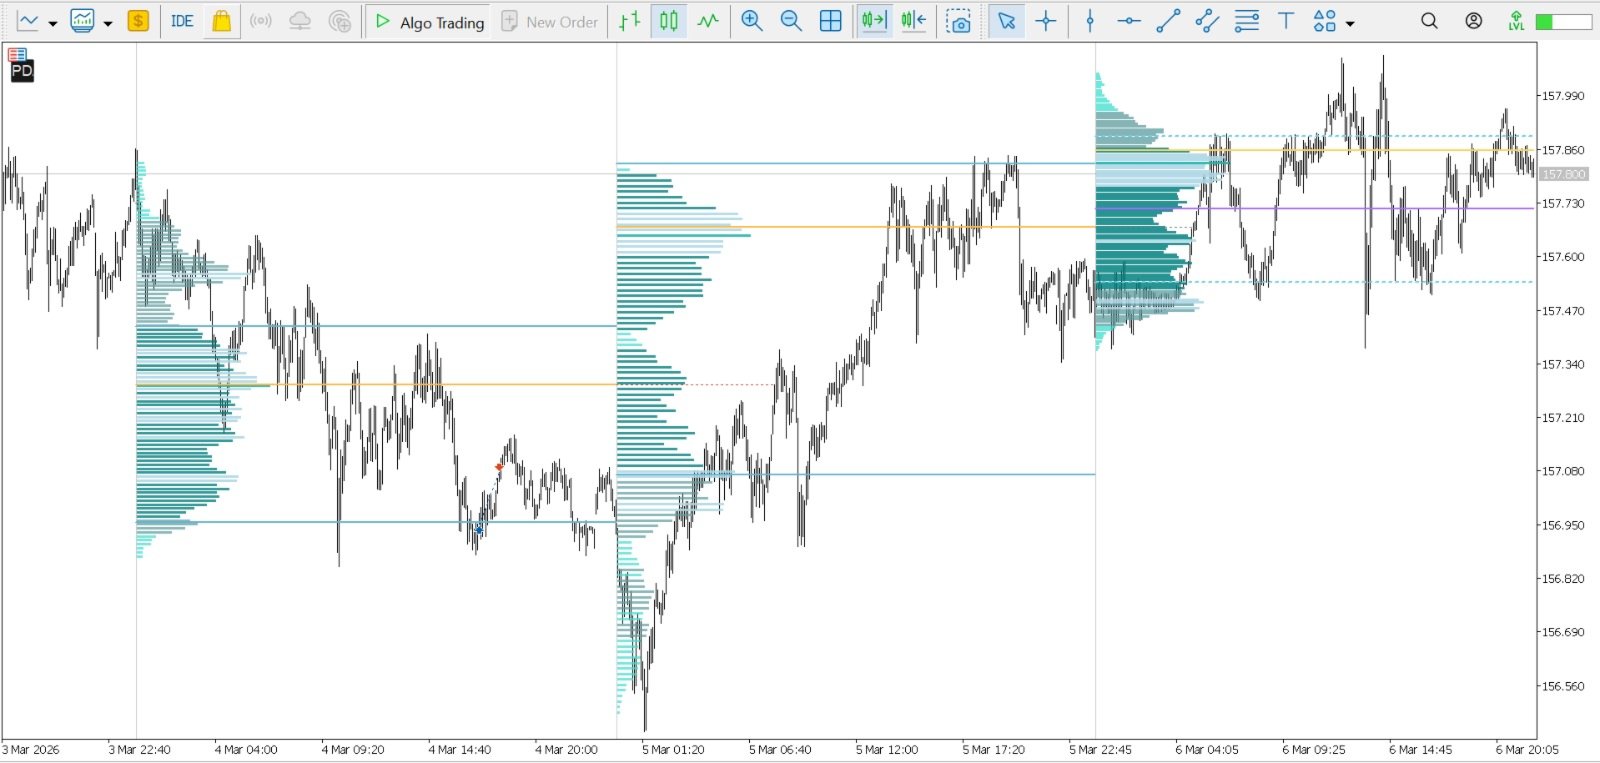
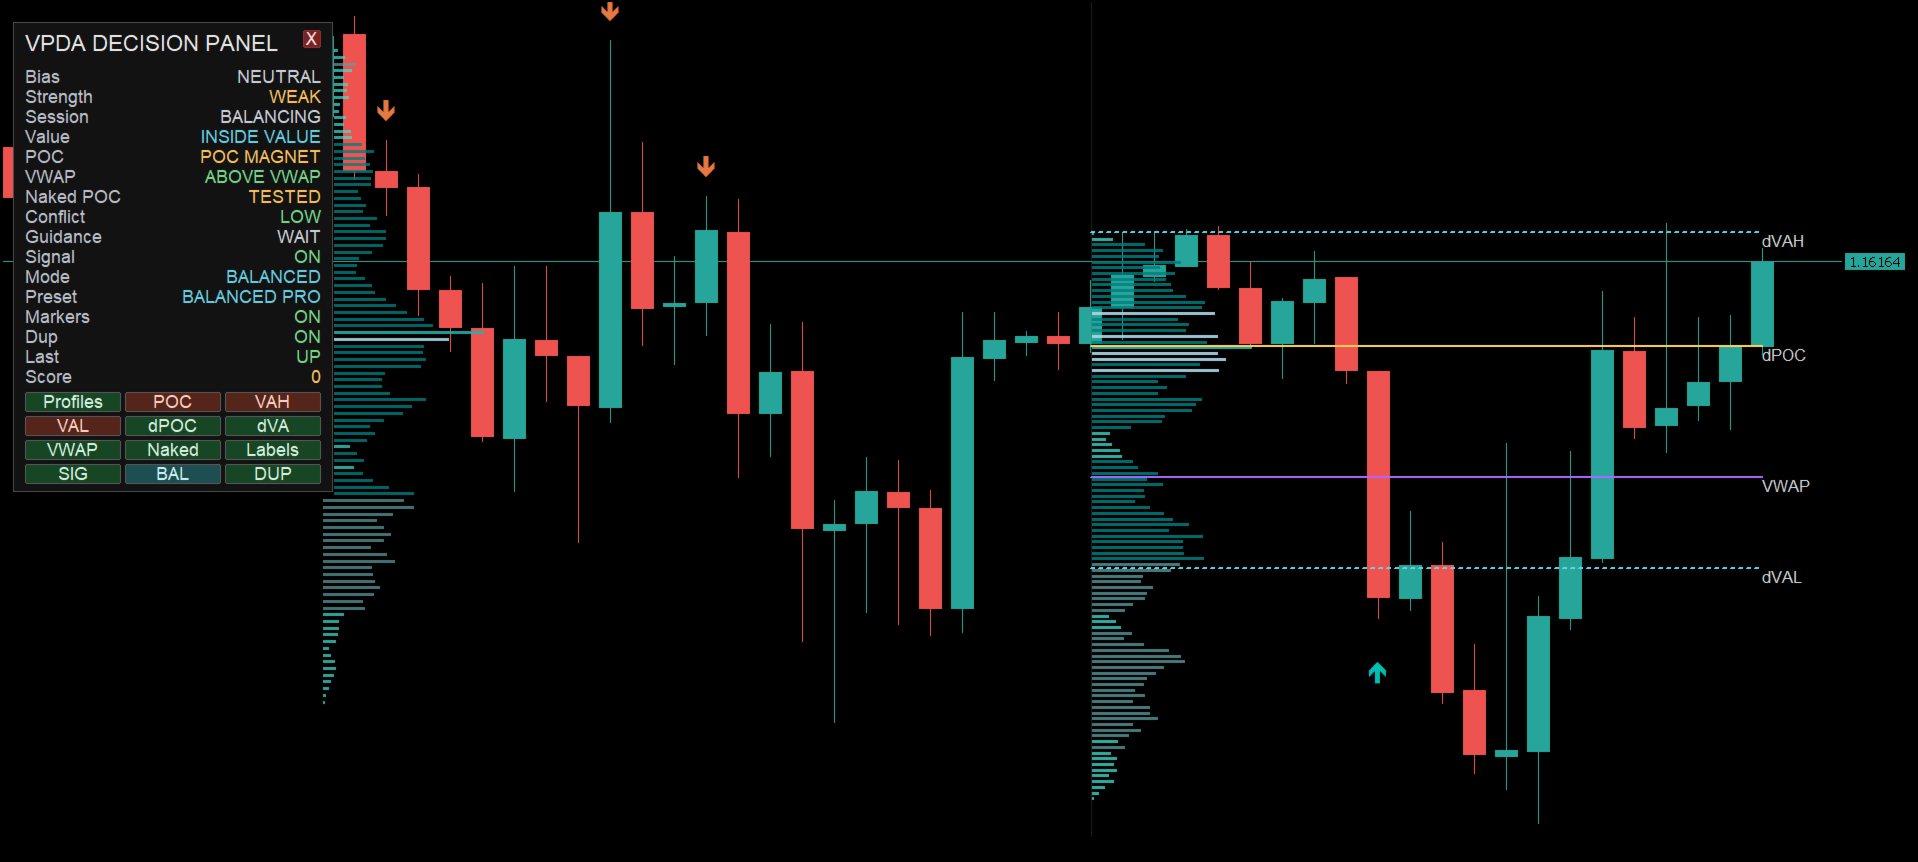
Vedi il Volume Profile di sessione — non un singolo profilo generico esteso su tutto il range visibile, ma profili puliti e individuali per ogni sessione, che mostrano esattamente dove il mercato ha costruito valore sessione dopo sessione, con la sessione corrente in sviluppo che si aggiorna dal vivo mentre si forma.

Vedi il Point of Control — il prezzo esatto dove è stato scambiato il maggior volume in questa sessione e nella sessione precedente. È il centro magnetico del mercato. Il prezzo lo rispetta. Il prezzo lo rifiuta. Il prezzo ci ritorna. E ora sai sempre esattamente dove si trova.

Vedi Value Area High e Value Area Low — i confini superiore e inferiore dell’area in cui è stato scambiato il 70% del volume. Dentro la value area si trova il prezzo accettato. Fuori da essa, il prezzo rifiutato. Nel momento in cui sai dove si trovano questi livelli, smetti di prendere entrate in terra di nessuno.

Vedi i livelli in sviluppo — dPOC, dVAH, dVAL — che si aggiornano in tempo reale mentre la sessione si sta ancora formando. Non solo dove era il valore. Dove si sta costruendo adesso. Questa è la differenza tra leggere il giornale di ieri e guardare le notizie in diretta.

Vedi il VWAP — l’ancora di fair value della sessione — e capisci immediatamente se il prezzo sta trattando caro o economico rispetto a dove il mercato ha realmente trascorso tempo. Sopra il VWAP, bias rialzista. Sotto il VWAP, bias ribassista. Vicino al VWAP, contesa. Quel contesto è sempre visibile, sempre live e sempre considerato in tutto ciò che VOLURIS mostra.

E vedi i Naked POC — vecchi Points of Control di sessioni precedenti che il prezzo non è mai tornato a testare. Questi livelli restano sul grafico come affari incompiuti. Il mercato li ricorda. Le istituzioni li ricordano. E ora li ricordi anche tu. VOLURIS li traccia automaticamente e li mantiene visibili finché il prezzo non torna a testarli, indipendentemente da quanto tempo ci vorrà.

Il motore di stato del mercato

La maggior parte degli indicatori ti mostra livelli e poi ti lascia da solo con essi. VOLURIS fa qualcosa di diverso.

Dietro tutto ciò che vedi sul grafico, VOLURIS esegue un motore continuo di stato del mercato, valutando la posizione del prezzo rispetto a value, VWAP, POC, VAH, VAL e struttura di sessione, e traducendo tutto in una singola lettura live del contesto: Bullish. Bearish. Neutral. Conflict.

Non devi più costruire quell’immagine nella tua testa. VOLURIS la costruisce per te e ti mostra il risultato in tempo reale tramite il pannello di guida. Apri il grafico. Leggi il contesto. Prendi una decisione. Ecco quanto diventa rapido il workflow.

Tre modalità di segnale. Un clic per cambiare.

VOLURIS non ti costringe a usare un solo stile di segnale. Te ne offre tre — e ti permette di passare da una all’altra dal vivo, direttamente sul grafico, senza aprire nessuna finestra di impostazioni.

RAW Mode è il motore di segnale completo alla massima sensibilità. Ogni trigger che soddisfa i criteri base genera una freccia. Questa modalità è per i trader che vogliono vedere ogni opportunità e applicare la propria discrezione sopra. Più frecce. Più occasioni. Decidi tu quali prendere.

BALANCED Mode è il default per un motivo. Una confluence morbida di VOLURIS viene aggiunta ai trigger di base, filtrando i setup in cui il contesto di volume, la posizione rispetto al VWAP e lo stato del mercato non sono allineati. Il risultato è un grafico molto più pulito senza sacrificare opportunità significative. La maggior parte dei trader non lascia mai questa modalità.

SELECTIVE Mode è spietata. Passano solo i setup in cui tutto si allinea: forte contesto di volume, chiaro allineamento VWAP, stato di mercato confermato, basso conflict score. In SELECTIVE mode vedrai meno frecce. Ognuna meriterà tutta la tua attenzione.

Un pulsante. Sul grafico. In tempo reale. Cambia quando vuoi.

Duplicate-Zone Control — la fine dello spam di frecce

Sai cosa distrugge più velocemente la fiducia di un trader in un indicatore? Lo spam di frecce. Cinque segnali nella stessa zona da venti pip durante una fase laterale, e non sai più quale significhi qualcosa. VOLURIS lo elimina completamente.

Il motore duplicate-zone control usa clustering basato su ATR per rilevare quando i segnali si accumulano nella stessa area locale di prezzo, e sopprime ogni ripetizione che non aggiunge nuove informazioni. Il risultato è un grafico che parla solo quando ha davvero qualcosa da dire. Quando VOLURIS genera un segnale, significa qualcosa. Perché lo genera solo quando significa qualcosa.

Attivalo e disattivalo con un solo pulsante direttamente sul grafico.

Il pannello decisionale VOLURIS

Qui tutto si unisce.

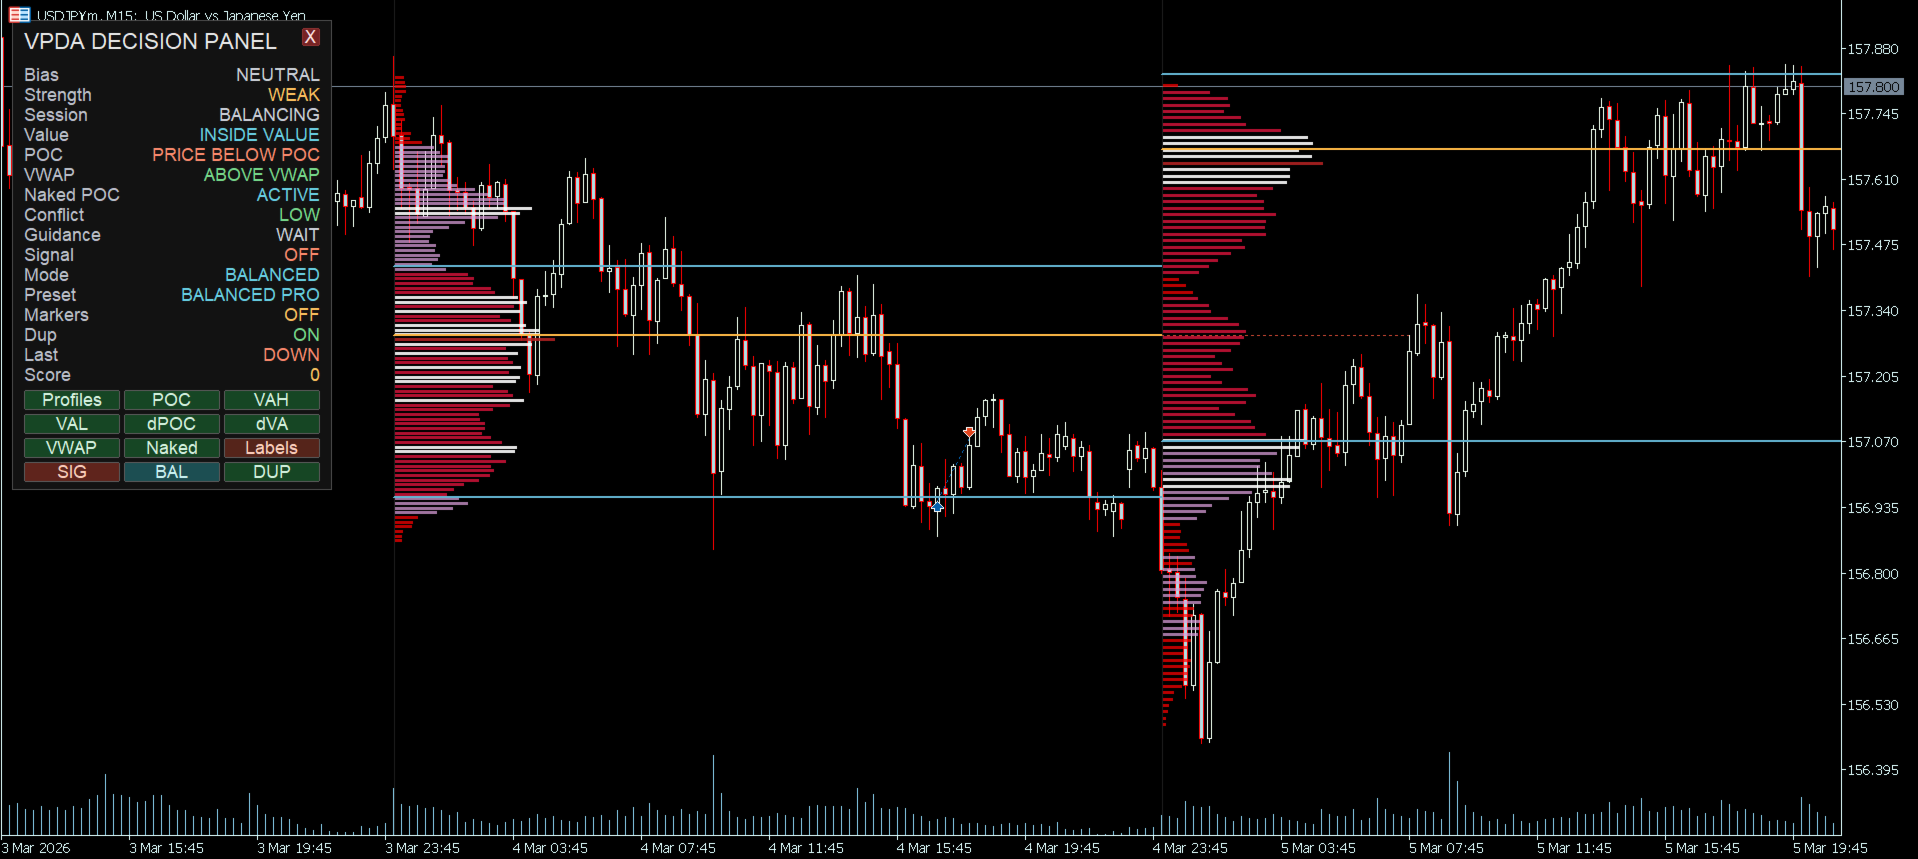
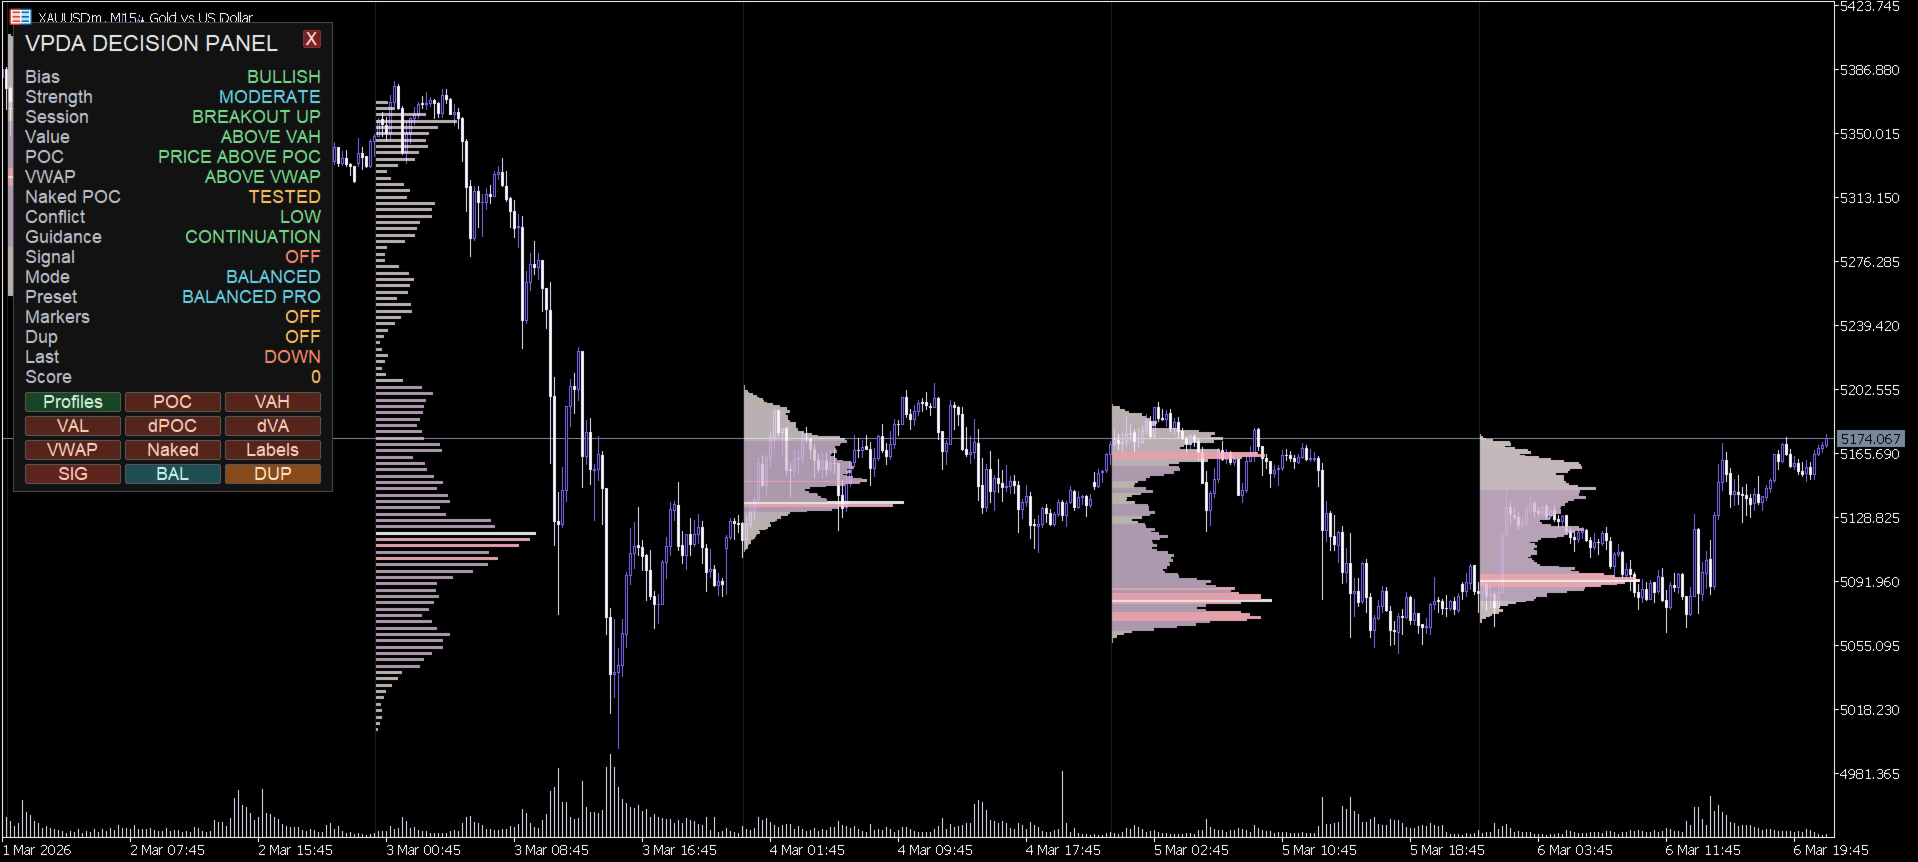
Il pannello di guida VOLURIS si trova direttamente sul tuo grafico — sempre visibile, sempre live, sempre aggiornato. Ti mostra tutto a colpo d’occhio: bias attuale del mercato, struttura di sessione, posizione del prezzo rispetto a value e VWAP, relazione con il POC, stato dei Naked POC, conflict score, modalità di segnale attiva e guida corrente — tutto in un’interfaccia compatta e professionale che si legge in due secondi.

Il pannello ha pulsanti runtime per segnali, modalità e duplicate control. Ha un design richiudibile, quindi scompare con un clic quando hai bisogno di tutto lo spazio del grafico e ritorna appena lo tocchi di nuovo. Fa sembrare VOLURIS meno un indicatore e più un secondo paio di occhi professionali che osservano il mercato con te.

Costruito per funzionare pulito

Gli indicatori pesanti distruggono i grafici. Lag ad ogni tick. Ricalcolano tutto ad ogni scorrimento. Fanno sembrare MetaTrader 5 come se stesse correndo dentro cemento bagnato. VOLURIS è stato progettato appositamente per non essere nulla di tutto questo.

Nessun ricalcolo completo ad ogni tick. Aggiornamenti dei movimenti del grafico con throttling. Percorso leggero separato per l’aggiunta di nuove barre. Ridisegni protetti che partono solo quando devono. Il risultato è un indicatore che funziona in modo fluido e pulito anche su grafici intraday affollati durante i picchi di volatilità, proprio quando ne hai più bisogno.

E se il tuo broker ha dati tick limitati, VOLURIS lo gestisce automaticamente con un fallback tick-to-M1, così i profili vengono costruiti correttamente indipendentemente dai dati forniti dal broker.

Per chi è

VOLURIS è per il trader che è stanco di essere confuso dal proprio grafico.

È per il trader che ha provato cinque diversi strumenti Volume Profile e li ha trovati tutti troppo semplici per essere utili o troppo complessi per essere pratici. È per il trader stanco di mettere insieme il contesto da sei indicatori separati e sentirsi comunque incerto prima di ogni entrata. È per il trader che capisce che il volume dice la verità — e vuole uno strumento finalmente degno di quella verità.

Se fai trading su XAUUSD, coppie forex o indici su MetaTrader 5 e prendi le tue decisioni di trading, VOLURIS è stato costruito appositamente per te.

Questo è l’ultimo strumento Volume Profile di cui avrai mai bisogno.
Recensioni 6
pipyoda
56
pipyoda 2026.08.30 15:20 

Hi Reda,

I have started adding volume analysis to my trading and currently using this indicator. It is superb and well put together for novice and professional alike. Very well done sir, great tool, I love it.

Elmar Votri
223
Elmar Votri 2026.07.03 14:43 

Mr El Koutbane, I hope this message finds you well. I would like to congratulate you on the outstanding job you did on this product. The quality, attention to detail, and overall experience are truly impressive. Thank you for your hard work and dedication. Please keep up the excellent work!

Molefi Mokhethi
631
Molefi Mokhethi 2026.06.24 10:27 

Its great. I use it with SMT.

Prodotti consigliati
SC MTF Rsi MT4
Krisztian Kenedi
5 (1)
Indicatore dell'Indice di Forza Relativa (RSI) con supporto multi-timeframe, segnali visivi personalizzabili e sistema di avvisi configurabile. Servizi di programmazione freelance, aggiornamenti e altri prodotti TrueTL sono disponibili sul mio profilo MQL5 . Feedback e recensioni sono molto apprezzati! Cos'è il RSI? Il Relative Strength Index (RSI) è un oscillatore di momentum che misura la velocità e l'entità delle variazioni di prezzo. L'indicatore oscilla tra 0 e 100, confrontando l'entità
FREE
A new interpretation of the classical indicator in the form of an oscillator for a more accurate representation of the situation on the market. Less lagging than the standard Alligator. All settings are fully accessible, such as the type and prices for which it is built. Thanks to the additional parameters, it became possible to fine tune. Distinctive features Does not redraw. Additional parameters for fine tuning. Works on all timeframes and symbols. Suitable for manual trading and developmen
FREE
Free automatic Fibonacci is an indicator that automatically plots a Fibonacci retracement based on the number of bars you select on the BarsToScan setting in the indicator. The Fibonacci is automatically updated in real time as new highest and lowest values appears amongst the selected bars. You can select which level values to be displayed in the indicator settings. You can also select the color of the levels thus enabling the trader to be able to attach the indicator several times with differe
FREE
High Low Open Close MT4
Alexandre Borela
4.81 (21)
Se ti piace questo progetto, lascia una recensione a 5 stelle. Questo indicatore disegna i prezzi aperti, alti, bassi e di chiusura per i specificati periodo e può essere regolato per un determinato fuso orario. Questi sono livelli importanti guardati da molti istituzionali e professionali commercianti e può essere utile per voi per conoscere i luoghi dove potrebbero essere più attivo. I periodi disponibili sono: Giorno precedente. Settimana precedente. Mese precedente. Precedente trimestre. A
FREE
Extremum Reverse Bar
Yurij Izyumov
2.8 (5)
This indicator has been created for finding the probable reversal points of the symbol price. A small candlestick reversal pattern is used it its operation in conjunction with a filter of extremums. The indicator is not redrawn! If the extremum filter is disabled, the indicator shows all points that have a pattern. If the extremum filter is enabled, the condition works – if the history Previous bars 1 candles back contains higher candles and they are farther than the Previous bars 2 candle, such
FREE
Trendline indicator
David Muriithi
2 (1)
Are you tired of drawing trendlines every time you're analyzing charts? Or perhaps you would like more consistency in your technical analysis. Then this is for you. This indicator will draw trend lines automatically when dropped on a chart. How it works Works similar to standard deviation channel found on mt4 and mt5. It has 2 parameters: 1. Starting Bar 2. Number of bars for calculation The   starting bar   is the bar which drawing of the trend lines will begin, while the   number of bars for c
FREE
Quantum Falcon Signal Free is a smart visual trading indicator for MetaTrader 4 designed for Forex and Gold traders. The indicator combines: • Trend analysis • RSI momentum confirmation • MACD momentum filtering • ATR volatility filtering • Higher timeframe confirmation • Smart exit signal detection Main Features: • Smart Buy and Sell signals • Exit Buy / Exit Sell alerts • Real-time dashboard on chart • Professional candle arrows • Multi-timeframe trend confirmation • ATR market volatility filt
FREE
Traditional MACD MT4
Daniel Lewis
4.59 (56)
MACD indicator in MetaTrader 4/5 looks different than MACD does in most other charting software. That is because the MetaTrader 4/5 version of MACD displays the MACD line as a histogram when it is traditionally displayed as a line. Additionally, the MetaTrader 4/5 version computes the Signal line using an SMA, while according to MACD definition it is supposed to be an EMA. The MetaTrader 4/5 version also does not compute a true MACD Histogram (the difference between the MACD/Signal lines). This
FREE
Stochastic Arrow
Anton Iudakov
4.5 (4)
The indicator has combined 5 popular strategies. Draws an arrow after confirming a signal for the selected strategy. There are signal alerts. Doesn't redraw its values. I recommend watching my advisor -   Night Zen EA 5 strategies. The main line crosses the signal line. The main line crosses the signal line in the oversold (for buy) / overbought (for sell) zones. The main line enters the oversold (for sell) / overbought (for buy) zones . The main line comes out of the oversold (for buy ) / over
FREE
PZ Penta O MT4
PZ TRADING SLU
2.33 (3)
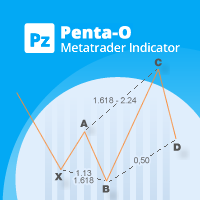
The Penta-O is a 6-point retracement harmonacci pattern which usually precedes big market movements. Penta-O patterns can expand and repaint quite a bit. To make things easier this indicator implements a twist: it waits for a donchian breakout in the right direction before signaling the trade. The end result is an otherwise repainting indicator with a very reliable trading signal. The donchian breakout period is entered as an input. [ Installation Guide | Update Guide | Troubleshooting | FAQ | A
FREE
SX Supply Demand Zones accurately identifies and draws high-probability Supply and Demand zones using a sophisticated algorithm. Unlike traditional indicators that clutter your chart, this indicator is designed with a focus on performance and a clean user experience. New Unique Feature: Interactive Legend System What truly sets this indicator apart from everything else is the Interactive Control Legend. You have a professional dashboard directly on your chart that allows you to: Show/Hide: Ins
FREE
SMA Indicator
Nitu Brijesh Yadav
Arrow Indicator (Buy/Sell Alerts) – Simple Yet Powerful Tool!             Product Version: 1.01           Indicator Type: Trend Reversal Signals           Timeframes Supported: All (Recommended: H1, H4, D1)           Key Features: Buy Signal: Green upward arrow () appears below the candle  Sell Signal : Red downward arrow () appears above the candle Accurate Trend Reversal Detection – Based on tried and tested SMA strategy. ️ Clean Chart View – Minimalist, non-i
FREE
Email Drawdown Alert
Roman Starostin
5 (12)
Free informative Indicator-helper. It'll be usefull for traders who trade many symbols or using grid systems (Averaging or Martingale). Indicator counts drawdown as percent and currency separate. It has a number of settings: Count deposite drawdown according equity value and send e-mail or notifications to user if DD more than set; Sending e-mail when max open orders reached; Shows price and remaining pips amount before MarginCall on current chart and Account generally; Display summary trade lot
FREE
Follow The Line
Oliver Gideon Amofa Appiah
3.94 (16)
FOLLOW THE LINE GET THE FULL VERSION HERE: https://www.mql5.com/en/market/product/36024 This indicator obeys the popular maxim that: "THE TREND IS YOUR FRIEND" It paints a GREEN line for BUY and also paints a RED line for SELL.  It gives alarms and alerts of all kinds. IT DOES NOT REPAINT and can be used for all currency pairs and timeframes. Yes, as easy and simple as that. Even a newbie can use it to make great and reliable trades. NB: For best results, get my other premium indicators for more
FREE
Forex Market Profile and Vwap
Lorentzos Roussos
4.86 (7)
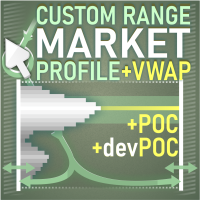
Profilo del mercato Forex (FMP in breve) Cosa non è: FMP non è il classico display TPO con codice alfabetico, non mostra il calcolo generale del profilo dati del grafico e non segmenta il grafico in periodi e non li calcola. Cosa fa : Soprattutto, l'indicatore FMP elaborerà i dati che risiedono tra il bordo sinistro dello spettro definito dall'utente e il bordo destro dello spettro definito dall'utente. L'utente può definire lo spettro semplicemente tirando ciascuna estremità dell'indicatore
FREE
WAD Stoch
Yonny Pascal Ekwa Mezui
WAD Divergence + Stochastic Overview WAD Divergence + Stochastic is a technical indicator designed to assist traders in identifying potential market turning points. It combines price behavior with momentum confirmation to highlight areas where buying or selling pressure may be shifting. The indicator works directly on the chart and provides clear visual signals to support decision-making in fast-moving markets. How It Works The indicator analyzes the relationship between price movement and inte
FREE
Double HMA lines MTF
Pavel Zamoshnikov
5 (2)
This is a multi-timeframe version of the popular Hull Moving Average (HMA). The Double HMA MTF Light indicator combines two timeframes on a single chart. The HMA of the higher timeframe defines the trend, and the HMA of the current timeframe defines short-term price movements. The indicator is freely distributed and hasn't audio signals or messages. Its main function is the visualization of price movements. If you need advanced functionality of the HMA multi-timeframe indicator (information ab
FREE
MACD in MA
Nikolaos Pantzos
iMACD in iMA is indicator to change color in iMA if iMACD is upper of zero (up trend) or lower of zero (down trend). It is a useful tool to track when the upside and the downside iMACD on iMA. You can to get source code from here . Parameters MA_Periods — Period for iMA. MA_Method — Method for iMA. MACD_FastEMA — Fast EMA for MACD. MACD_SlowEMA — Slow EMA for MACD. MACD_SignalSMA — SMA signal for MACD. MACD_ApliedPrice — Price used for MACD. BarsCount — How many bars will show the line. Revers
FREE
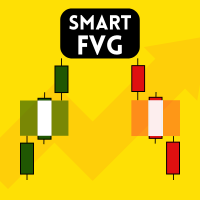
Indicatore Smart FVG MT4 – Rilevamento Avanzato del Fair Value Gap per MetaTrader 4 L'indicatore Smart FVG per MetaTrader 4 offre rilevamento, monitoraggio e avvisi professionali dei Fair Value Gap (FVG) direttamente sui tuoi grafici. Combina un filtro basato sull'ATR con una logica sensibile alla struttura per eliminare il rumore, adattarsi alla liquidità e mantenere solo gli squilibri più rilevanti per decisioni operative precise. Vantaggi principali Rilevamento accurato degli FVG: individua
FREE
Check my paid tools they work great and I share Ea's based on them for free please r ate The Dual Timeframe RSI (Relative Strength Index) indicator is a novel trading tool that allows traders to monitor RSI readings from two different timeframes on a single chart. This dual perspective enables traders to identify potential trend confirmations and divergences more effectively. For instance, a trader might use a 1-hour RSI alongside a daily RSI to ensure that short-term trades align with the broa
FREE
Automated Timeframe cycling with Symbols centered.  Force every timeframe onto one clock window, so the story you see on Daily is the same story you are slicing on H4, H1, and M1.  Traders usually flip timeframes and lose the span. A Daily chart shows a few weeks, then M15 shows a few hours, and the eye treats them as different markets. This indicator locks the window to N bars of the highest enabled timeframe — default 10 Daily — and maps every lower timeframe to that same stretch. You stay ins
FREE
Blahtech VWAP
Blahtech Limited
5 (3)
Blahtech VWAP - Volume Weighted Average Price (VWAP) is the ratio of price to total volume. It provides an average price over a specified time interval.  Links [  Install  |  Update  |  Documentation   ] Feature Highlights Configurable VWAP Line Sessions, intervals, anchored or continuous Previous day settlement line Standard Deviation bands Alerts at bar close or real time Automatic Broker or Tick volumes Significantly reduced CPU usage Input Parameters Expert Advisor Mode  - Reserved for iC
FREE
OrderBlock TS Roman
Vladislav Vlastovskii
4 (6)
Индикатор строит блоки заказов (БЗ) по торговой системе (ТС) Романа. Поиск блоков осуществляется одновременно на двух таймфремах: текущем и старшем (определяемым в настройках). Для оптимизации и игнорирования устаревших блоков в настройках задается ограничение количества дней в пределах которых осуществляется поиск блоков. Блоки строятся по правилам ТС состоящем из трех шагов: какую свечу вынесли (что?); какой свечой вынесли (чем?); правило отрисовки (как?).
FREE
TrendXpert Indicator
Samuel Ayienda Omanga
TrendXpert Indicator v1.02 – Master the Trend, Trade with Precision Overview TrendXpert v1.02 is a precision tool built for serious traders who want to stay on the right side of the market. Designed specifically for the 4H, 1H, and 30M timeframes, it helps you identify high-probability trend conditions and delivers timely, clean trade signals—without clutter or confusion. What’s New in v1.02 Enhanced Trend Detection : Improved internal logic ensures even greater accuracy in trend labeling and
FREE
Rainbow MT4
Jamal El Alama
Rainbow MT4 is a technical indicator based on Moving average with period 34 and very easy to use. When price crosses above MA and MA changes color to green, it’s a signal to buy. When price crosses below MA and MA changes color to red, it’s a signal to sell. The Expert advisor ( Rainbow EA MT4) based on Rainbow MT4 indicator, as you can see in the short video below is now available here .
FREE
SuperTrend V
Muhammad Hassaan
*This is TradingView indicator converted to mql4* The SuperTrend V indicator is a popular technical analysis tool used to identify trends and potential trend reversals in financial markets. It is based on the concept of the SuperTrend indicator but incorporates additional features and variations. The SuperTrend V indicator uses a combination of price action and volatility to determine the trend direction and generate trading signals. Here are the key components and features of the indicator: Ca
FREE
Discover the power of precision and efficiency in your trading with the " Super Auto Fibonacci " MT4 indicator. This cutting-edge tool is meticulously designed to enhance your technical analysis, providing you with invaluable insights to make informed trading decisions. Key Features: Automated Fibonacci Analysis: Say goodbye to the hassle of manual Fibonacci retracement and extension drawing. "Super Auto Fibonacci" instantly identifies and plots Fibonacci levels on your MT4 chart, saving you tim
FREE
Market Profile 3
Hussien Abdeltwab Hussien Ryad
3 (2)
Market Profile 3 MetaTrader 4 indicator  — is a classic Market Profile implementation that can show the price density over time, outlining the most important price levels, value area, and control value of a given trading session. This indicator can be attached to timeframes between M1 and D1 and will show the Market Profile for daily, weekly, monthly, or even intraday sessions. Lower timeframes offer higher precision. Higher timeframes are recommended for better visibility. It is also possible t
FREE
PZ The Zone
PZ TRADING SLU
4.33 (3)
This indicator displays buy or sell signals according to Bill Williams' definition of the Trading Zone. [ Installation Guide | Update Guide | Troubleshooting | FAQ | All Products   |  Get Help ] Easy to use and understand Avoid trading flat markets Deterministic indicator with clear rules The indicator is non-repainting It implements alerts of all kinds It has straightforward trading implications. A blue arrow is a buy signal A red arrow is a sell signal According to Bill Williams trading in t
FREE
MACD stopper x2 free
Andrii Malakhov
4 (1)
The MACD_stopper_x2 indicator shows where the trend has a tendency to stop or reverse. It uses the standard MACD indicator and a proprietary formula for processing data obtained from MACD. There are 2 types of stop/reversal signals: Small cross - probability of a trend stop/reversal is 70-80%; Large cross - probability of a trend stop/reversal is 80-80%; If there are open trades (for example, BUY) on the symbol the indicator is attached to, and the BUY trend ends, the indicator sends push notifi
FREE
Gli utenti di questo prodotto hanno anche acquistato
Trend SniperX MT4
Sarvarbek Abduvoxobov
5 (5)
Trend Sniper X è un indicatore di trend-following multi-timeframe per MetaTrader 5 che aiuta i trader a identificare la direzione del trend e i potenziali punti di inversione con chiarezza e precisione. Per MT5: https://www.mql5.com/en/market/product/181101 Informazioni sul prezzo: Il prezzo attuale è promozionale ed è soggetto a modifiche con il rilascio dei prossimi aggiornamenti e nuove funzionalità. Canale Code2Profit Domina il mercato con l'analisi multi-timeframe! Come massimizzare il tuo
Zoryk Gold mt4
Reda El Koutbane
5 (3)
ZORYK — Sistema avanzato di segnali e pianificazione per XAUUSD su MetaTrader 4 Conosci sicuramente questa situazione. Analizzi l’oro, aspetti l’ingresso e finalmente apri la posizione. Il prezzo si muove immediatamente contro di te. Chiudi troppo presto, sposti lo Stop Loss oppure esiti per alcuni secondi. Poco dopo, il mercato raggiunge esattamente la direzione e l’obiettivo che avevi previsto, ma senza di te. Il problema non era sempre la direzione. Il vero problema era l’incertezza. No
M1 Sniper
Oleg Rodin
4.97 (30)
M1 SNIPER è un sistema di indicatori di trading facile da usare. Si tratta di un indicatore a freccia progettato per l'intervallo temporale M1. L'indicatore può essere utilizzato come sistema autonomo per lo scalping sull'intervallo temporale M1 e come parte del tuo sistema di trading esistente. Sebbene questo sistema di trading sia stato progettato specificamente per il trading sull'intervallo temporale M1, può comunque essere utilizzato anche con altri intervalli temporali. Inizialmente ho pro
Tokyo mt4 Indicator
Vasiliy Strukov
5 (9)
Il Tokyo Indicator offre una chiara panoramica visiva della direzione del trend, dei potenziali segnali di trading e delle condizioni di mercato. La sua linea di trend a gradini, codificata a colori, distingue le fasi rialziste (in blu) da quelle ribassiste (in magenta). Frecce direzionali dedicate evidenziano potenziali opportunità di acquisto e vendita al variare del trend visualizzato. Una dashboard integrata riunisce in un'unica visualizzazione pratica il segnale corrente, il bias di mercato
PRO Renko System
Oleg Rodin
5 (31)
PRO Renko System è un sistema di trading altamente accurato appositamente progettato per il trading di grafici RENKO. Questo è un sistema universale che può essere applicato a vari strumenti di trading. Il sistema neutralizza efficacemente il cosiddetto rumore di mercato che consente di accedere a segnali di inversione accurati. L'indicatore è molto facile da usare e ha un solo parametro responsabile della generazione del segnale. Puoi facilmente adattare lo strumento a qualsiasi strumento di
Currency Strength Wizard è un indicatore molto potente che ti fornisce una soluzione all-in-one per un trading di successo. L'indicatore calcola la potenza di questa o quella coppia forex utilizzando i dati di tutte le valute su più intervalli di tempo. Questi dati sono rappresentati in una forma di indice di valuta facile da usare e linee elettriche di valuta che puoi utilizzare per vedere il potere di questa o quella valuta. Tutto ciò di cui hai bisogno è collegare l'indicatore al grafico che
Atomic Analyst
Issam Kassas
5 (14)
Atomic Analyst — MetaTrader 4 Per domande sul prodotto, indicazioni sulla configurazione o supporto tecnico, scrivimi direttamente qui su MQL5. L’indicatore trasforma calcoli complessi del mercato in semplici segnali visivi, candele colorate, letture del trend, livelli di stop-loss e diverse zone di take-profit che i trader possono capire rapidamente e usare in condizioni reali di mercato. Principali utilizzi di trading: Scalping e trading intraday: Progettato per decisioni rapide, frecce chiar
Smart Trend Trading System è un indicatore per MetaTrader 4 che riunisce informazioni sul trend, segnali di entrata e uscita e livelli di prezzo in un unico grafico. Combina più di 10 strumenti di trading in un unico sistema, inclusi rilevamento del trend, zone di inversione, Smart Cloud, logica di trailing stop, supporto e resistenza, colorazione delle candele, avvisi e analisi multi-timeframe. Il sistema è progettato per aiutarti a operare in diverse condizioni di mercato: Mercati in trend: I
Scalper Vault
Oleg Rodin
5 (40)
Scalper Vault è un sistema di trading potente e completo, progettato per i trader che desiderano ottenere risultati costanti nel trading intraday. Questo indicatore ad alta precisione funge da sistema di trading autonomo, offrendo analisi di livello istituzionale sia per il mercato Forex che per le Opzioni Binarie. CONTATTAMI DOPO L'ACQUISTO PER RICEVERE I MIEI CONSIGLI DI TRADING E UN FANTASTICO BONUS! Eliminando le congetture e le complesse analisi manuali, Scalper Vault ti permette di concen
Neuro Poseidon MT4
Daria Rezueva
4.74 (46)
Neuro Poseidon is a new indicator by Daria Rezueva. It combines precise trading signals with adaptive TP/SL levels - creating best possible trades as a result! Message me and get  Neuro Poseidon Assistant  as a gift to automize your trading process! What makes it stand out? 1. Proven profitability on all assets and timeframes 2. Only confirmed BUY and SELL signals present on the chart 3. Adaptive TP & SL levels generated by the software for each trade 4. Easy to understand - suitable for all
Gann Made Easy
Oleg Rodin
4.84 (173)
Gann Made Easy è un sistema di trading Forex professionale e facile da usare che si basa sui migliori principi del trading utilizzando la teoria di mr. WD Gann. L'indicatore fornisce segnali ACQUISTA e VENDI accurati, inclusi i livelli di Stop Loss e Take Profit. Puoi fare trading anche in movimento utilizzando le notifiche PUSH. CONTATTAMI DOPO L'ACQUISTO PER RICEVERE GRATUITAMENTE LE ISTRUZIONI DI TRADING E OTTIMI INDICATORI EXTRA! Probabilmente hai già sentito parlare molte volte dei metodi d
Liquidity Scalper System: un sistema di trading basato sulla liquidità in formato indicatore. La maggior parte degli indicatori mostra solo una freccia, poi è il trader a decidere dove mettere lo stop, dove si trova il target e se fidarsi del segnale. Liquidity Scalper System copre l'intero ciclo del trade: trova i pool di liquidità, dà un segnale alla loro rottura, calcola subito Entry, Stop Loss e tre target, e mostra sul pannello le statistiche e i risultati della verifica su dati nuovi. Il
SR Liquidity
Oleg Rodin
5 (2)
SR Liquidity è un indicatore di trading progettato per individuare le zone nascoste in cui si concentra la liquidità di mercato e dove il prezzo reagisce con maggiore intensità. Queste aree di liquidità agiscono come potenti livelli di supporto e resistenza, offrendo una mappa chiara dei punti in cui è più probabile che il mercato inverta la propria direzione. Invece di tracciare le classiche linee di supporto e resistenza, SR Liquidity analizza l'effettivo comportamento dei prezzi per individua
AW Prime Oscillator
AW Trading Software Limited
5 (1)
Una combinazione di due oscillatori. Il primo mostra i punti di ingresso, il secondo mostra l'andamento attuale. L'indicatore può visualizzare i segnali dell'oscillatore tramite frecce in due modalità, tutti i segnali dell'oscillatore veloce o segnali solo nella direzione della tendenza attuale. Ha un pannello multi-intervallo temporale e tre tipi di notifiche di segnali. Benefici: Adatto per il trading giornaliero e scalping Filtraggio delle tendenze Configurazione semplice e sensibile Pannello
CRT Candle Range Theory HTF MT4 - Ultimate CRT Indicator: Concetti ICT avanzati e sistema di trading Malaysian SnR Padroneggia le orme dei Market Maker con l'indicatore Candle Range Theory più avanzato. Sblocca il vero potere degli Smart Money Concepts (SMC) e fai trading con la stessa precisione delle istituzioni grazie all'Ultimate CRT Indicator. Costruito esclusivamente per i trader seri, questo indicatore automatizza la teoria CRT, un pilastro centrale dei Concetti ICT (Inner Circle Trader),
Top Bottom Tracker è un indicatore basato su sofisticati algoritmi che analizza l'andamento del mercato ed è in grado di rilevare i massimi e i minimi del trend / Versione MT5 . Il prezzo aumenterà progressivamente fino a raggiungere i 500$. Prossimo prezzo --> 99$ Caratteristiche Nessuna riverniciatura Questo indicatore non cambia i suoi valori all'arrivo di nuovi dati Coppie di trading Tutte le coppie forex Timeframe Tutti i timeframe Parametri ==== Configurazione dell'indicatore ====
Cycles Predictor Indicator This indicator uses past market cycles to predict future price movements. The indicator scans through past data and considers  combinations  of cycles. When cycles  coincide  at the same future date/time then it is considered a valid future prediction. The predictions are drawn as vertical lines on the right side of the chart in the future. A prediction will often result in type of candle (ex. bull or bear) and/or a reversal point (ex. bottom or top) forming at this ex
Break and Retest Hunter MT4 is a powerful MetaTrader 5 indicator designed to automatically identify support and resistance levels, breakout structures, and potential retest opportunities in real time. Bonus Indicator: After purchasing Break and Retest Hunter , contact me to receive Trade Indicator Assistant EA completely free as a bonus utility. $65 for the next 10 copies . Next price is $120.  Combining adaptive market analysis, clear BUY/SELL signals, Fibonacci-based profit targets, and a pre
Segnale GoldRush Trend Arrow L'indicatore GoldRush Trend Arrow Signal fornisce un'analisi precisa e in tempo reale dei trend, pensata appositamente per gli scalper ad alta velocità e a breve termine nel mercato XAU/USD. Progettato specificamente per il timeframe di 1 minuto, questo strumento mostra frecce direzionali che indicano chiari punti di ingresso, consentendo agli scalper di navigare con sicurezza nelle condizioni di mercato volatili. L'indicatore è composto da frecce di avviso PRIMA
ForexTrendMT4
Andriy Sydoruk
5 (1)
ForexTrendMT4 Indicator: A Reliable Tool for Market Tracking The ForexTrendMT4 indicator offers reliable market trend tracking, filtering out sudden fluctuations and market noise. This tool helps identify trends and signals favorable entry points into the market using arrows. It is suitable for both scalping on shorter timeframes and long-term trading strategies. Based on the principles of technical analysis, ForexTrendMT4 takes into account the cyclical nature of the market. Key Features and A
CRT Multi-Timeframe Market Structure & Liquidity Sweep Indicator Non-Repainting | Multi-Asset | MT5 Version Available MT5 Version:   https://www.mql5.com/en/market/product/162075 Full User Guide — explains what each feature does and why:   https://www.mql5.com/en/blogs/post/767525 Quick Start User Guide  — explains how to configure and in what order:  https://www.mql5.com/en/blogs/post/767540 Indicator Overview CRT Ghost Candle HTF Fractal is a complete institutional-grade market structure too
Super Signal – Skyblade Edition Sistema professionale di segnali di tendenza senza repaint / senza ritardo con tasso di vincita eccezionale | Per MT4 / MT5 Funziona meglio su timeframe più bassi, come 1 minuto, 5 minuti e 15 minuti. Caratteristiche principali: Super Signal – Skyblade Edition è un sistema intelligente di segnali progettato specificamente per il trading di tendenza. Utilizza una logica di filtraggio multilivello per identificare esclusivamente i movimenti direzionali forti, supp
ATTUALMENTE SCONTATO DEL 40% La soluzione migliore per ogni principiante o trader esperto! Questo indicatore è uno strumento di trading unico, di alta qualità e conveniente perché abbiamo incorporato una serie di caratteristiche proprietarie e una nuova formula. Con un solo grafico è possibile leggere la forza delle valute per 28 coppie Forex! Immaginate come migliorerà il vostro trading perché sarete in grado di individuare l'esatto punto di innesco di una nuova tendenza o di un'opportunità
Volume Orderflow Profile
Suvashish Halder
5 (2)
Introducing Volume Orderflow Profile , a versatile tool designed to help traders visualize and understand the dynamics of buying and selling pressure within a specified lookback period. Perfect for those looking to gain deeper insights into volume-based market behavior! MT5 Version -  https://www.mql5.com/en/market/product/122657 The indicator gathers data on high and low prices, along with buy and sell volumes, over a user-defined period. It calculates the maximum and minimum prices during this
Smart Price Action Concepts — MetaTrader 4 Per domande sul prodotto, indicazioni sulla configurazione o supporto tecnico, scrivimi direttamente qui su MQL5. Funzionalità: • Smart Money Concepts SMC • Inner Circle Trading ICT • Price Action PA e Institutional Trading IT • Struttura di mercato in tempo reale e swing structure highs and lows (HH HL LL LH) • Order blocks interni e swing supply and demand in tempo reale • Premium Equilibrium e Discount Zones • Rilevamento automatico Fibonacci con 2 o
True Direction Oscillator
Muhammad Elbermawi
4.85 (364)
Oppure (TDO) che è un indice che misura il tasso di variazione del prezzo utilizzando il principio del " Pure Momentum ". Quando il prezzo di un titolo avanza da 10 a 15, il tasso di variazione del prezzo è del 150%, ma quando scende da 15 a 10, il tasso di variazione del prezzo è solo del 33,3%. Ecco perché gli indicatori di analisi tecnica come "Price Rate of Change" (ROC) o "Momentum" forniscono letture più elevate per i movimenti di prezzo ascendente rispetto a quelli dati a quelli discenden
Trend Lines PRO
Roman Podpora
5 (2)
LINEE DI TENDENZA PRO       Aiuta a capire dove il mercato sta realmente cambiando direzione. L'indicatore mostra reali inversioni di tendenza e punti in cui i principali attori rientrano. Vedi  Linee BOS   Cambiamenti di tendenza e livelli chiave su timeframe più ampi, senza impostazioni complesse o rumore inutile. I segnali non vengono ridisegnati e rimangono sul grafico dopo la chiusura della barra. VERSIONE MT 5     -      Svela il suo massimo potenziale se abbinato all'indicatore   RFI LEVE
Attualmente 30% di sconto! La soluzione migliore per ogni principiante o trader esperto! Questo software per cruscotti funziona su 28 coppie di valute. Si basa su 2 dei nostri indicatori principali (Advanced Currency Strength 28 e Advanced Currency Impulse). Offre un'ottima panoramica dell'intero mercato Forex. Mostra i valori di forza delle valute avanzate, la velocità di movimento delle valute e i segnali per 28 coppie Forex in tutti i (9) timeframe. Immaginate come migliorerà il vostro tra
Advanced Supply Demand
Bernhard Schweigert
4.91 (302)
Speciale Trading- SCONTO DEL 30% La soluzione migliore per qualsiasi trader principiante o esperto! Questo indicatore è uno strumento di trading unico, di alta qualità e conveniente, perché abbiamo incorporato una serie di funzionalità proprietarie e una nuova formula. Con questo aggiornamento, potrai visualizzare doppie zone di timeframe. Non solo potrai visualizzare un TF più alto, ma anche entrambi, il TF del grafico e il TF più alto: MOSTRA ZONE ANNIDATE. Tutti i trader che operano con Of
KT Parabolic RSI MT4
KEENBASE SOFTWARE SOLUTIONS
KT Parabolic RSI overlays Parabolic SAR directly on the RSI line to highlight likely market turning points. Classic RSI overbought and oversold readings already hint at reversals, and the added PSAR filter removes much of the noise and sharpens those signals, giving you clearer trade setups. Big Square Signals: A Parabolic SAR flip on an RSI that sits in overbought or oversold territory. These mark high-probability market turns. Small Square Signals: A SAR flip inside the neutral RSI band. Treat
Altri dall’autore
Zoryk Gold
Reda El Koutbane
4.78 (18)
ZORYK — Sistema avanzato di segnali XAUUSD per MetaTrader 5 Conosci sicuramente questa sensazione. Passi molto tempo ad analizzare l’oro. Aspetti il punto d’ingresso corretto. Finalmente apri l’operazione e il prezzo inizia immediatamente a muoversi contro di te. Chiudi troppo presto, sposti lo Stop Loss o esiti per alcuni secondi. Successivamente il mercato raggiunge esattamente l’obiettivo che avevi previsto inizialmente, ma senza di te nella posizione. Il problema non era sempre la direzione.
Voluris Volume profile engine
Reda El Koutbane
4.92 (13)
Fai trading sull'oro (XAUUSD)? Consulta qui la guida VOLURIS al trading sull'oro. VOLURIS — motore Volume Profile Sai già come fare trading. Semplicemente non riesci a vedere ciò che dovresti vedere. Questa sensazione l’hai già provata. Entri. Il prezzo si muove immediatamente contro di te. Vieni stoppato. Poi, subito dopo, il prezzo si gira e va esattamente dove pensavi che sarebbe andato. Avevi ragione. Eri solo entrato troppo presto. O troppo tardi. O entrambe le cose. Riguardi il grafico
FREE
Zoryk Gold mt4
Reda El Koutbane
5 (3)
ZORYK — Sistema avanzato di segnali e pianificazione per XAUUSD su MetaTrader 4 Conosci sicuramente questa situazione. Analizzi l’oro, aspetti l’ingresso e finalmente apri la posizione. Il prezzo si muove immediatamente contro di te. Chiudi troppo presto, sposti lo Stop Loss oppure esiti per alcuni secondi. Poco dopo, il mercato raggiunge esattamente la direzione e l’obiettivo che avevi previsto, ma senza di te. Il problema non era sempre la direzione. Il vero problema era l’incertezza. No
Filtro:
pipyoda
56
pipyoda 2026.08.30 15:20 

Hi Reda,

I have started adding volume analysis to my trading and currently using this indicator. It is superb and well put together for novice and professional alike. Very well done sir, great tool, I love it.

anakinxbask
36
anakinxbask 2026.08.07 22:28 

L'utente non ha lasciato alcun commento sulla valutazione.

jaewon yang
282
jaewon yang 2026.08.07 08:02 

L'utente non ha lasciato alcun commento sulla valutazione.

Elmar Votri
223
Elmar Votri 2026.07.03 14:43 

Mr El Koutbane, I hope this message finds you well. I would like to congratulate you on the outstanding job you did on this product. The quality, attention to detail, and overall experience are truly impressive. Thank you for your hard work and dedication. Please keep up the excellent work!

Reda El Koutbane
26563
Risposta dello sviluppatore Reda El Koutbane 2026.07.03 14:58
Thank you so much for this it really means a lot to me. Comments like yours are honestly what keep me motivated to keep improving and building.
I really appreciate you taking the time to leave a review — not many people do, and when someone does, it genuinely makes a difference. I wish more people were like you in that sense.
Also wanted to mention, I'm currently working on a premium version of the indicator, so stay tuned for that.
Thanks again, truly appreciate the support.
Molefi Mokhethi
631
Molefi Mokhethi 2026.06.24 10:27 

Its great. I use it with SMT.

Reda El Koutbane
26563
Risposta dello sviluppatore Reda El Koutbane 2026.06.24 10:58
thank you very much for the review and good luck for your trading journey
Mustafa Cetin
293
Mustafa Cetin 2026.06.23 14:18 

L'utente non ha lasciato alcun commento sulla valutazione.

Reda El Koutbane
26563
Risposta dello sviluppatore Reda El Koutbane 2026.06.23 14:27
Thank you very much for your kind review. I really appreciate it. About your question, just so I understand correctly and can improve it properly, do you mean the Signal section closes when you change the symbol/currency pair, when you change the timeframe, or when the live price updates on the chart? Please tell me exactly when it happens, and I will either explain the behavior or improve it in the next update right now.
Rispondi alla recensione