Institutional Edge
- Indicatori
- Versione: 3.0
- Attivazioni: 5

The only indicator you need to trade like the institutions.
SMC Pro combines five core Smart Money Concepts tools into a single, clean, and fully customizable indicator for MetaTrader 5. No repainting. No clutter. Everything you need to read the market the way banks and hedge funds do.
What it does
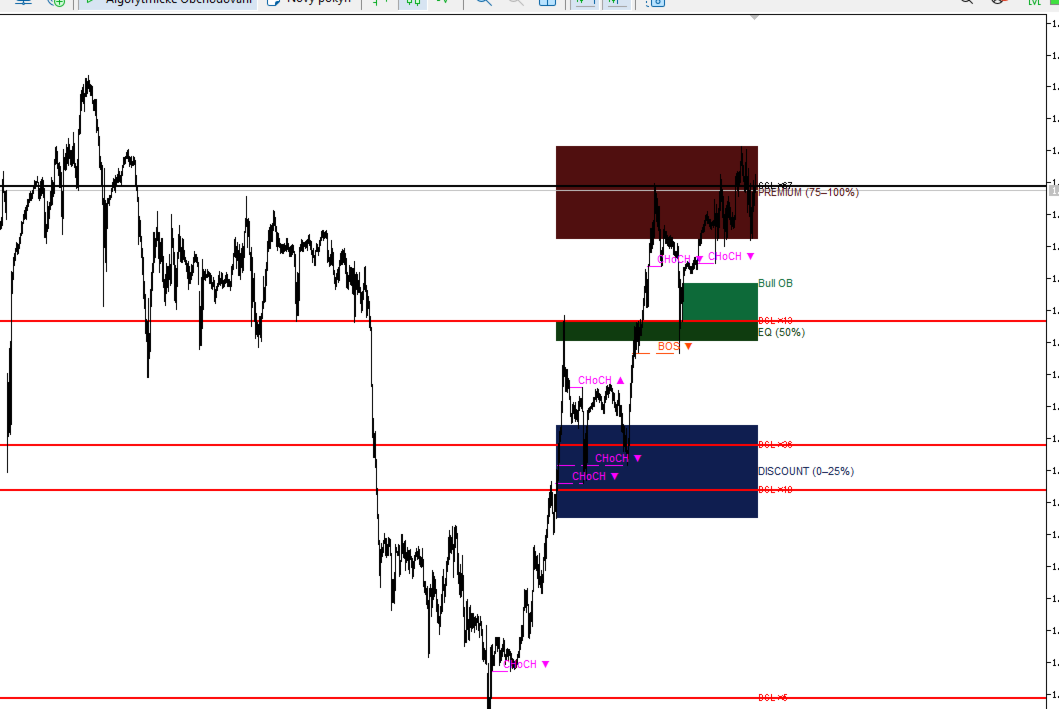
🟩 Order Blocks
Automatically detects bullish and bearish Order Blocks — the price zones where institutional orders were placed before a major move. The indicator marks the OB box and its 50% midline, which often acts as a precise entry point. Mitigated OBs are filtered out by default so you only see what's still relevant.
🟦 Fair Value Gaps (FVG)
Highlights imbalances in price — gaps between candles that price tends to return and fill. Both bullish and bearish FVGs are detected and displayed as clean boxes. Filled FVGs are hidden automatically, keeping your chart uncluttered.
🔵 Break of Structure (BOS) + Change of Character (CHoCH)
Identifies the market structure in real time. BOS confirms trend continuation, while CHoCH signals a potential reversal. Both are drawn as dashed lines directly at the broken swing level with a clear label at the midpoint — not at the edge of the screen.
🟡 Liquidity Heatmap
Plots Equal Highs (Sell-Side Liquidity / SSL) and Equal Lows (Buy-Side Liquidity / BSL) as horizontal dotted lines. These are the price levels where stop losses cluster — exactly where Smart Money hunts before the real move begins. Swept levels are removed automatically.
🔴🟢 Premium / Discount Zones
Divides the current price range into three zones based on the swing high and low: Premium (75–100%), Equilibrium (50%), and Discount (0–25%). Institutional buyers look for longs in Discount, shorts in Premium.
Why SMC Pro is different
Anti-collision label system — all labels on the right edge of the chart are automatically spaced so they never overlap, no matter how many levels are active at once.
Clean visuals — boxes, lines, and labels are layered correctly (PD zones in the background, structure lines in front). Nothing covers anything it shouldn't.
Redraws only on new bar — zero performance impact during live trading. The indicator recalculates only when a new candle opens.
Fully customizable — every module has its own input group with on/off toggle, lookback period, colors, and display options. Turn off what you don't need.
Works on all symbols and timeframes — Forex, Gold, Silver, Oil, Indices, Crypto. Scalping on M5 or swing trading on D1.
Inputs overview
| Group | Key inputs |
|---|---|
| Order Blocks | Show, Lookback, Max boxes, Show mitigated, Bull/Bear color |
| Fair Value Gaps | Show, Lookback, Max boxes, Show filled, Bull/Bear color |
| BOS + CHoCH | Show, Lookback, Swing length, BOS/CHoCH colors, Line width |
| Liquidity | Show, Lookback, Tolerance %, Min touches, SSL/BSL colors |
| Premium/Discount | Show, Lookback, Premium/EQ/Discount colors |
| General | Object prefix |
How to use
- Attach SMC Pro to any chart on any timeframe.
- Identify the current zone — are we in Premium, Discount, or EQ?
- Wait for price to reach an unmitigated Order Block or FVG inside Discount (for longs) or Premium (for shorts).
- Confirm with a CHoCH or BOS in your direction.
- Check that liquidity (SSL/BSL) is nearby — Smart Money often sweeps it before the move.
Requirements
- MetaTrader 5
- Any broker, any symbol
- No internet connection required — fully self-contained