Volume Suite

FoxWave Volume Suite combines three essential volume-based tools into a single indicator: a horizontal Volume Profile with Point of Control and Value Area, a real-time volume spike detector with instant alerts, and a buy/sell pressure delta gauge. No need to run three separate indicators — everything you need to read volume is in one clean Fox Wave panel.

What it does

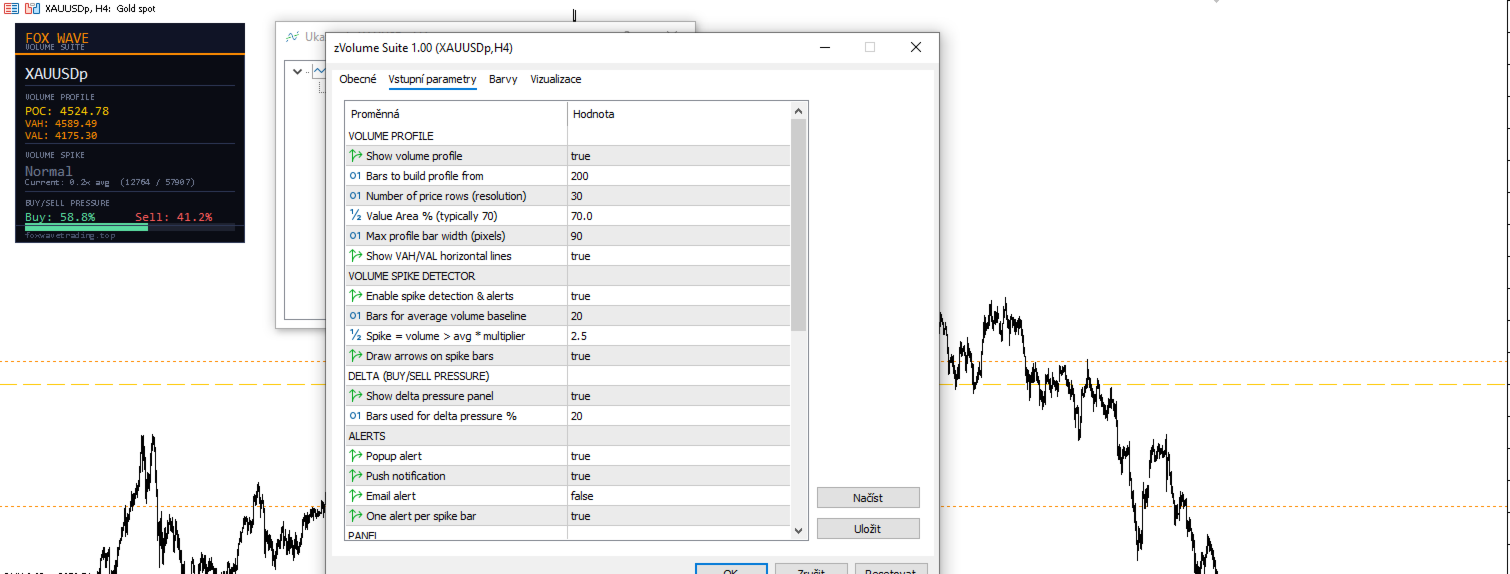
► Volume Profile (POC / VAH / VAL) Builds a horizontal histogram showing how much volume traded at each price level over your chosen lookback period. The indicator automatically identifies:

  • POC (Point of Control) — the price level with the highest traded volume, marked with a dashed line across the chart
  • VAH (Value Area High) and VAL (Value Area Low) — the boundaries of the price range containing your configured Value Area percentage (70% by default), marked with dotted lines

VAH and VAL lines can be toggled independently from the profile itself, so you can keep a clean chart with just the key levels if you prefer. Profile rows are color-coded: gold for POC, orange for the Value Area, blue for the rest — so the highest-volume zones stand out immediately.

► Volume Spike Detector Continuously compares current bar volume against a rolling average. When volume exceeds your configured multiplier (default 2.5x the average), the indicator marks the bar with an arrow directly on the chart and fires an alert — letting you catch unusual activity the moment it happens, not after the fact.

► Buy/Sell Pressure Delta Estimates buying versus selling pressure using each bar's close position within its range, weighted by volume — a widely used proxy for order flow direction on retail data feeds. Displayed as a live percentage split with a visual bar in the panel, giving you a quick read on which side is currently in control.

Note on Delta: MetaTrader 5 retail price feeds provide tick volume, not true bid/ask executed volume. This delta is calculated using a standard close-position-weighted-by-volume method as an approximation of order flow pressure — it is not Level 2 / true tape data. It works as a directional pressure gauge, not as exact buy/sell volume.

► Instant Spike Alerts The moment a volume spike is detected, get notified through:

  • 🔔 Popup — on-screen alert window
  • 📱 Push notification — straight to your MetaTrader mobile app
  • 📧 Email — sent to your registered MT5 address

"Alert only once" mode prevents repeated notifications for the same spike bar.

► Fox Wave Info Panel A single compact panel shows everything at a glance: current POC/VAH/VAL prices, current spike status with volume ratio, and the live buy/sell pressure split with a visual bar.

Key Features

  • Three tools in one indicator: Volume Profile, Spike Detector, Delta
  • Configurable Value Area percentage (standard 70%, adjustable)
  • Independent toggle for VAH/VAL lines vs. the profile itself
  • Adjustable profile resolution (number of price rows)
  • Configurable spike sensitivity (average period + multiplier)
  • Visual spike arrows directly on the chart, color-coded by direction
  • Triple alert system: popup + push + email, each switchable independently
  • Smart alert reset — one alert per spike bar, no spam
  • Full color customization for every element
  • Consistent Fox Wave dark panel design

Inputs Reference

Volume Profile

Parameter Default Description
ShowVolumeProfile true Enable the volume profile
ProfileBars 200 Number of bars used to build the profile
ProfileRows 30 Number of price rows (resolution)
ValueAreaPercent 70.0 Value Area percentage
ProfileWidth 90 Maximum profile bar width (pixels)
ShowVAHVALLines true Show VAH/VAL horizontal lines independently

Volume Spike Detector

Parameter Default Description
ShowSpikeAlerts true Enable spike detection and alerts
SpikeAvgPeriod 20 Bars used for the average volume baseline
SpikeMultiplier 2.5 Spike threshold (volume > average × multiplier)
MarkSpikesOnChart true Draw arrows on spike bars

Delta (Buy/Sell Pressure)

Parameter Default Description
ShowDelta true Show the delta pressure panel
DeltaLookback 20 Bars used to calculate pressure percentage

Alerts

Parameter Default Description
AlertPopup true On-screen popup alert
AlertPush true Push notification to mobile app
AlertEmail false Email alert
AlertOnlyOnce true One alert per spike bar

Colors Full color customization for profile rows, POC, Value Area, spike markers, and buy/sell delta indicators.

Panel Position

Parameter Default Description
PanelX 15 Horizontal offset from chart edge
PanelY 25 Vertical offset from chart edge

How to set up push notifications

  1. Open MetaTrader 5 on your mobile device
  2. Go to Settings → Messages and copy your MetaQuotes ID
  3. In MT5 desktop: Tools → Options → Notifications
  4. Paste your MetaQuotes ID and enable notifications
  5. Set AlertPush = true in the indicator inputs

Who is it for?

  • Volume-based traders who want POC, Value Area and spike detection without juggling multiple indicators
  • Scalpers who need to catch unusual volume activity the instant it happens
  • Traders who track order-flow pressure but don't have access to Level 2 data
  • Anyone who wants a single, clean volume toolkit instead of a cluttered chart full of separate indicators

Compatibility

  • Platform: MetaTrader 5
  • Works on all symbols: Forex pairs, indices, commodities, crypto, metals
  • Works on any chart timeframe
  • No DLL imports required
  • Delta calculation uses tick volume (standard for retail Forex feeds); for symbols with true exchange volume (e.g. futures, some crypto pairs), accuracy is correspondingly higher

Altri dall’autore
If you need more information than a few numbers in the iExposure index, this indicator is for you. Better iExposure indicator is an improvement over the original information, such as: Separate profit column for BUY and SELL Separate SL column for BUY and SELL Separate TP column for BUY and SEL Average Price as Horizontal Line in Chart Pip Value Profit https://www.facebook.com/groups/prop4y iExposure will show the opening of trading positions in tabular form in the sub-window below the main wi
Cool iExposure
Zbynek Liska
5 (1)
If you need more information than a few numbers in the iExposure index, this indicator is for you. Better iExposure indicator is an improvement over the original information, such as: Separate profit column for BUY and SELL Separate SL column for BUY and SELL Separate TP column for BUY and SEL Average Price as Horizontal Line in Chart Pip Value www.foxwave.eu
Basic tool Showing annual candle, range for Day, range for Week, range for Month, range for Year. Showing fibonacci for Day fibonacci for Week, fibonacci for Month, fibonacci for Year. Showing percent change for Day, percent change for Week, percent change for Month, percent change for Year. Showing distance of the current value the previous close for Day, Week, Month, Year.
What are Fibonacci Numbers and Lines? Fibonacci numbers are used to create technical indicators using a mathematical sequence developed by the Italian mathematician, commonly referred to as "Fibonacci," in the 13th century. The sequence of numbers, starting with zero and one, is created by adding the previous two numbers. For example, the early part of the sequence is 0, 1, 1, 2, 3, 5, 8, 13, 21, 34, 55, 89,144, 233, 377, and so on. The Fibonacci sequence is significant because of the so-calle
This is a simple and very effective utility for closing in profir or in loss. Constant overview of daily Draw Down, Current profit and Daily profit This utility will save your deposit in case of a sharp market change. Just add it to any free chart and use it for your daily trading. Thanks to the minimal set of parameters, you can easily set up the utility for any symbol in MT4
Easy EA for closing positions with profit or loss. All positions of chart's symbol are counted separately. Settings: TPforSymbol — set profit amount to indicate when to close every positions for the symbol of the chart. Swap and commission are decreasing your profit. SLforSymbol — set SL amount to indicate SL for every positions for the symbol of the chart. Swap and commission are increasing your loss. SLforSyblol is always below/equal zero.
This multi-currency annual dashboard analyzes the nearest high and low to the current price for a chosen number of recent years. It displays how many pips away the price is from the nearest high or low. You can set a pip threshold, and the alert will notify you when the price gets close to the specified levels. In real-time, the dashboard also provides an overview of the closest high or low values for each specific year, helping you make informed trading decisions.
Key level analysis : The indicator tracks the nearest annual high and low to the current price over a chosen number of years. Proximity alerts : It triggers an alert when the price reaches a specified number of pips from the nearest high or low. Customizable notification intervals : You can set how often alerts repeat, for example, every 30 minutes. Historical perspective : Enables long-term tracking of market levels and effective planning of trading strategies. Multi-currency support : This ind
iExposure Fox Wave – Comprehensive Position Monitoring Indicator iExposure Fox Wave is an advanced MetaTrader indicator designed to provide detailed monitoring of all open trading positions in a clear, tabular format. This tool is perfect for traders who want all essential trade information in one place. Key Features: Symbol: Displays the instruments (currency pairs or other symbols) with open positions. Deals: Number of open trades (transactions) for each symbol. Buy lots & Buy price: Total vol
RangeDashboard – Multi-symbol Daily, Weekly, and Monthly Range Overview with Alerts RangeDashboard is a powerful and user-friendly indicator that displays the current range (high-low) of selected currency pairs or instruments over a chosen timeframe (D1, W1, MN1) directly on the chart. It allows you to input a customizable list of symbols, add suffixes if needed, and select the timeframe from which the ranges are calculated. Key Features: Dynamic calculation of ranges for any number of symbols o
Fox Wave PSAR – PSAR Dashboard for Multiple Symbols and Timeframes Description: Fox Wave PSAR is a powerful indicator for MetaTrader 5 that allows you to monitor the Parabolic SAR (PSAR) across multiple symbols and timeframes directly in a clear and convenient dashboard. It is ideal for scalping, intraday, and long-term trading strategies. Key Features: Clear dashboard with a list of symbols and their current PSAR status. Supports any number of symbols and customizable suffixes (e.g., ".m"). Di
New High / Low Dashboard Scanner is not a common indicator. It is a market-structure control system designed to monitor, in real time, the creation of new Highs and Lows across Daily, Weekly, Monthly, and Yearly time horizons — while simultaneously measuring the exact distance of price from these critical levels in pips. This tool is built for traders who do not want to react late, but instead want to stand at the origin of market movement . What the system does The dashboard continuously scan
Short Description Fox Wave Account Nexus is a professional dashboard for real-time monitoring of multiple MetaTrader 5 accounts across different terminals from a single chart. Full Description  Fox Wave Account Nexus Professional Multi-Account Monitoring Dashboard for MetaTrader 5 Fox Wave Account Nexus is a powerful visual dashboard designed for traders who operate multiple MT5 accounts simultaneously and need instant, centralized control . The indicator collects live data from all con
Fox Wave Pro Copier - Professional Multi-Master Trade Copier Copy trades from multiple Master accounts simultaneously with advanced risk management Key Features Multi-Master Architecture Copy from unlimited master accounts simultaneously Automatic master account detection or manual configuration Real-time trade synchronization via file system Independent risk management for each master Advanced Risk Management Individual risk settings per master account Automatic lot size calculation based
TREND SCANNER PRO - Multi-Timeframe Trend Analysis Dashboard Professional real-time trend scanner that monitors up to 15 currency pairs across 8 timeframes simultaneously. Get instant market overview with epic visual dashboard, smart alerts, and zero lag performance. KEY FEATURES
Professional Averaging Calculator - Essential Risk Management Tool for Every Trader Whether you're a beginner learning position averaging or a professional managing complex grid strategies, this calculator is your must-have tool. Beginners instantly see how averaging works, understand maximum loss scenarios, and learn proper risk management before entering trades - no more "I didn't know I could lose that much" surprises. Professionals save time and eliminate calculation errors with instant simu
SMC Pro — Smart Money Concepts All-in-One The only indicator you need to trade like the institutions. SMC Pro combines five core Smart Money Concepts tools into a single, clean, and fully customizable indicator for MetaTrader 5. No repainting. No clutter. Everything you need to read the market the way banks and hedge funds do. What it does Order Blocks Automatically detects bullish and bearish Order Blocks — the price zones where institutional orders were placed before a major move. The indic
Calculate the exact entry price or lot size needed to reach your target average — directly on the chart. Full description A lightweight MT5 indicator that solves a common trading problem: if I add to my position at market price, what volume do I need to reach my target average? Or the reverse: if I want to add a fixed lot size, at what price must I enter? The panel reads your open positions automatically, displays the current average entry price with a dashed line on the chart, and lets you s
Spread Recorder — Multi-Symbol Max/Min Dashboard Spread Recorder is a real-time multi-symbol dashboard that continuously monitors live spreads across your entire watchlist and permanently records the maximum and minimum spread ever seen for each symbol — with timestamps. Key features: Monitor 10, 28, 50+ symbols simultaneously from a single customizable text file Auto-adaptive grid layout — the panel automatically resizes its rows and columns to fit however many symbols you load, from a handful
Swap Monitor — Multi-Symbol Buy/Sell Swap Dashboard with Alerts Swap Monitor is a real-time multi-symbol dashboard that displays live SELL and BUY swap rates for your entire watchlist in one compact, color-coded panel — and can alert you the instant any swap rate changes. Key features: Monitor 10, 28, 50+ symbols simultaneously from a single customizable text file Auto-adaptive grid layout — the panel automatically resizes to fit however many symbols you load Displays both SELL and BUY swap valu
FoxWave SMC Trend Suite  SHORT DESCRIPTION  Smart Money Concepts trend tool: Market Structure (BOS/CHoCH), Order Blocks, FVG and EQH/EQL — fully toggleable, with alerts. FULL DESCRIPTION FoxWave SMC Trend Suite brings the four foundational building blocks of Smart Money Concepts trading into a single, clean indicator: Market Structure shifts (Break of Structure / Change of Character), Order Blocks, Fair Value Gaps, and Equal Highs/Equal Lows liquidity pools. Every component can be switched on or
Fox Wave Pattern Scanner  SHORT DESCRIPTION  Multi-timeframe candlestick pattern scanner: 24 patterns across M5-D1, live dashboard, on-chart markers, one-click TF toggles, alerts. FULL DESCRIPTION Fox Wave Pattern Scanner continuously reads your chart's symbol across six timeframes at once and reports every candlestick pattern it finds in a clean dark dashboard — so you never have to manually flip through timeframes looking for a setup again. Instead of scrolling between M5, M15, M30, H1, H4 and
Filtro:
Nessuna recensione
Rispondi alla recensione