Helix MACD

Helix MACD - Momentum Indicator for US Indices and Gold

Helix MACD is a refined MACD-based indicator for the MetaTrader 5 platform. It is built on the standard MACD crossover logic with three additional filters intended to reduce the number of low-quality signals that a raw MACD produces in ranging or counter-trend conditions.

The indicator is tuned for the H1 timeframe on Nasdaq-100, S&P 500, Dow Jones, and Gold.


What this product is

This is a technical indicator, not an Expert Advisor. It processes price data and notifies the user when its entry conditions are met. It does not place orders and does not manage account balances.

  • Signals: visual BUY and SELL arrows drawn on the price chart, confirmed only on a closed bar. The indicator does not repaint.
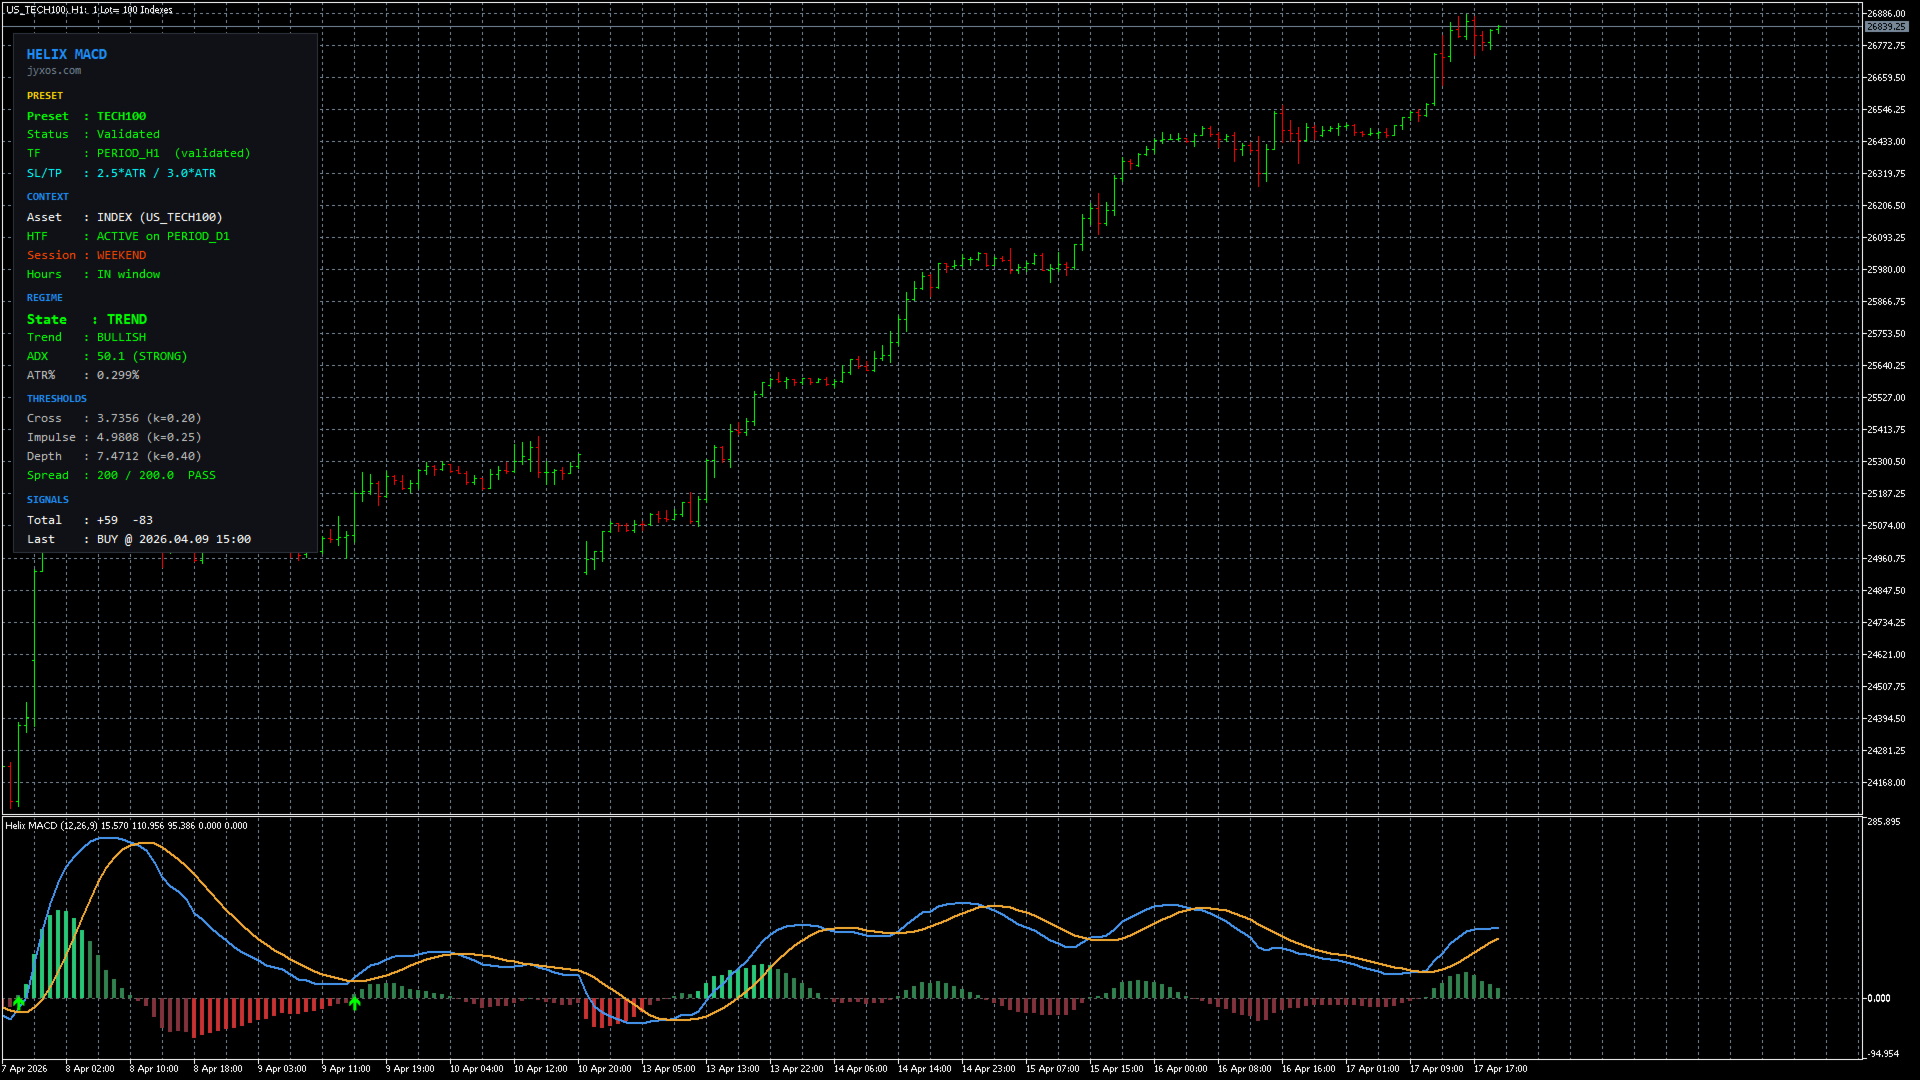
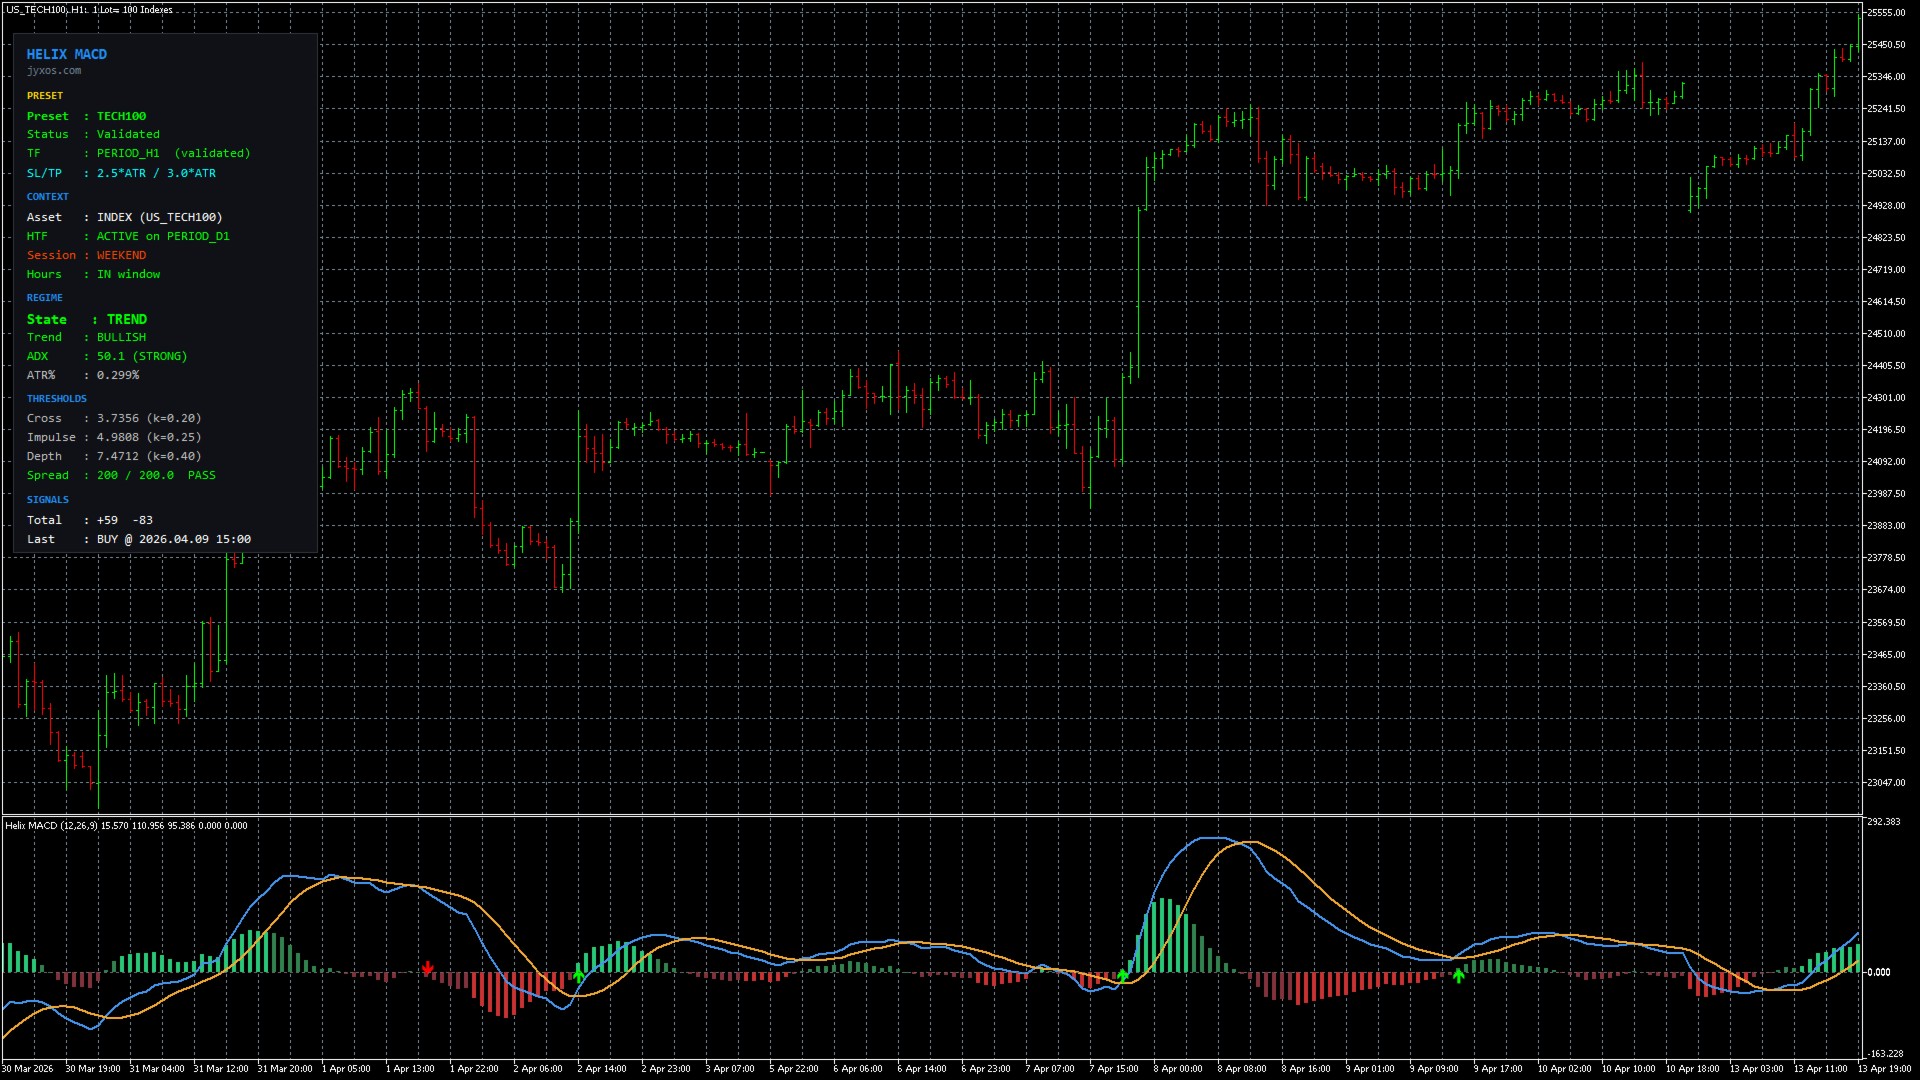
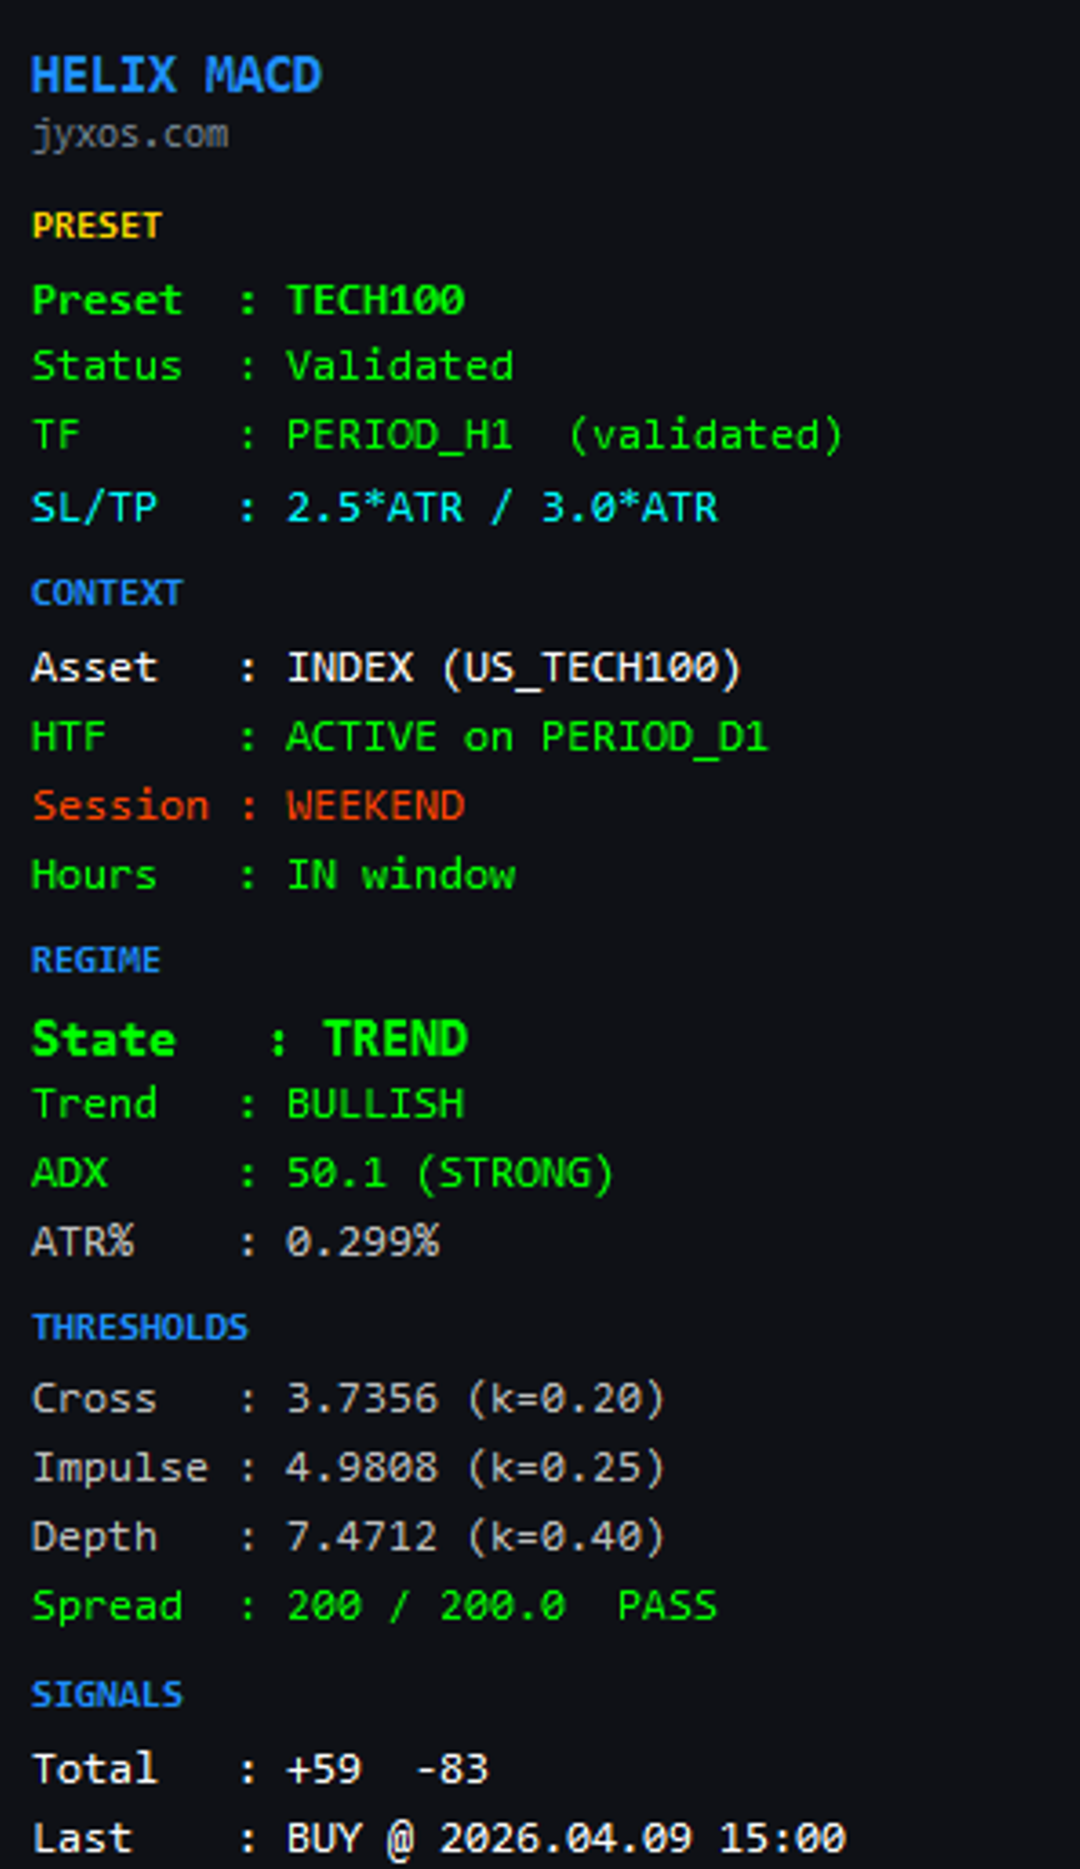
  • Information panel: a floating panel on the chart displaying the active preset, market regime, higher timeframe trend state, session state, and last signal.
  • Refined MACD display: MACD line, signal line and histogram plotted in a separate sub-window below the price.
  • Alerts: platform popup, sound, push notifications to the MetaTrader 5 mobile application, and email. Each alert is configurable independently.

The indicator identifies setups based on a specific rule set. The trader makes every trading decision.


How the three filters work

A standard MACD emits a signal on every zero-line crossover regardless of context. This often produces false signals during ranging markets and during moves against the higher timeframe trend. Helix requires each candidate crossover to pass three checks before an arrow is drawn.

1. Higher timeframe trend alignment. Signals are only generated when they agree with the daily (D1) trend direction. A BUY signal requires price above the D1 EMA200 (or a shorter fallback moving average when broker history is limited). A SELL signal requires price below. Counter-trend crossovers on the H1 are filtered out.

2. Market regime classification. The indicator uses the ADX and an adaptive ATR window to classify the market as TREND, RANGE, VOLATILE, or NORMAL. In VOLATILE conditions the required crossover depth is automatically increased. In RANGE conditions the confirmation logic is more strict.

3. Institutional session window. Signals only fire during periods of higher liquidity.

  • Indices: between 13:30 and 20:00 UTC (regular New York Stock Exchange session)
  • Gold: between 08:00 and 21:00 UTC (London and New York overlap)

Outside these windows the indicator stays idle. The system also includes a spread filter, a one-bar confirmation delay, and a cooldown period after opposite signals to avoid back-to-back losing signals.


Scope of the indicator

The indicator is designed for four symbols only: Nasdaq-100, S&P 500, Dow Jones, and Gold, on the H1 timeframe. Forex pairs and cryptocurrency symbols were evaluated during development but were not included in the final release because they did not meet the author's validation threshold for this specific rule set. The indicator can be applied to other symbols in Custom mode, but the presets and the session filter were not calibrated for them.


Validated symbols and presets

The indicator reads the symbol of the chart it is applied to and loads the corresponding preset automatically:

  • Nasdaq-100 (symbol names containing NAS100, NDX, USTEC, TECH100): Stop Loss 2.5 times the ATR, Take Profit 3.0 times the ATR.
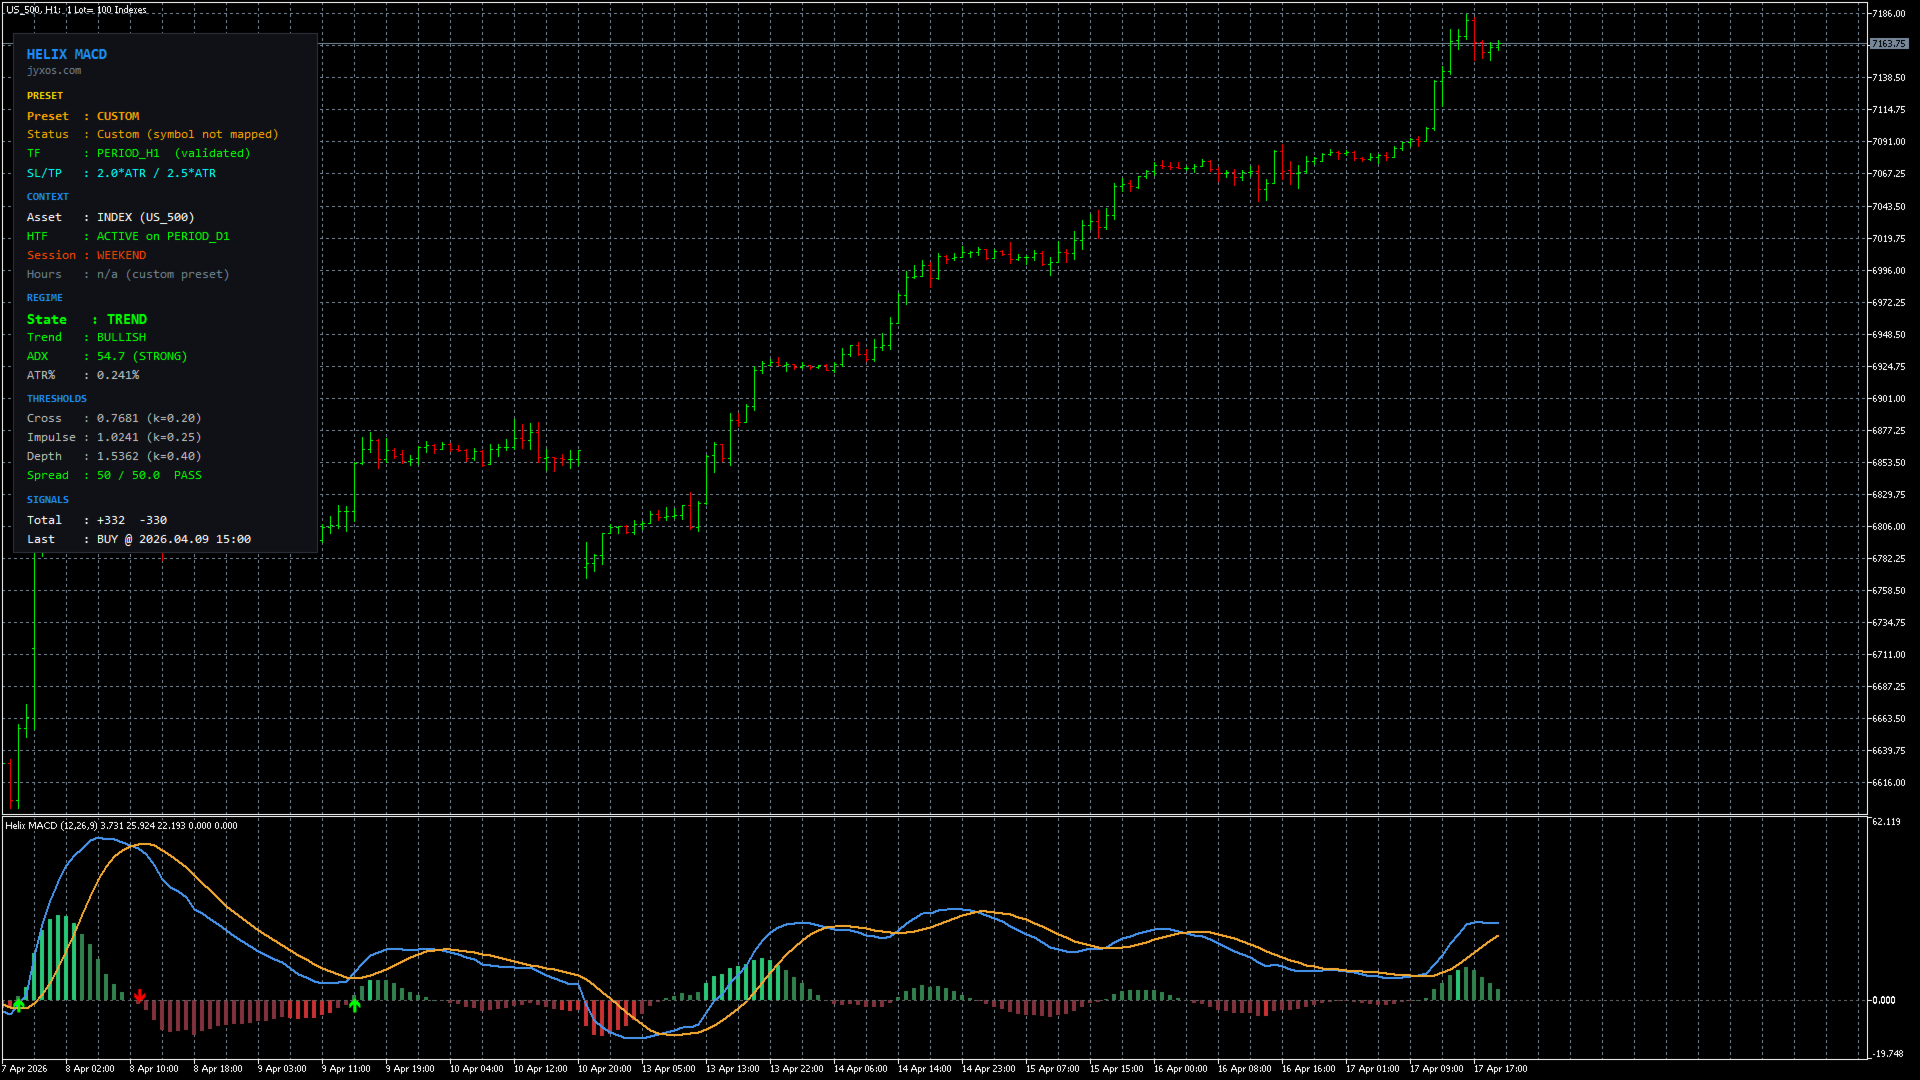
  • S&P 500 (symbol names containing SPX, US500, ES, SP500): Stop Loss 2.0 times the ATR, Take Profit 2.5 times the ATR.
  • Dow Jones (symbol names containing DJ30, US30): Stop Loss 2.0 times the ATR, Take Profit 2.5 times the ATR.
  • Gold (symbol names containing XAUUSD, GOLD): Stop Loss 3.0 times the ATR, Take Profit 5.0 times the ATR.

If the indicator is applied to any other symbol, it falls back to Custom mode. Signals will still be generated, but the trader is responsible for setting appropriate Stop Loss and Take Profit multipliers and for managing the session filter. The information panel clearly indicates when the indicator is in Custom mode.


Getting started

  • Setup: attach Helix MACD to an H1 chart of one of the four validated symbols.
  • Configuration: leave the inputs at their default values. Auto-detection handles the preset selection.
  • Verify the panel: check that the timeframe and higher timeframe rows are shown in green. If the higher timeframe row shows WARMUP, wait approximately 30 to 60 seconds for the daily history to load.
  • Monitor for signals: signals are infrequent, approximately 20 to 30 per year per symbol.
  • Act on alerts: when an alert is triggered, the message contains the signal direction, the entry price, the calculated Stop Loss and Take Profit levels based on the current ATR, and the preset name.

What to expect in the first weeks

The indicator is designed for patient traders. Some calibration of expectations is useful:

  • Signal count in the first month: approximately one to three signals per symbol, sometimes zero. Signals cluster around volatility events rather than the calendar.
  • Losing sequences: based on the historical win rate range of 42 to 56 percent in backtesting, sequences of three or four consecutive losses are statistically expected at some point.
  • First losing trade: is likely to occur within the first three signals. This is not a product defect. The statistical behavior of the indicator emerges over many trades, not over a small sample.
  • Realistic evaluation period: three to six months per symbol.

If the trader expects multiple signals per day or a win rate significantly above 60 percent, this indicator is not suitable.


Input parameters

  • InpPreset: AUTO (default), TECH100, INDEX, GOLD, or CUSTOM. Forces a specific preset.
  • InpSymbolOverride: keyword override for symbols with non-standard names (for example, with broker suffixes).
  • InpCustomSLMult / InpCustomTPMult: ATR multipliers for Stop Loss and Take Profit in Custom preset mode. Defaults 2.0 and 2.5.
  • InpMode: BALANCED (standard) or CONSERVATIVE (approximately 30 percent fewer signals, stricter filters).
  • InpHTFMode: higher timeframe filter, default D1. Disabling this input is not recommended in live use because the trend filter is part of the indicator's design.
  • InpHonorAssetHours: when true (default), signals only fire inside the defined session windows. Disabling this removes the session filter.
  • InpSessionMode: AUTO, ALL, or CUSTOM. Secondary broker session filter.
  • InpAlertPopup, InpAlertSound, InpAlertPush, InpAlertEmail: four independent alert channels.
  • Display parameters: information panel visibility, panel corner position, arrow visibility on the chart.

Safe to change: alert preferences, panel position, arrow visibility.
Change only with a specific reason: InpMode, InpSymbolOverride, InpCustomSLMult, InpCustomTPMult.
Do not change for normal operation: InpHTFMode, InpHonorAssetHours. These two parameters control the filters that the indicator was designed around.


Backtest methodology

The Stop Loss and Take Profit multipliers for each symbol preset were selected through the following procedure on broker-native H1 data from March 2021 through April 2026 (approximately 30,000 bars per symbol):

  • Grid search across 30 combinations of Stop Loss and Take Profit multipliers per symbol.
  • Top candidates by in-sample Sharpe ratio were subjected to walk-forward out-of-sample evaluation.
  • A 50/50 train-test split was used: multipliers were calibrated on the first half of the data and evaluated on the second half, which the calibration procedure did not see.
  • Only configurations with a positive out-of-sample Sharpe ratio and a walk-forward verdict of stable or improved out-of-sample performance were retained.

The backtest was conducted on broker-native data (the same data source a user will see on their charts) and with the same session filter and higher timeframe logic that the indicator applies on a live chart.


Historical backtest results

The following figures are historical backtest results on the validated symbols and are not representative of future performance. Actual live performance will differ.

  • Signal frequency in backtest: approximately 20 to 30 per symbol per year.
  • Win rate in backtest: 42 to 56 percent, depending on symbol and period.
  • Profit factor in backtest: 1.3 to 1.7 across the four symbols in the out-of-sample period.
  • Maximum closed-trade drawdown observed in backtest: approximately 11.6 percent on Gold at 1 percent risk per trade. Indices showed between 2 and 6 percent depending on the period.
  • Reward to risk: the Take Profit multiplier is greater than the Stop Loss multiplier for three of the four presets, with Nasdaq-100 as the exception by design.

Backtest performance is not a guarantee of future results. Live trading involves slippage, variable spreads during news events, execution delays, and other conditions that may not be fully captured in backtesting.


Limitations

  • Low frequency: the indicator is not designed for scalping or high-frequency trading.
  • No guarantee of any win rate or return: a statistical edge manifests over many trades, not over a small sample.
  • Broker dependency: results depend on the quality of the broker's historical data, spread behavior during news events, and session definitions.
  • Limited scope: four symbols, H1 timeframe. Other applications are in Custom mode without validated parameters.
  • No repainting: signals are confirmed only after the bar closes. Signals cannot be acted upon during the formation of the current bar.
  • Proprietary code: the product is distributed as a compiled file. The full rule set is documented in this description. The source code is not shared.

Technical requirements

  • MetaTrader 5 platform, Build 3500 or higher recommended.
  • Any broker that offers at least one of the four validated symbols.
  • Approximately 300 H1 bars of chart history for internal calibration.
  • Daily timeframe history for the higher timeframe filter, which the indicator loads automatically on initialization.

Support

Technical questions, broker compatibility issues, and general clarifications can be submitted through the Comments tab of this product page. When reporting an issue please include:

  • Broker name.
  • Exact symbol name as it appears in the Market Watch window.
  • A screenshot of the information panel showing its complete state.
  • The lines from the MetaTrader 5 Experts log that begin with the indicator identifier.

Response time target: within 48 hours.


Disclaimer

Trading financial markets carries significant risk of loss, which can equal or exceed the initial investment. Trading should not be undertaken with funds that cannot be afforded to be lost.

Helix MACD is a decision-support tool. It is not investment advice, not financial advice, not a solicitation to trade, and not a trading signal service. All trading decisions made based on signals from this indicator are the sole responsibility of the trader.

The author and seller of this indicator are not liable for any losses, damages, lost profits, or missed opportunities arising from the use of this product, directly or indirectly. Historical backtest performance does not constitute any promise, guarantee, or warranty of future performance.

The indicator is sold as-is. The author does not guarantee compatibility with every broker or every MetaTrader 5 terminal configuration. Best-effort support is provided through the Comments tab.

By purchasing this product the buyer represents having read and accepted these terms, being legally permitted to trade financial instruments in the applicable jurisdiction, and using own capital at own risk.


Version

1.0, first public release. Updates for bug fixes, broker compatibility improvements, and code optimization are delivered free of charge through the MetaQuotes Market automatic update system. Major new features, such as additional symbols or timeframes, may be released as a separate product.

Prodotti consigliati
Heiken Ashi Smoothed Strategy is a very simple but powerful system to get forex market trend direction. This indicator is actually 2 indicators in 1 pack, Heiken Ashi and Heiken Ashi Smoothed Moving Average both included. Because HA (Heiken Ashi) and HAS (Heiken Ashi Smoothed) are calculated in the same one system event with necessary buffers and loop only, so it is the FAST, OPTIMIZED and EFFICIENT HA having the combined indicator of MetaTrader 5. You can choose to display HA and HAS in the sam
Indicatore Crypto_Forex HTF ADX per MT5. - Migliora i tuoi metodi di trading con l'indicatore professionale HTF ADX per MT5. HTF significa "Higher Time Frame". - L'ADX (linea rossa) viene utilizzato per misurare la forza del trend: se il valore dell'ADX è superiore a 20 e ha una forma ascendente, il trend è forte. - Se il +DMI (linea blu) è superiore al -DMI (linea verde): il prezzo è in rialzo e l'ADX misura la forza del trend rialzista. - Se il -DMI (linea verde) è superiore al +DMI (linea b
Технический индикатор Universal Oscillator является комбинацией торговых сигналов самых популярных и широко используемых осцилляторов. Индикатор представлен гистограммами, а также линиями fast и slow MA, что позволяет расширить список получаемых торговых рекомендаций и работать как по тренду, так и в боковом движении рынка. Таким образом, гистограммы позволяют определить момент пробоя ценовых значений и движение в новой фазе рынка, а линии указывают на зоны перекупленности и перепроданности.  Ос
SMC Order Blocks + FVG — Professional Smart Money Concept Indicator Unlock institutional trading insights with this professional-grade Smart Money Concept indicator. Automatically detect Order Blocks and Fair Value Gaps used by banks and hedge funds. KEY FEATURES: ORDER BLOCKS DETECTION • Automatic bullish and bearish Order Block identification • Based on price action and impulse strength analysis • Real-time mitigation tracking • Customizable imp
MACD Pro Master
Itumeleng Mohlouwa Kgotso Tladi
MACD Pro Master The MACD Pro Master is your ultimate trading companion, designed to revolutionize your financial journey and unlock the doors to wealth. Here's why it's the next best thing since sliced bread: Advantages Precision Trading : The MACD Pro Master leverages the powerful Moving Average Convergence Divergence (MACD) indicator to provide accurate buy and sell trades,  ensuring you capitalize on every market opportunity. Customizable Settings : Tailor the trading strategy to your unique
Schaff Trend Cycle STC
Mohammad Taher Halimi Tabrizi
The Schaff Trend Cycle indicator is the product of combining Slow Stochastics and the moving average convergence/divergence (MACD). The MACD has a reputation as a trend indicator, but it's also notorious for lagging due to its slow responsive signal line. The improved signal line gives the STC its relevance as an early warning sign to detect currency trends. this indicator is converted from Trading View code of STC Indicator - A Better MACD [SHK]
MACD Alerts
Matthew Palulis
MACD Crossover with Alerts, Colored Histogram, and Zero Line Arrows Overview The MACD Crossover Indicator is designed to help traders analyze trend direction and momentum shifts. This enhanced version of the classic MACD includes visual crossover markers, dynamic histogram coloring, and real-time alerts, offering a clear and structured approach to market analysis. Histogram color changes based on MACD position (above or below zero). Zero-line arrows for crossover points to highlight key trend
RBreaker
Zhong Long Wu
RBreaker Gold Indicators is a short-term intraday trading strategy for gold futures that combines trend following and intraday reversal approaches. It not only captures profits during trending markets but also enables timely profit-taking and counter-trend trading during market reversals. This strategy has been ranked among the top ten most profitable trading strategies by the American magazine   Futures Truth   for 15 consecutive years. It boasts a long lifecycle and remains widely used and st
Cvd Divergence
Thalles Nascimento De Carvalho
CVD Divergence – Analisi Professionale del Flusso Ordini e delle Divergenze CVD Divergence è un indicatore tecnico progettato per rilevare divergenze affidabili tra il prezzo e il Cumulative Delta Volume (CVD). Identifica con precisione i momenti in cui il flusso reale degli ordini non conferma il movimento del prezzo, rivelando possibili inversioni, esaurimento del momentum e manipolazioni istituzionali. L’indicatore combina la lettura del volume aggressivo con l’analisi strutturale del prezzo,
Indicatore Crypto_Forex "Istogramma di correzione della tendenza" per MT5. - Trend Correction Histogram può essere di 2 colori: rosso per trend ribassista e blu per trend rialzista. - 7 colonne istogramma consecutive dello stesso colore indicano l'inizio di un nuovo trend. - Indicatore Trend Correction Histogram progettato con lo scopo principale di minimizzare le perdite e massimizzare i profitti. - Ha un parametro "Periodo", responsabile della sensibilità dell'indicatore. - Avvisi integrati p
Stochastic R
Antony Augustine
Stochastic  Reversal  allows you to recognize reversals professionally. Stochastic Indicator: This technical indicator was developed by George Lane more than 50 years ago. The reason why this indicator survived for so many years is because it continues to show consistent signals even in these current times. The Stochastic indicator is a momentum indicator that shows you how strong or weak the current trend is. It helps you identify overbought and oversold market conditions within a trend.  Rules
MTF MA2 for MT5
Koji Kobayashi
3 (1)
MTF-MA2 for MT5 特徴: MTF Moving Averageを8本一気に表示してくれるインジケータになります。 8本も必要ない場合にももちろん非表示にできます。 パフォーマンスを考慮しているのでチャートが重くなるようなことは 無いはずになります。どの通貨でも使用可能になります。 それぞれのMTF Moving Averageの色や太さを変更できます。 各パラメータの説明: Method:MAの種類設定をします。 Applied price:MAで使用する価格を設定をします。 TimeFrame M5:使用するMAの時間足を設定します。 Period M5:使用するMAの期間を設定します。 ※ラベルに関係なく8本のMTF MAはどの時間足でも期間設定可能になります。 Limited bar?:表示に使用するバーを制限するかどうかを設定します。 ※ここをFalseにするとすべてのバーを読み込むことになるのでチャートが重く なるかもしれません。ご注意ください。 Max bars:使用するバーの本数を設定します。過去検証をする場合にはここの値を増やしてくだ
Buy CTS scalping indicator, provide buying and selling signals, automatic channeling and sending signals to mobile phones Using technical analysis and price action methods and modern methods, CTS indicator can draw price channels and recognize price trends with high accuracy and issue entry and exit signals according to them. Traders can easily fluctuate using this indicator in different time frames and in different markets. With the CTS indicator, you can signal in different ways. This indicato
Indicatore Crypto_Forex "HTF Moving Averages Cross" per MT5. - Migliora i tuoi metodi di trading con il potente indicatore HTF Moving Averages Cross per MT5. HTF significa "intervallo di tempo più lungo". - Questo indicatore è eccellente per i trader di tendenza con movimenti di prezzo. - Permette di collegare medie mobili veloci e lente da intervalli di tempo più lunghi al grafico corrente --> questo è un metodo professionale. - HTF Moving Averages Cross ha avvisi integrati per dispositivi mo
==================================================================== SMT DIVERGENCE - GOLD vs SILVER (XAUUSD / XAGUSD) All Timeframe MQL5 Market Product Description ==================================================================== PRODUCT NAME: SMT Divergence Gold vs Silver | Smart Money Scalping Tool SHORT DESCRIPTION (max 63 chars): Catch Gold reversals before they happen using SMT Divergence ---------------------------------------------------------------------- FULL DESCRIPTION ----
FREE
MACDivergence MTF MT5
Pavel Zamoshnikov
4 (5)
Advanced ideas of the popular MACD indicator: It detects and displays classic and reverse divergences (two methods of detecting divergences). It uses different color to highlight an uptrend and a downtrend. Two methods of determining a trend: а) MACD crosses the 0 level (classic signal); б) MACD crosses its own average (early signal). This is a multi-timeframe indicator: it can display MACD data from other timeframes. Two methods of drawing: classic histogram and line. It generates sound and vis
Tendencia Crash300
Ignacio Agustin Mene Franco
Professional Pack Crash 300 Indicators, On this occasion I present the trend indicator that is for the crash index 300 (Deriv Broker) The indicator consists of a strategy where trends are caught in periods of 15 minutes, very clearly the indicator shows the purchase marking the tip of red until the trend develops, and then mark the green point of purchase, it is very simple to use, It is recommended to use in that temporality since it serves to catch longer trends and increase profit, the indica
Noize Absorption Index - is the manual trading system that measures the difference of pressure between bears forces and bulls forces. Green line - is a noize free index that showing curent situation. Zero value of index shows totally choppy/flat market.Values above zero level shows how powerfull bullish wave is and values below zero measures bearish forces.Up arrow appears on bearish market when it's ready to reverse, dn arrow appears on weak bullish market, as a result of reverse expectation.
MACD Color Histogram
German David Nino Cifuentes
5 (1)
Para MT4 L'Indicatore MACD Histogram è una versione migliorata dell'indicatore MACD tradizionale, offrendo una visione superiore delle tendenze del mercato e dei cambiamenti di momentum. A differenza del MACD predefinito in MT5, questa versione include un istogramma , rendendo più facile visualizzare e interpretare le condizioni del mercato. Vantaggi rispetto all'indicatore MACD predefinito: Visuali Migliorati: L'istogramma fornisce una rappresentazione a barre della differenza tra la linea MAC
CosmiCLab SMC FIBO CosmiCLab SMC FIBO is a professional trading indicator designed for traders who use Smart Money Concepts (SMC), market structure analysis and Fibonacci retracement levels. The indicator automatically detects market swings and builds Fibonacci levels based on the latest impulse movement. It also identifies market structure changes such as BOS (Break of Structure) and CHOCH (Change of Character), helping traders understand the current market direction. CosmiCLab SMC FIBO also pr
Colored MACD Indicator
Claudio Jean-claude Spillmann
A beutiful, multi colored MACD indicator. It offers the possibility to change the colors of the "main line" and the "signal line" and uses four different colors for the "histogram" It also returns the buffer-values from the "main line", "signal line", "histogram" and "color" to acess it from an EA If you need some changes, or additional buffers -> send me a message
RSI Double Cross Robot is a fully automated expert advisor based on a classic yet powerful momentum concept — the crossover of two RSI indicators with different periods. The robot identifies trend changes and market momentum shifts by tracking the interaction between fast and slow RSI values. Trades are opened only when clear directional signals appear, while a built-in volatility filter helps avoid flat and low-activity market conditions. RSI Double Cross Robot applies strict risk management, s
"Impulses and Corrections 5" is created to help traders navigate the market situation. The indicator shows multi-time frame upward and downward "Impulses" of price movements. These impulses are the basis for determining the "Base" , which is composed of zones of corrections of price movements, as well as "Potential" zones for possible scenarios of price movement. Up and down impulses are determined based on a modified formula of Bill Williams' "Fractals" indicator. The last impulse is always "U
Universal Soul Reaper
Pieter Gerhardus Van Zyl
Universal Soul Reaper is an atmospheric market-flow oscillator designed to interpret price behavior as a cycle of spiritual energy. Instead of reacting to raw price alone, it visualizes the state of the market’s soul —revealing when momentum is awakening, stabilizing, or fading. The indicator operates in a separate window and presents three interwoven entities: the Ectoplasmic Veil , the Spirit Boundary , and the Soul Core . Together, they form a living framework that helps traders sense pressu
Syntetic Mean Reversion
Danny Giovanni Romero Lozano
Synthetic Mean Reversion The Synthetic Mean Reversion is a technical indicator designed to analyze price momentum and its distance from dynamic equilibrium. It operates in a separate sub-window, offering a normalized view of market extensions and potential exhaustion zones based on price volatility. The indicator measures the difference between the current price and its mean, transforming market data into a visual scale of 0 to 100. This calculation helps identify periods when the price has de
Strumento Avanzato di Analisi del Profilo dei Volumi per MetaTrader 5 Il Kecia Volume Profile Order Finder offre ai trader funzionalità di analisi del profilo dei volumi. Questo indicatore per MT5 combina la visualizzazione del profilo dei volumi con calcoli statistici per aiutare a identificare potenziali opportunità di trading e suggerisce livelli di entrata, stop loss e take profit basati sulla struttura del mercato. Visualizzazione del Profilo di Mercato Trasforma il tuo grafico con visualiz
Prop firm king
Ricky Zoltan Beznec
This Expert Advisor is a fully automated trading system designed exclusively for the   USD/CHF   currency pair on the  6 -hour (H6) chart . It identifies high-probability reversal opportunities by detecting when price reaches statistically extreme overbought or oversold conditions. When a qualifying signal is confirmed, the EA automatically enters a trade, manages position size relative to available margin, and applies a dynamic trailing stop to protect profits as the trade moves in favour. The
"GoldenSwing" is a comprehensive MetaTrader 5 indicator meticulously crafted by Southern Star Trading, designed to enhance your trading strategies with precision swing high and swing low identification. Harnessing the power of swing analysis, this indicator provides traders with invaluable insights into market reversals and trend continuations, enabling them to make informed trading decisions. With its advanced algorithm, GoldenSwing detects significant swing highs and swing lows in real-time,
RM Divergence Pro
Mohammadreza Mahdi Mavaddat
RM Divergence Pro - Advanced RSI Divergence and Inability Indicator, It is a professional, non-repainting RSI divergence indicator based on real market structure. It detects Regular Divergence, Hidden Divergence, Inability, and Potential Divergence using confirmed RSI swings, price behavior, and advanced filters for clean and reliable analysis. ================================================== OVERVIEW ================================================== RM Divergence Pro is an advanced RSI-base
This advanced MACD indicator retains the basic functions of the standard MACD while offering several additional features: Histogram Coloring: The histogram uses four different colors to clearly show increases and decreases. Light green for increasing positive values, gray for decreasing positive values, red for decreasing negative values, and orange for increasing negative values. Signal Line Crossover Arrows: Displays arrows for buy-sell signals at points where the MACD line crosses the signal
Gli utenti di questo prodotto hanno anche acquistato
Divergence Bomber
Ihor Otkydach
4.9 (86)
Ogni acquirente dell’indicatore riceverà inoltre gratuitamente: L’utilità esclusiva “Bomber Utility”, che gestisce automaticamente ogni operazione, imposta i livelli di Stop Loss e Take Profit e chiude le posizioni secondo le regole della strategia I file di configurazione (set file) per adattare l’indicatore a diversi asset I set file per configurare il Bomber Utility in tre modalità: “Rischio Minimo”, “Rischio Bilanciato” e “Strategia di Attesa” Una guida video passo-passo per installare, conf
Azimuth Pro
Ottaviano De Cicco
5 (6)
Azimuth Pro V2: Synthetic Fractal Structure and Confirmed Entries for MT5 Overview Azimuth Pro is a multi-level swing structure indicator by Merkava Labs . Four nested swing layers, swing-anchored VWAP, ABC pattern detection, three-timeframe structural filtering, and closed-bar confirmed entries — one chart, one workflow from micro-swings to macro-cycles. This is not a blind signal product. It is a structure-first workflow for traders who care about location, context, and timing. V2 Launch Offe
Quantum TrendPulse
Bogdan Ion Puscasu
5 (23)
Ecco   Quantum TrendPulse   , lo strumento di trading definitivo che combina la potenza di   SuperTrend   ,   RSI   e   Stocastico   in un unico indicatore completo per massimizzare il tuo potenziale di trading. Progettato per i trader che cercano precisione ed efficienza, questo indicatore ti aiuta a identificare con sicurezza le tendenze di mercato, i cambiamenti di momentum e i punti di entrata e uscita ottimali. Caratteristiche principali: Integrazione SuperTrend:   segui facilmente l'andame
OmniSync Projection
Antonio-alin Teculescu
5 (1)
Chronos Fractal Engine is an innovative price projection indicator for MetaTrader 5, designed to transform your technical analysis by intelligently identifying and projecting historical price patterns. Built upon an advanced correlation algorithm and the fractal principles of the market, this powerful tool visualizes potential future price movements, giving you a unique edge in your trading decisions. What is Chronos Fractal Engine? At its core, the Chronos Fractal Engine employs a sophisticat
Presentazione       Quantum Breakout PRO   , l'innovativo indicatore MQL5 che sta trasformando il modo in cui scambi le zone di breakout! Sviluppato da un team di trader esperti con un'esperienza di trading di oltre 13 anni,       Quantum Breakout PRO       è progettato per spingere il tuo viaggio di trading a nuovi livelli con la sua strategia innovativa e dinamica della zona di breakout. Quantum Breakout Indicator ti fornirà frecce di segnalazione sulle zone di breakout con 5 zone target di
Grabber System MT5
Ihor Otkydach
4.83 (23)
Ti presento un eccellente indicatore tecnico: Grabber, che funziona come una strategia di trading "tutto incluso", pronta all’uso. In un solo codice sono integrati strumenti potenti per l’analisi tecnica del mercato, segnali di trading (frecce), funzioni di allerta e notifiche push. Ogni acquirente di questo indicatore riceve anche gratuitamente: L’utility Grabber: per la gestione automatica degli ordini aperti Video tutorial passo dopo passo: per imparare a installare, configurare e utilizzare
CGE Trading Suite
Carl Gustav Johan Ekstrom
5 (2)
Institutional-Grade Analytics for MT5 C GE Trading Suite delivers the analytical edge typically reserved for professional trading desks. The platform integrates a full suite of analytical tools into one seamless workflow: dynamic grid mapping, liquidity behavior analysis, ECM, trend lines, MIDAS, trade cycles, and directional channel projections. Together, these provide a unified view of market structure and momentum. Directional clarity is further enhanced by the capital flow index, which meas
Btmm state engine pro
Garry James Goodchild
5 (4)
BTMM State Engine Pro is a MetaTrader 5 indicator for traders who use the Beat The Market Maker approach: Asian session context, kill zone timing, level progression, peak formation detection, and a multi-pair scanner from a single chart. It combines cycle state logic with a built-in scanner dashboard so you do not need the same tool on many charts at once. What it does Draws the Asian session range; session times can follow broker server offset or be set in inputs. Tracks level progression (L
Berma Bands
Muhammad Elbermawi
5 (8)
L'indicatore Berma Bands (BBs) è uno strumento prezioso per i trader che cercano di identificare e capitalizzare i trend di mercato. Analizzando la relazione tra il prezzo e le BBs, i trader possono discernere se un mercato è in una fase di trend o di range. Visita il [ Berma Home Blog ] per saperne di più. Le Berma Bands sono composte da tre linee distinte: la Upper Berma Band, la Middle Berma Band e la Lower Berma Band. Queste linee sono tracciate attorno al prezzo, creando una rappresentazion
Bill Williams Advanced
Siarhei Vashchylka
5 (11)
Bill Williams Advanced is designed for automatic chart analysis using Bill Williams' "Profitunity" system. The indicator analyzes four timeframes at once. Manual (Be sure to read before purchasing) Advantages 1. Analyzes the chart using Bill Williams' "Profitunity" system. Signals are displayed in a table in the corner of the screen and on the price chart. 2. Finds all known AO and AC signals, as well as zone signals. Equipped with a trend filter based on the Alligator. 3. Finds "Divergence Bar
ARICoins
Temirlan Kdyrkhan
ARICoin is a powerful trading companion designed to generate high-probability entry signals with dynamic TP/SL/DP levels based on volatility. Built-in performance tracking shows win/loss stats, PP1/PP2 hits, and success rates all updated live. Key Features: Buy/Sell signals with adaptive volatility bands Real-time TP/SL/DP levels based on ATR Built-in MA Filter with optional ATR/StdDev volatility Performance stats panel (Success, Profit/Loss, PP1/PP2) Alerts via popup, sound, push, or email Cust
ARIPoint
Temirlan Kdyrkhan
ARIPoint is a powerful trading companion designed to generate high-probability entry signals with dynamic TP/SL/DP levels based on volatility. Built-in performance tracking shows win/loss stats, PP1/PP2 hits, and success rates all updated live. Key Features: Buy/Sell signals with adaptive volatility bands Real-time TP/SL/DP levels based on ATR Built-in MA Filter with optional ATR/StdDev volatility Performance stats panel (Success, Profit/Loss, PP1/PP2) Alerts via popup, sound, push, or email Cu
SignalTech MT5 is a trading system for EURUSD, USDCHF, USDJPY, AUDUSD, NZDUSD, EURJPY, AUDJPY, NZDJPY, CADJPY H2 and H3 Timeframe.  It can generate signals with Buy/Sell Arrows and Pop-Up/Sound Alerts. Each signal has clear Entry and Stop Loss levels, which should be automatically flagged on the chart, as well as potential Targets 1, 2, and 3. The Entry and TP levels are fixed after the trade is taken. The exit level is dynamic. If there are signs of a potential short-term trend reversal, the
La Master Edition è uno strumento analitico di livello professionale progettato per visualizzare la struttura del mercato attraverso l'obiettivo del volume e del flusso di denaro. A differenza degli indicatori di volume standard, questo strumento visualizza un Profilo di Volume Giornaliero direttamente sul tuo grafico, permettendoti di vedere esattamente dove si è verificata la scoperta dei prezzi e dove è posizionato il "denaro intelligente". Questa Master Edition è progettata per chiarezza e v
RelicusRoad Pro: Sistema Operativo Quantitativo di Mercato 70% DI SCONTO ACCESSO A VITA (TEMPO LIMITATO) - UNISCITI A 2.000+ TRADER Perché la maggior parte dei trader fallisce anche con indicatori "perfetti"? Perché operano su Singoli Concetti isolati. Un segnale senza contesto è una scommessa. Per vincere serve CONFLUENZA . RelicusRoad Pro non è un semplice indicatore. È un Ecosistema Quantitativo completo . Mappa la "Fair Value Road", distinguendo tra rumore e rotture strutturali. Smetti di in
Innanzitutto, vale la pena sottolineare che questo Strumento di Trading è un Indicatore Non-Ridipingente, Non-Ridisegnante e Non-Laggante, il che lo rende ideale per il trading professionale. Corso online, manuale utente e demo. L'Indicatore Smart Price Action Concepts è uno strumento molto potente sia per i nuovi che per i trader esperti. Racchiude più di 20 utili indicatori in uno solo, combinando idee di trading avanzate come l'Analisi del Trader del Circolo Interno e le Strategie di Tradin
Gartley Hunter Multi
Siarhei Vashchylka
5 (11)
Gartley Hunter Multi - An indicator for searching for harmonic patterns simultaneously on dozens of trading instruments and on all possible timeframes. Manual (Be sure to read before purchasing) | Version for MT4 Advantages 1. Patterns: Gartley, Butterfly, Shark, Crab. Bat, Alternate Bat, Deep Crab, Cypher 2. Simultaneous search for patterns on dozens of trading instruments and on all possible timeframes 3. Search for patterns of all possible sizes. From the smallest to the largest 4. All fou
L'indicatore " Dynamic Scalper System MT5 " è progettato per il metodo di scalping, ovvero per il trading all'interno di onde di trend. Testato sulle principali coppie di valute e sull'oro, è compatibile con altri strumenti di trading. Fornisce segnali per l'apertura di posizioni a breve termine lungo il trend, con ulteriore supporto al movimento dei prezzi. Il principio dell'indicatore. Le frecce grandi determinano la direzione del trend. Un algoritmo per generare segnali per lo scalping sott
RFI levels PRO MT5
Roman Podpora
3.67 (3)
L'indicatore mostra accuratamente i punti di inversione e le zone di ritorno dei prezzi in cui il       Principali attori   . Vedi dove si formano le nuove tendenze e prendi decisioni con la massima precisione, mantenendo il controllo su ogni operazione. VERSION MT4     -    Rivela il suo massimo potenziale se combinato con l'indicatore   TREND LINES PRO Cosa mostra l'indicatore: Strutture di inversione e livelli di inversione con attivazione all'inizio di un nuovo trend. Visualizzazione dei li
AriX
Temirlan Kdyrkhan
1 (4)
AriX Indicator for MT5 A powerful trend-following and signal-evaluation tool AriX is a custom MT5 indicator that combines Moving Averages and ATR-based risk/reward logic to generate clear buy/sell signals. It visualizes dynamic SL/TP levels, evaluates past trade outcomes, and displays win/loss statistics in a clean on-chart panel. Key features include: Buy/Sell signals based on MA crossovers ATR-based SL/TP1/TP2/TP3 levels with visual lines and labels Signal outcome tracking with real-time stat
Smart Structure Concepts MT5
Cristhian Alexander Gaibor Cuasquer
Smart Structure Concepts MT5 è il toolkit SMC istituzionale più completo per MetaTrader 5 — con tooltip educativi in 4 lingue e avvisi push in tempo reale nel momento in cui il prezzo entra in una zona. La maggior parte degli indicatori SMC disegna scatole e ti lascia indovinare. Questo spiega ogni segnale direttamente sul grafico. Passa il cursore su qualsiasi BOS, CHoCH, Order Block, FVG o livello di liquidità e vedi cosa significa e cosa fare dopo — in inglese, spagnolo, portoghese o france
Meravith MT5
Ivan Stefanov
5 (1)
Strumento per market maker. Meravith: Analizzerà tutti i timeframe e mostrerà il trend attualmente in corso. Evidenzierà le zone di liquidità (equilibrio dei volumi) dove i volumi rialzisti e ribassisti sono uguali. Mostrerà tutti i livelli di liquidità dei diversi timeframe direttamente sul grafico. Genererà e presenterà un’analisi di mercato testuale a scopo di riferimento. Calcolerà obiettivi, livelli di supporto e punti di stop-loss in base al trend attuale. Calcolerà il rapporto rischio/ren
Ziva LSE System
Hassan Abdullah Hassan Al Balushi
ZIVA LSE System A Professional Liquidity & Structure Execution Framework Executive Overview ZIVA LSE System is a professionally engineered analytical framework designed to interpret market behavior through structural logic and liquidity dynamics. It is not positioned as a conventional indicator. Rather, it functions as a structured execution environment that organizes price action into a clear, disciplined decision-making model. The system is built to deliver consistency, clarity, and controlle
Omniview ICT Dashboard
Kayode Michael Oyetunde
Domina il Flusso Istituzionale. Domina il Mercato. Trovare un setup "A+" richiede tre cose: Bias, Liquidità e Displacement (Spostamento). La maggior parte dei trader incontra difficoltà perché si perde nel rumore dei timeframe inferiori o rimane intrappolata in falsi movimenti. L'OmniView ICT Dashboard è la tua lente istituzionale. Scansiona l'intera "Osservazione del Mercato" (Market Watch) per evidenziare dove si sta verificando una significativa attività di mercato, così puoi smettere di dare
ZIVA Signal Intelligence
Hassan Abdullah Hassan Al Balushi
ZIVA Signal Intelligence An Adaptive, Modular Market Intelligence System ZIVA Signal Intelligence is not positioned as a conventional trading indicator. It is a fully integrated, proprietary market intelligence system engineered to deliver structured, high-precision interpretation of price behavior within a controlled analytical environment. Developed through an independent architectural approach, ZIVA does not rely on, derive from, or replicate existing indicators. It represents a standalone
PZ Swing Trading MT5
PZ TRADING SLU
5 (5)
Protect against whipsaws: revolutionize your swing trading approach Swing Trading is the first indicator designed to detect swings in the direction of the trend and possible reversal swings. It uses the baseline swing trading approach, widely described in trading literature. The indicator studies several price and time vectors to track the aggregate trend direction and detects situations in which the market is oversold or overbought and ready to correct. [ Installation Guide | Update Guide | Tro
Advanced Supply Demand MT5
Bernhard Schweigert
4.53 (15)
La migliore soluzione per qualsiasi principiante o trader esperto! Questo indicatore è uno strumento di trading unico, di alta qualità e conveniente perché abbiamo incorporato una serie di funzionalità proprietarie e una nuova formula. Con questo aggiornamento, sarai in grado di mostrare fusi orari doppi. Non solo potrai mostrare una TF più alta, ma anche entrambe, la TF del grafico, PIÙ la TF più alta: SHOWING NESTED ZONES. Tutti i trader di domanda di offerta lo adoreranno. :) Informazioni imp
Il livello Premium è un indicatore unico con una precisione superiore all'80% delle previsioni corrette! Questo indicatore è stato testato dai migliori Specialisti di Trading per più di due mesi! L'indicatore dell'autore che non troverai da nessun'altra parte! Dagli screenshot puoi vedere di persona la precisione di questo strumento! 1 è ottimo per il trading di opzioni binarie con un tempo di scadenza di 1 candela. 2 funziona su tutte le coppie di valute, azioni, materie prime, criptovalu
Volatility Trend System - è un sistema di trading che fornisce segnali per le entrate. Il sistema di volatilità fornisce segnali lineari e puntuali nella direzione del trend, nonché segnali per uscirne, senza ridisegnare o ritardi. L'indicatore di tendenza monitora la direzione del trend a medio termine, mostra la direzione e il suo cambiamento. L'indicatore del segnale si basa sui cambiamenti della volatilità e mostra gli ingressi nel mercato. L'indicatore è dotato di diversi tipi di avvisi. P
Trend Lines PRO MT5
Roman Podpora
5 (1)
LINEE DI TENDENZA PRO  Aiuta a capire dove il mercato sta realmente cambiando direzione. L'indicatore mostra reali inversioni di tendenza e punti in cui i principali operatori rientrano. Vedi   Linee BOS   Cambiamenti di tendenza e livelli chiave su timeframe più ampi, senza impostazioni complesse o rumore inutile. I segnali non vengono ridisegnati e rimangono sul grafico dopo la chiusura della barra. VERSIONE MT4   -   Svela il suo massimo potenziale se abbinato all'indicatore   RFI LEVELS PRO
Altri dall’autore
US Market Data Feed Pro
Marcelo Alejandro Borasi
US Market Data Feed Pro — MQL5 Market Description ============================================= US Market Data Feed Pro is a real-time financial data utility for MetaTrader 5. It automatically collects US economic calendar events, MAG7 earnings dates, Treasury yields, VIX, NYSE holidays, and Quad Witching dates from multiple sources  and saves everything into simple text files that any Expert Advisor can read. It does NOT trade. It feeds data to your trading systems.
Filtro:
Nessuna recensione
Rispondi alla recensione