SynaptixQuant Commodities Dominance Grid
- Indicatori
- Devie Arevalo Montemayor
- Versione: 1.1
- Aggiornato: 26 dicembre 2025
- Attivazioni: 8
SynaptixQuant Commodities Dominance Grid
A Professional Trade Intelligence Dashboard for Commodity Traders
OVERVIEW
The SynaptixQuant Commodities Dominance Grid is a high-performance trade intelligence dashboard built for serious commodity traders using MetaTrader 5. Designed as the perfect companion to the SynaptixQuant Commodities Dominance indicator, this advanced panel centralizes trade signals, risk metrics, and market structure insights into a single, highly visual interface.
Whether operating linked with Commodities Dominance or running independently, the Dominance Grid adapts seamlessly to your trading workflow — delivering clarity, structure, and efficiency.
DUAL OPERATING MODES
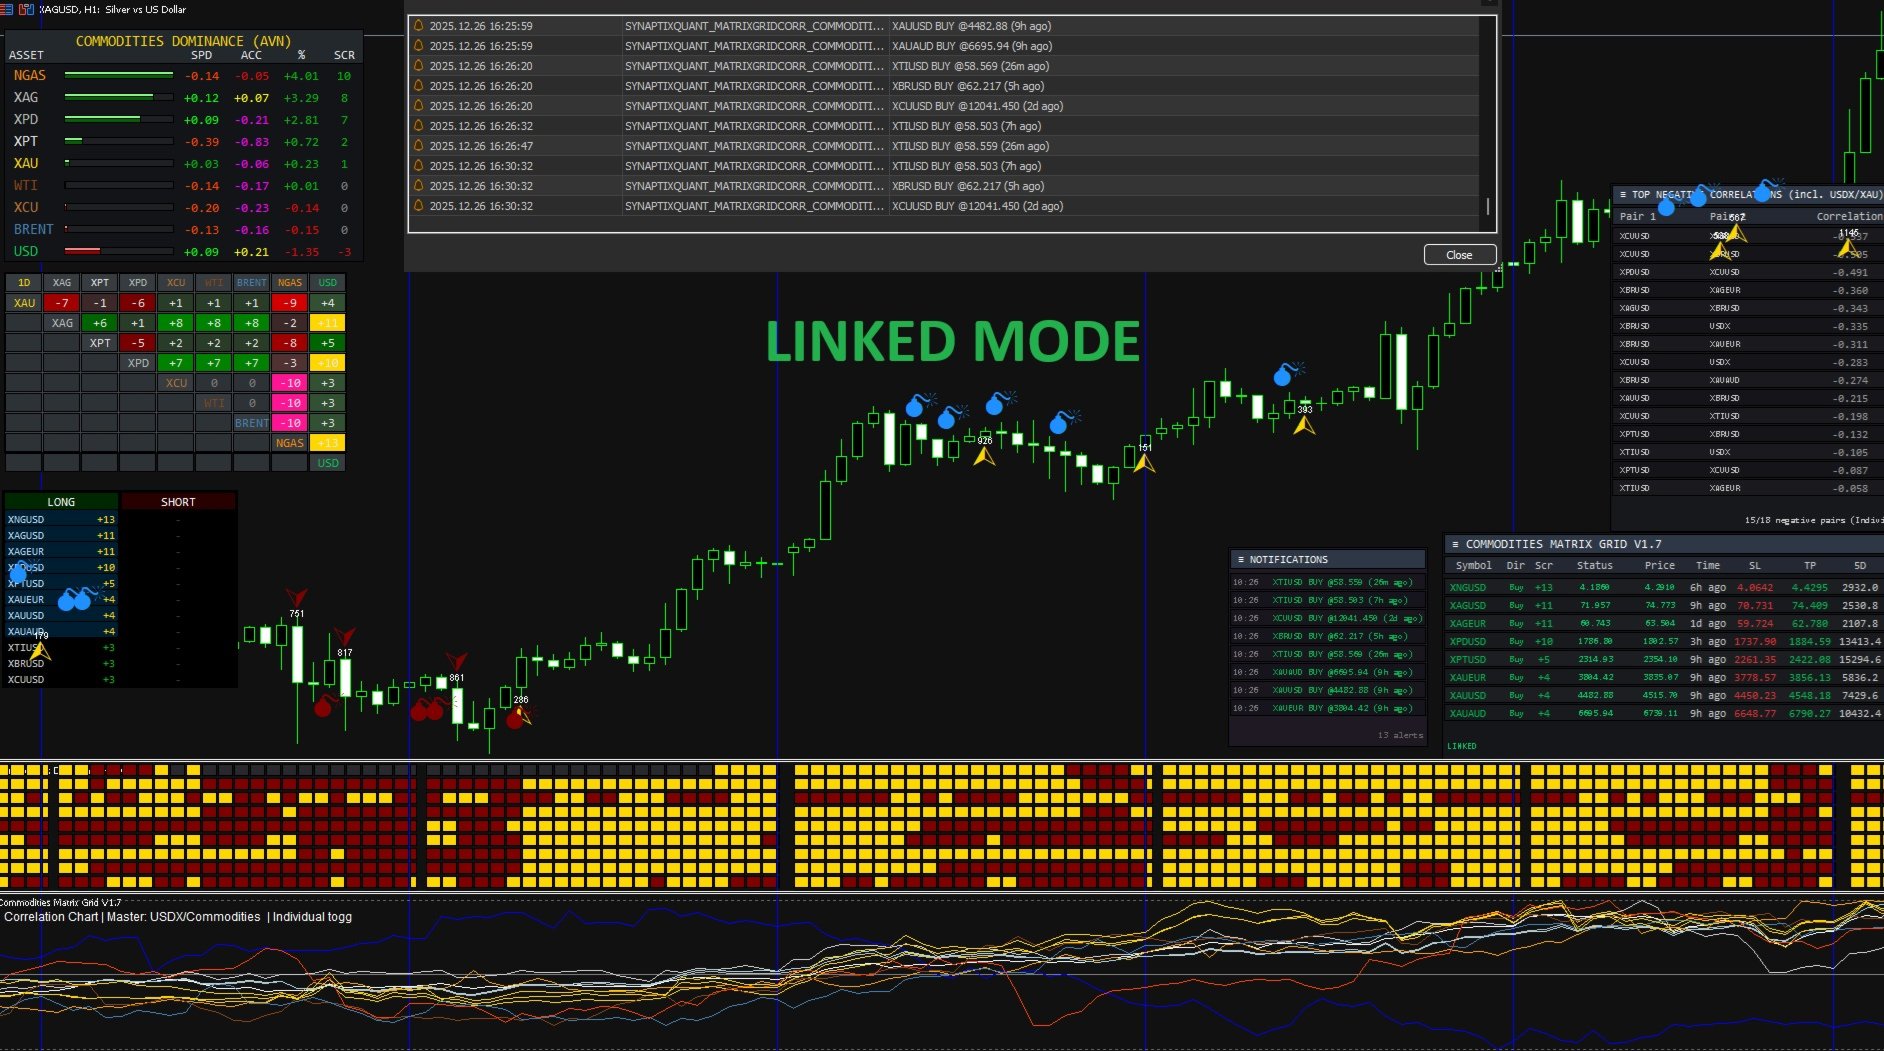
LINKED MODE
Maximum performance when paired with the Commodities Dominance indicator.
When the Commodities Dominance indicator is detected on the chart, the Dominance Grid automatically synchronizes to provide:
-
Entry signal recognition from Commodities Dominance
-
Price-based stop-loss and take-profit calculations
-
Signal timestamp tracking
-
Cluster alignment and confirmation
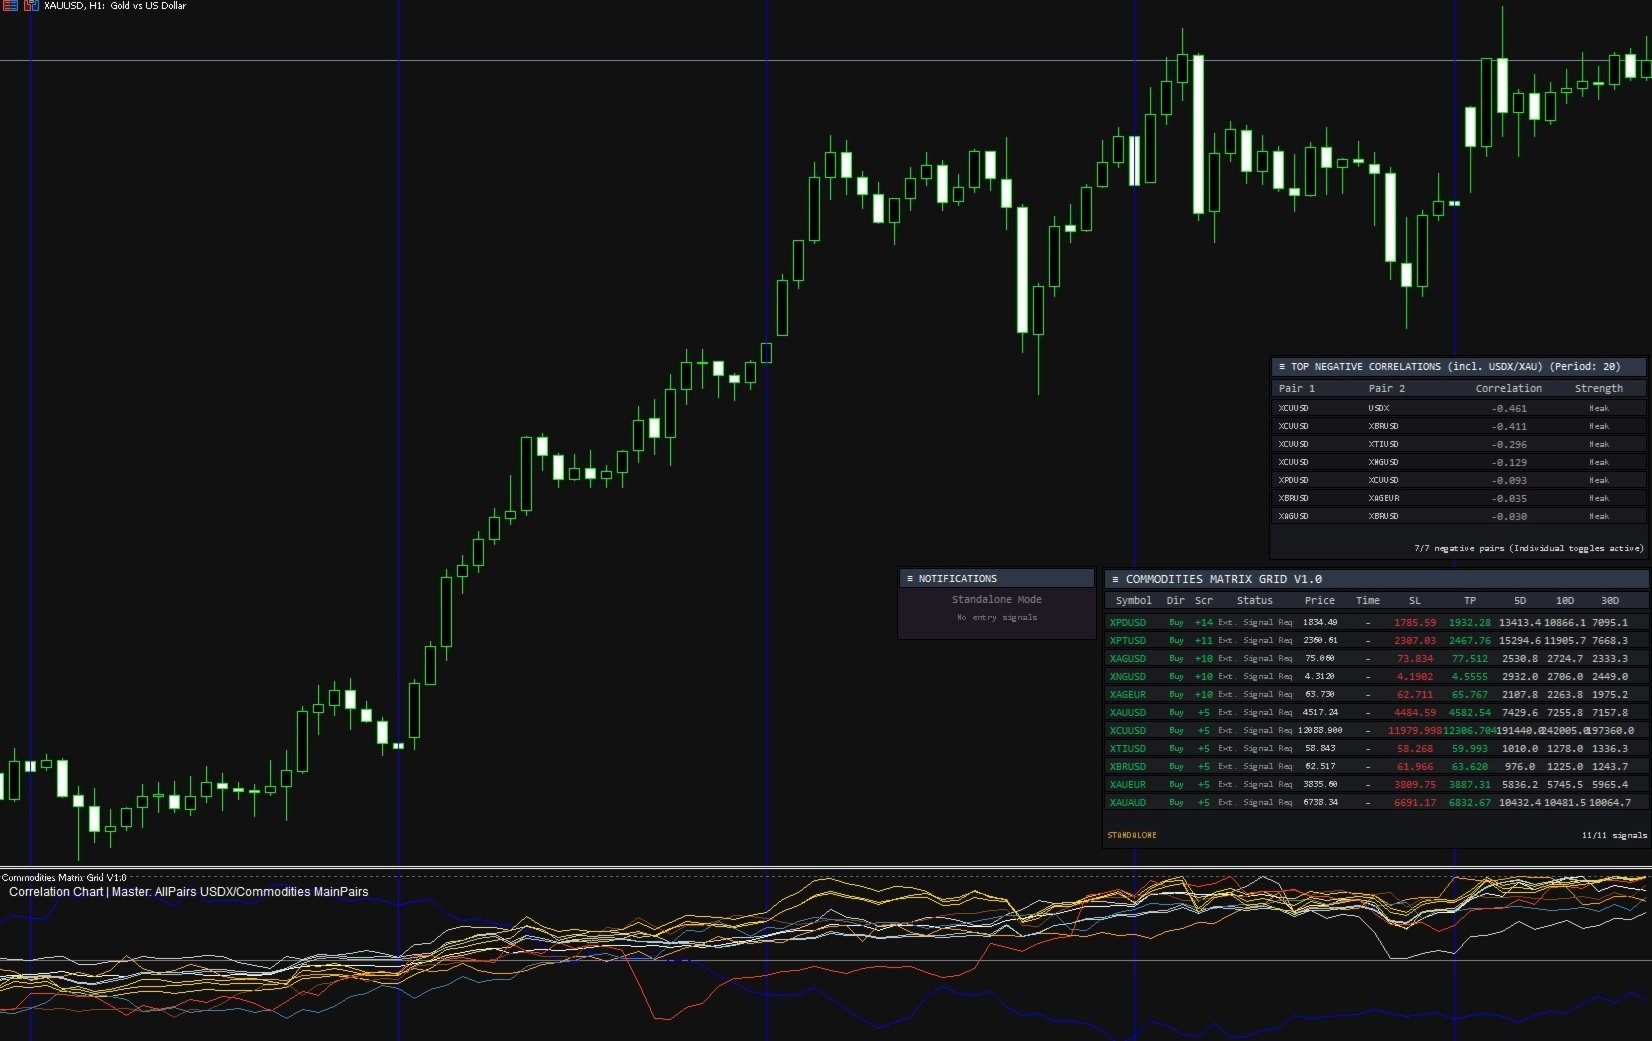
STANDALONE MODE
Full functionality without dependencies.
When used independently, the Dominance Grid includes:
-
Internal multi-symbol signal detection
-
Built-in technical structure for entry identification
-
Full ADR, correlation, and volatility calculations
-
Complete dashboard functionality
The system automatically detects which mode to operate in. No configuration required.
SUPPORTED INSTRUMENTS
Primary Commodities (vs USD)
| Precious Metals | Energy | Industrial |
|---|---|---|
| Gold (XAUUSD) | WTI Crude (WTIUSD) | Copper (XCUUSD) |
| Silver (XAGUSD) | Brent Crude (XBRUSD) | |
| Platinum (XPTUSD) | Natural Gas (XNGUSD) | |
| Palladium (XPDUSD) |
Extended Currency Variants
-
XAUEUR, XAGEUR
-
XAUAUD, XAGAUD
CORE FEATURES
Signal Intelligence Grid
A centralized control panel providing instant situational awareness:
| Column | Description |
|---|---|
| Symbol | Tradeable instrument with instant chart switching |
| Direction | BUY or SELL signal direction |
| Score | Relative strength differential driving the signal |
| Status | Entry level or distance-to-entry |
| Price | Live market price |
| Time | Signal age (for example, 45m ago, 1d ago) |
| SL | Automatically calculated stop-loss |
| TP | Automatically calculated take-profit |
| SD | Standard deviation–based risk metric |
ADR Intelligence (Average Daily Range)
Understand price potential before entering a trade:
-
ADR(5 / 10 / 20) calculations
-
Point-based precision for commodity pricing
-
Real-time context versus historical averages
Correlation Intelligence Panel
Designed to highlight inter-market relationships:
-
Identifies strongest negative correlations
-
Displays correlation strength values
-
Supports hedging and diversification strategies
-
Adjustable lookback period (default: 20 bars)
Live Correlation Chart
A dynamic visual comparison of market behavior:
-
Multi-instrument normalized price plotting
-
USDX overlay for macro context
-
Individual symbol toggles
-
Automatic scaling for clarity
Notifications and Event Log
Track signal activity with clarity:
-
Time-stamped signal alerts
-
Entry price logging
-
Directional confirmation
-
Scrollable signal history
Interactive Controls
-
Click any symbol to instantly load its chart
-
Draggable interface panels
-
Resizable layout components
-
Toggle individual modules on or off
FEATURE COMPARISON
| Feature | Standalone | Linked |
|---|---|---|
| Currency Strength Analysis | Yes | Yes |
| Multi-Asset Monitoring | Yes | Yes |
| ADR Calculations | Yes | Yes |
| Correlation Tools | Yes | Yes |
| Alerts and Logging | Yes | Yes |
| Entry Signal Detection | Yes | Yes |
| Price-Based SL/TP | No | Yes |
| Signal Timing | No | Yes |
| Cluster Alignment | No | Yes |
WHY TRADERS USE IT
Trade Discovery
-
Identify high-probability setups quickly
-
Rank opportunities based on strength
-
Reduce analysis time
Risk Management
-
Pre-calculated stop-loss and take-profit levels
-
ADR awareness prevents unrealistic expectations
-
Correlation visibility reduces portfolio risk
Efficiency
-
One dashboard replaces multiple charts
-
Fast symbol switching
-
Live updates without clutter
Flexibility
-
Works independently or alongside the Commodities Dominance indicator
-
Compatible with all broker symbol formats
-
Fully customizable layout
CUSTOMIZATION OPTIONS
Panel Controls
-
Adjustable position and size
-
Font and layout scaling
-
Module visibility controls
Signal Filters
-
Minimum strength threshold
-
Maximum number of visible instruments
-
Historical signal depth
Correlation Settings
-
Adjustable calculation periods
-
Positive or negative correlation focus
-
Optional USDX inclusion
Visual Styling
-
Color customization
-
Panel backgrounds and borders
-
Per-instrument chart colors
TECHNICAL SPECIFICATIONS
| Specification | Details |
|---|---|
| Platform | MetaTrader 5 |
| Indicator Type | Separate window panel |
| Operating Modes | Linked and Standalone |
| Instruments Supported | 8 core + 4 variants + USDX |
| Update Frequency | Real-time (optimized) |
| Performance Impact | Low CPU usage |
| Alerts | Visual and audio |
IDEAL FOR
-
Commodity-focused traders
-
Multi-asset traders
-
Risk-conscious traders
-
Correlation-based strategies
-
Traders seeking structured decision-making
SEAMLESS INTEGRATION
The SynaptixQuant Commodities Dominance Grid integrates directly with the SynaptixQuant Commodities Dominance indicator.
When both are active:
-
Automatic detection occurs
-
Signal data is synchronized
-
Advanced metrics become available
-
No configuration is required