Pair Trading Qant Maney
- librerie
- Versione: 1.811
- Aggiornato: 23 novembre 2025
- Attivazioni: 5

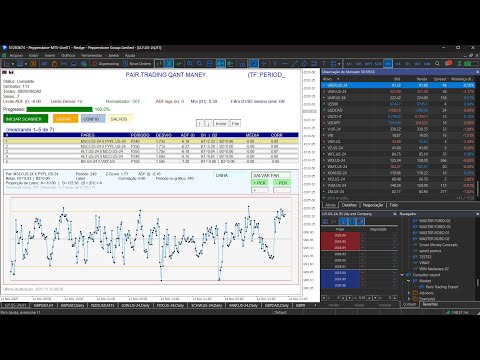
Attach the indicator to the chart, adjust inputs (periods, Z-score limit, ADF, normalizer usage, etc.).
Click on “START SCANNER”: it performs all tests and populates the table with the pairs that gave a signal.
Click on a line in the table:
The indicator shows the pair details (Z-Score, ADF, betas, correlation, average, lot ratio).
It draws the residual chart (candle or line mode) with average and 2σ and 3σ bands, allowing you to adjust the period and window shift.
It calculates an A/B lot ratio (with a vol-neutral option, adjusting for asset deviations).
Typical operational rules (suggested by the indicator):
When the Z-Score is high positive (above the limit): the pair is “stretched”; the idea is to sell the expensive asset and buy the cheap one, in the proportion indicated in the panel.
When the Z-score is very negative: the pair is "cheap"; you reverse the positions (buy the one below the average and sell the one above).
You can save the selected pair in the SAVED panel to create a watchlist of recurring opportunities.What it does:
Scans a fixed list of assets (24-hour US stock pairs from the Pepperstone brokerage) on the chosen timeframe.
For each pair and for various periods (Period1…Period100 ABOVE) it:
Calculates a regression model between the two assets (and, if desired, using the US500 index as a normalizer).
Generates the residual (spread) of this relationship, its mean, standard deviation, correlation, and betas (B1 and B2).
Applies an ADF test to the residual (cointegration/stationarity).
Calculates the Z-score of the current residual (how many standard deviations it is away from the mean).
Only pairs that meet the filters are included in the table.