Volume Bubbles MT5

Benefits and Usage of the Volume Bubble Tool

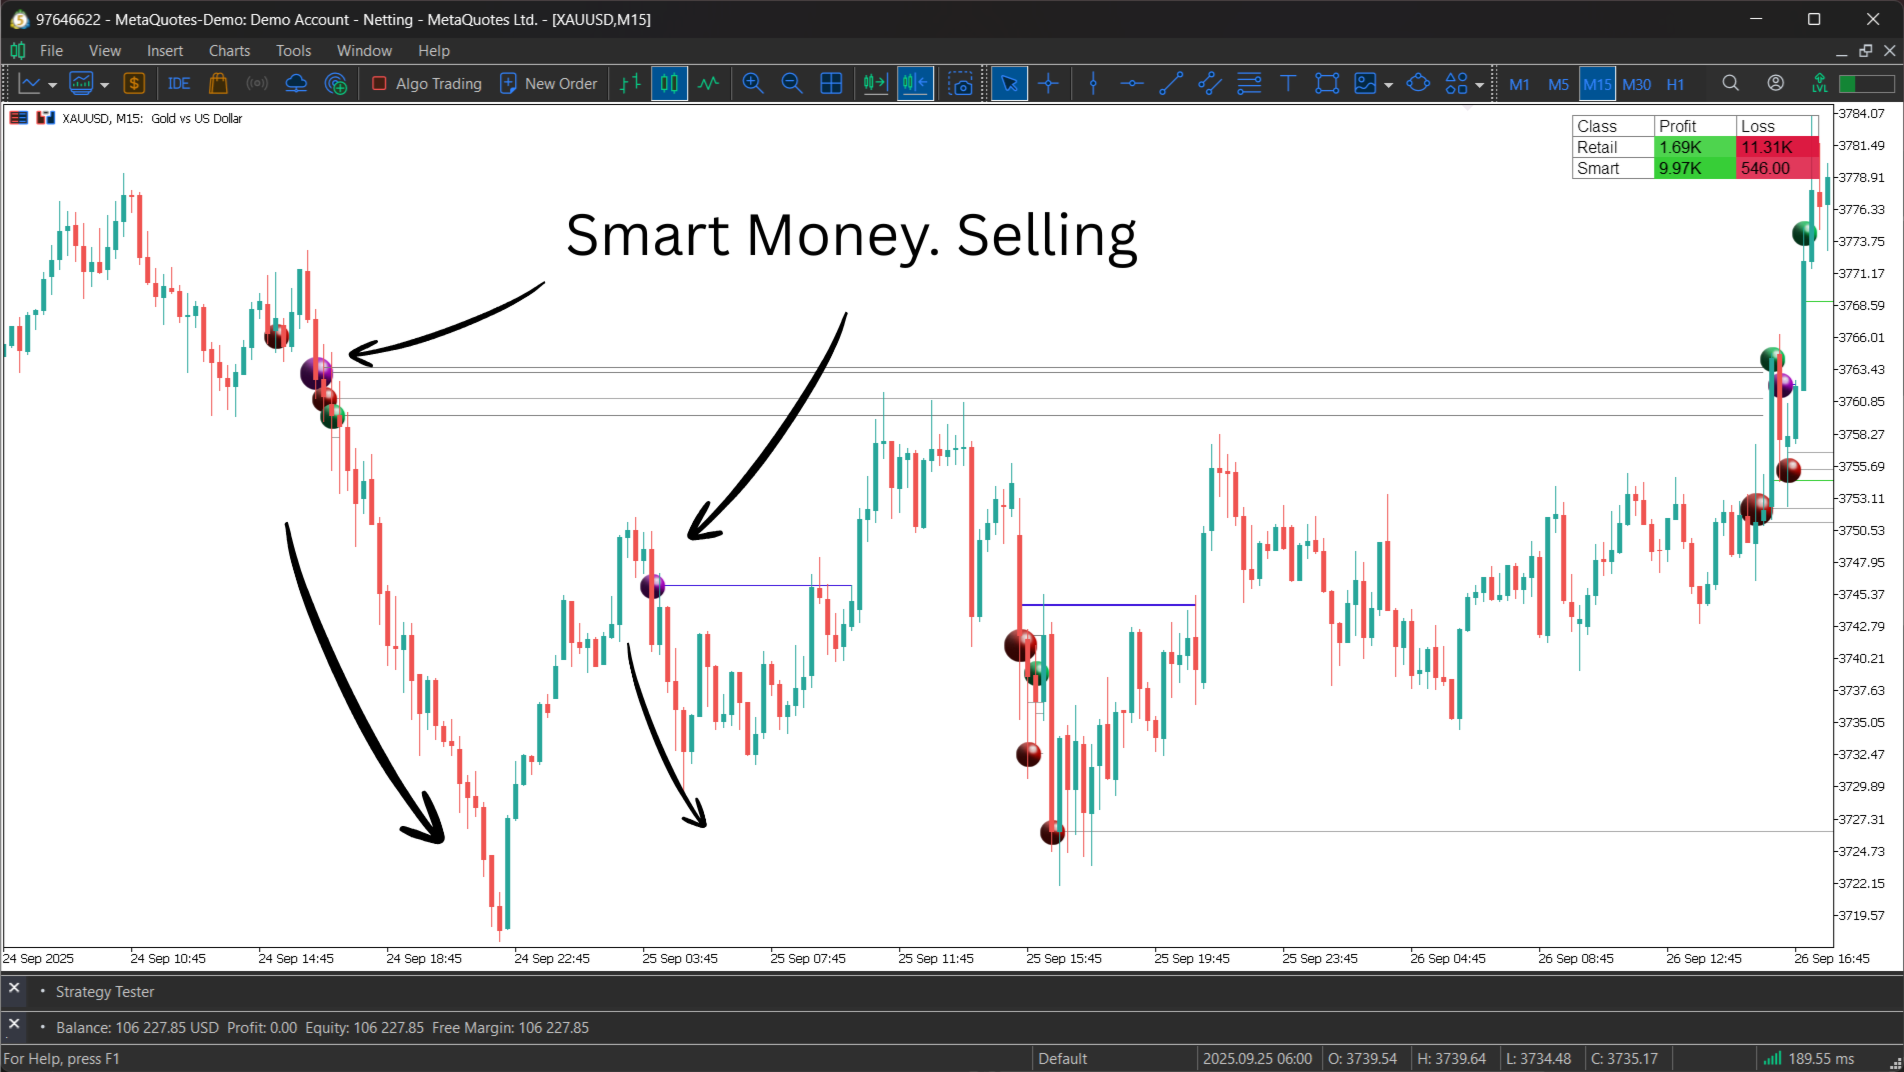
This tool, (one of my favorites by Algo Alpha, from Tradingview)  provides an advanced method of volume analysis by moving beyond traditional histograms. It leverages statistical normalization (Z-score) on lower-timeframe data to identify and classify statistically significant volume events, visualizing the dynamic between "Smart Money" (institutional) and "Retail" participants.

Core Benefits

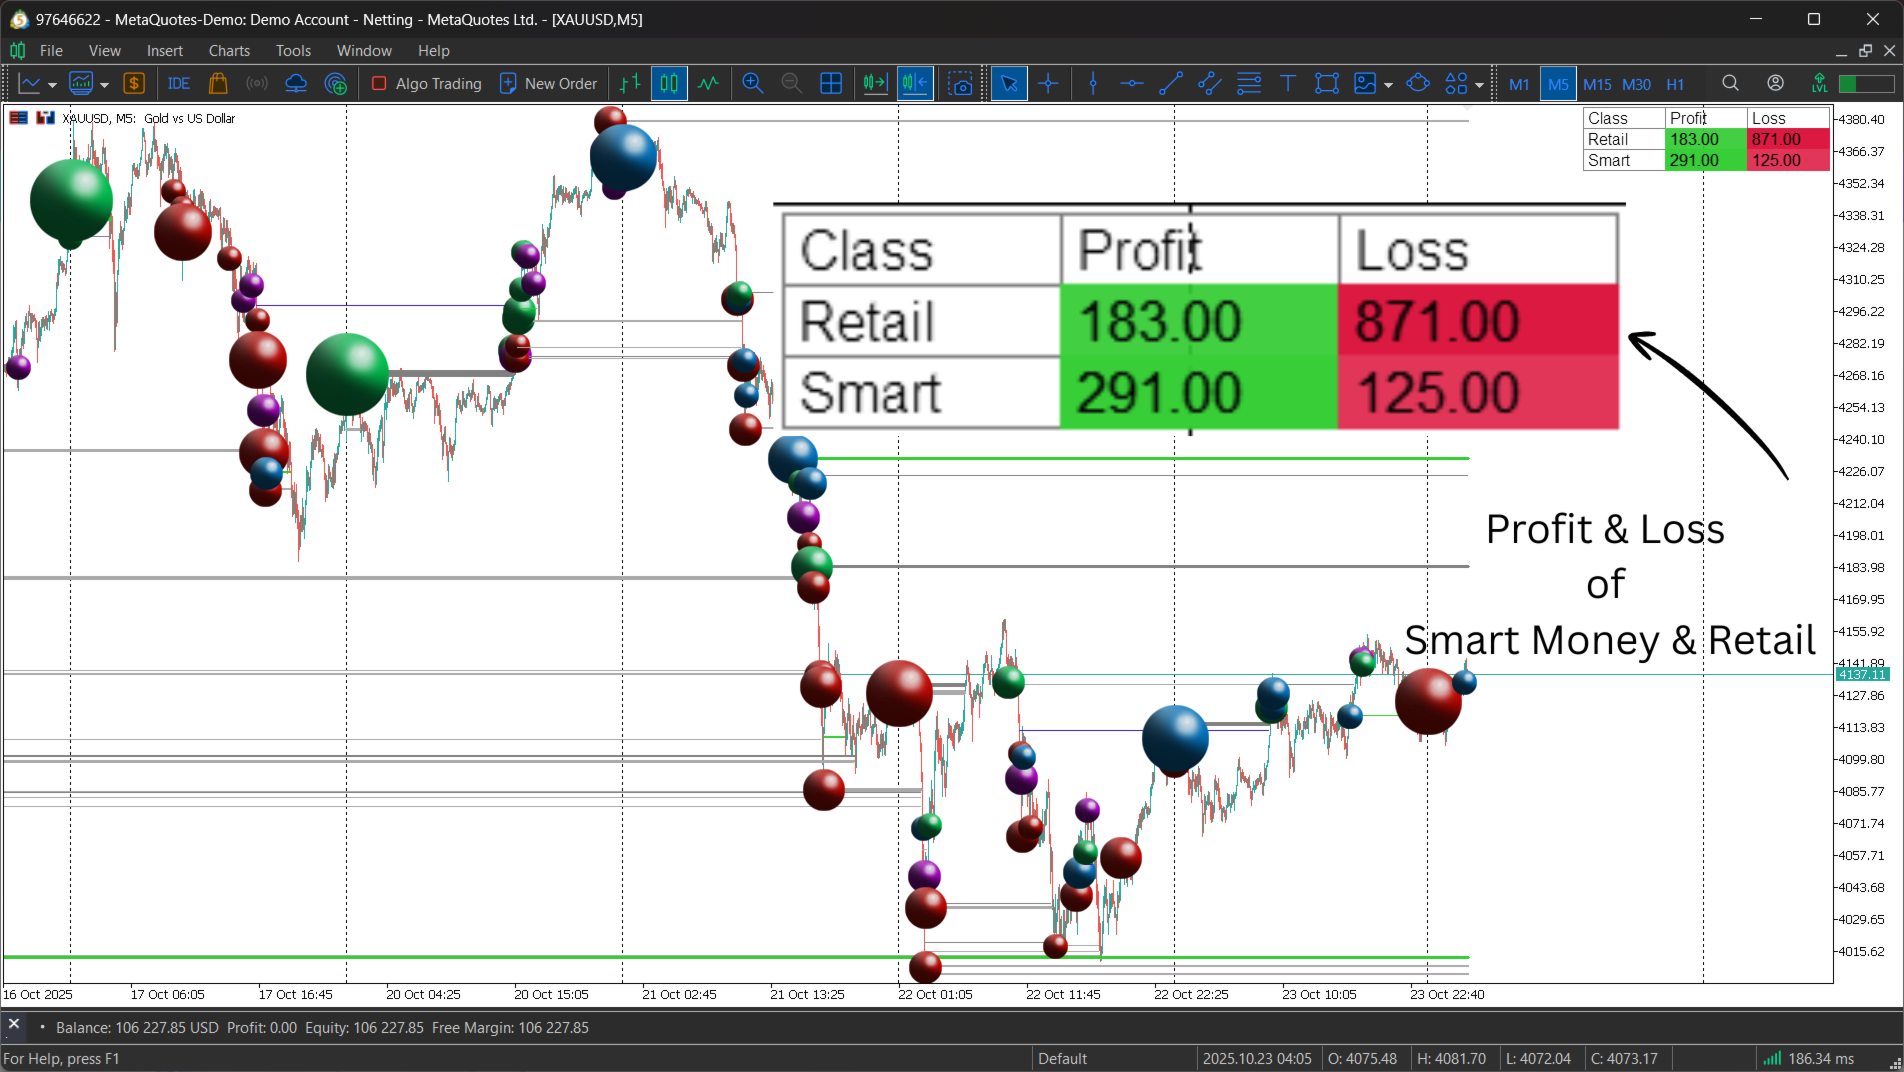
  • Intuitive On-Chart Visualization: By plotting volume as bubbles directly on the price chart, the tool allows for an immediate, consolidated view of price and volume dynamics. The size of each bubble corresponds to the event's statistical intensity.
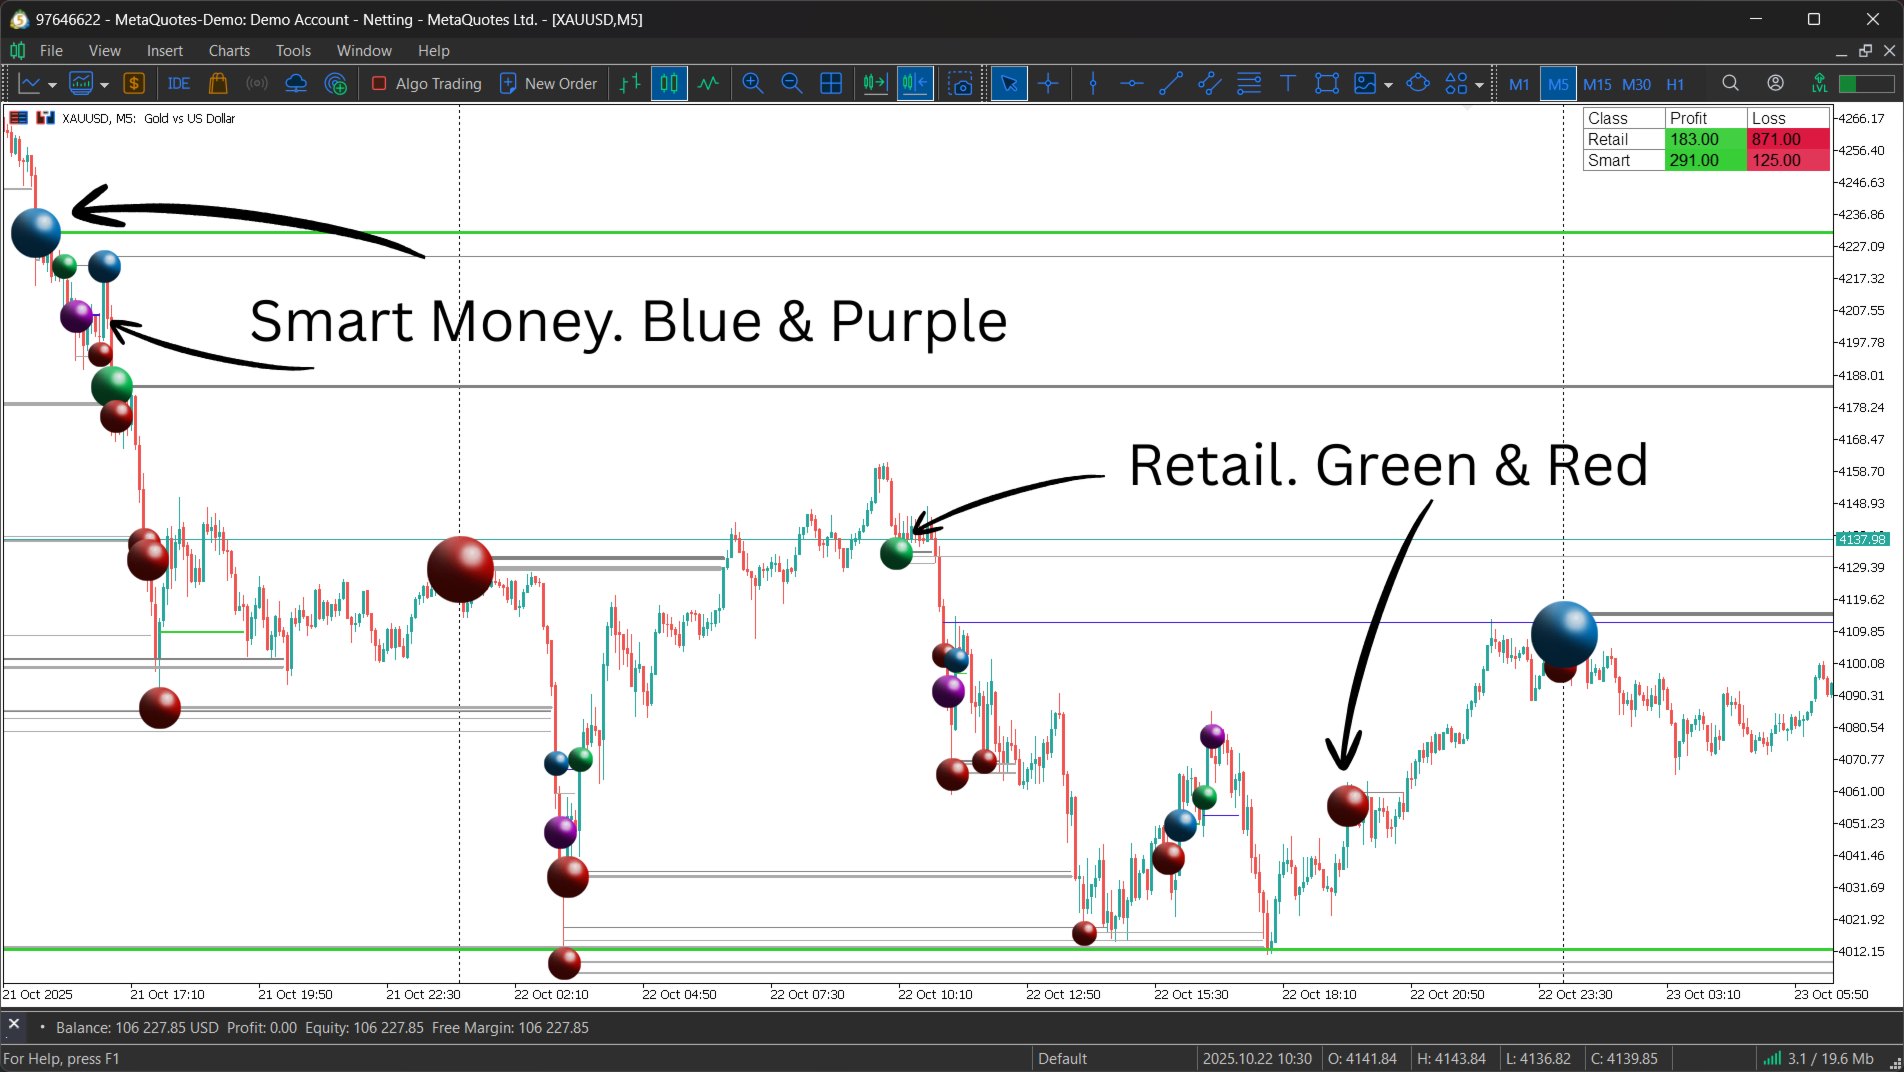
  • Participant Behavior Analysis: The indicator's primary strength is its classification engine. It differentiates between:
    • Smart Money: Extreme volume occurring within the candle body, suggesting planned accumulation or distribution.
    • Retail: Extreme volume at bar extremes, suggesting reactive chasing of breakouts or panic-driven exits.
  • Identification of Key Levels: Large bubbles and their corresponding horizontal lines highlight precise price levels of high-volume activity. These zones often act as significant future support, resistance, or liquidity "footprints."
  • Live Performance Tracking: The integrated P/L (Profit/Loss) table provides a real-time summary of whether Smart Money or Retail-initiated levels are currently "in profit" or "at a loss," offering a clear gauge of which participant group is currently in control of the market.

Use Cases

  1. Analyzing Reaction Zones: Observe clusters of large bubbles and the horizontal levels they generate. These high-volume nodes (HVNs) represent areas where significant capital was transacted and are prime candidates for price reactions (rejections or bounces) on subsequent tests.
  2. Gauging Market Control: The P/L table is a key sentiment gauge. A persistently profitable Smart Money row suggests institutional alignment with the prevailing trend. Conversely, a deeply unprofitable Retail row can signal a "stuck" or "offside" crowd, which may provide fuel for trend continuation as those positions are liquidated.
  3. Confirming Price Action: Use the bubbles to validate market movements. A bullish reversal pattern gains significant confirmation if accompanied by a large "Smart Money" buy bubble near the low. A breakout that is only accompanied by "Retail" buy bubbles (chasing the high) may be viewed with more skepticism, as it could be prone to failure.

 Indicator Settings Configuration

Below is a detailed explanation of each parameter within the indicator's input settings.
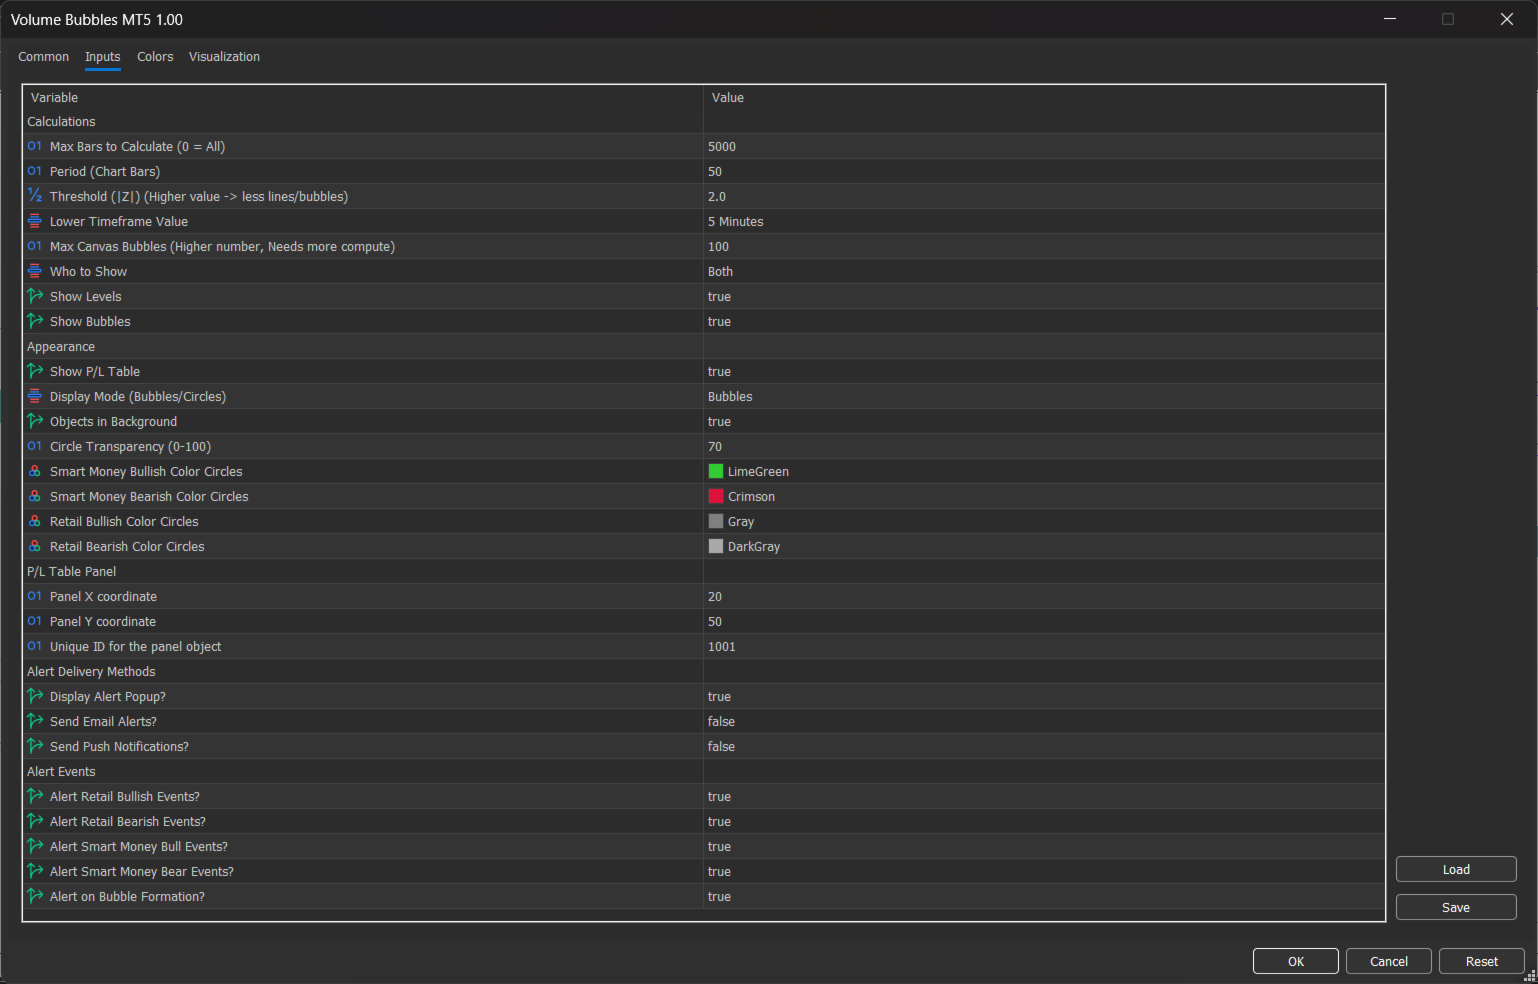
Calculations

This group controls the core data processing and event detection logic.

  • Max Bars to Calculate (0 = All): Limits the number of historical bars the indicator will analyze to enhance performance. 0 calculates on all available history.
  • Period (Chart Bars): The lookback period used to establish the "average" volume for the Z-score calculation. This defines what is considered "normal" activity.
  • Threshold (|Z|): The minimum Z-score value a volume spike must reach to be registered. A higher value filters for only the most extreme volume events.
  • Lower Timeframe Value: The specific lower timeframe (e.g., M5, M15) from which the indicator will sample volume data. This must be set to a timeframe lower than the one on your active chart.
  • Max Canvas Bubbles: A performance setting that limits the total number of bubbles rendered on the chart to maintain platform speed.
  • Who to Show: A filter to isolate the display. Options are "Both," "Smart Money" only, or "Retail" only.
  • Show Levels: Toggles the visibility of the horizontal lines projected from detected volume events.
  • Show Bubbles: Toggles the visibility of the volume bubbles themselves.

Appearance

This group controls the visual styling of the indicator's on-chart elements.

  • Show P/L Table: Toggles the visibility of the on-chart profit/loss comparison dashboard.
  • Display Mode (Bubbles/Circles): Selects the fill style for the plotted volume events (e.g., solid bubbles or outlines).
  • Objects in Background: When true, all indicator objects are rendered behind the price candles to ensure chart clarity.
  • Circle Transparency (0-100): Sets the opacity level for the "Circle" display mode.
  • Smart Money Bullish Color Circles: Assigns the color for bullish (buy) Smart Money events.
  • Smart Money Bearish Color Circles: Assigns the color for bearish (sell) Smart Money events.
  • Retail Bullish Color Circles: Assigns the color for bullish (buy) Retail events.
  • Retail Bearish Color Circles: Assigns the color for bearish (sell) Retail events.

P/L Table Panel

This group manages the positioning and identity of the P/L table.

  • Panel X coordinate: The horizontal pixel position of the table on the chart.
  • Panel Y coordinate: The vertical pixel position of the table on the chart.
  • Unique ID for the panel object: A unique identifier to prevent object conflicts if multiple instances of the indicator are used on the same chart.


Prodotti consigliati
L'indicatore costruisce le quotazioni attuali, che possono essere confrontate con quelle storiche e su questa base fanno una previsione del movimento dei prezzi. L'indicatore ha un campo di testo per una rapida navigazione fino alla data desiderata. Opzioni: Simbolo - selezione del simbolo che visualizzerà l'indicatore; SymbolPeriod - selezione del periodo da cui l'indicatore prenderà i dati; IndicatorColor - colore dell'indicatore; HorisontalShift - spostamento delle virgolette disegnate d
TRI Visualizer
Yoshimi Mon 三 Ura
TRI Visualizer MT5 – Thermodynamic Market Analysis Overview The TRI (Thermal Range Indicator) Visualizer Enhanced is a rare market analysis indicator that goes beyond conventional technical analysis, applying principles of thermodynamics from physics. It interprets market price fluctuations as “thermodynamic energy,” enabling the highly accurate detection of subtle market changes that are often overlooked. Innovative Mechanisms 1. Dual Calculation Engines Classic TRI Mode Formula: |Close
##   ONLY GOLD ##   Тiльки Золото ## **Mercaria Professional Trading Zones - Complete Guide** ## **Mercaria Professional Trading Zones - Повний посібник** ### **How Mercaria Zones Work / Як працюють зони Mercaria** **English:** Mercaria Zones is an advanced trading indicator that identifies high-probability support and resistance areas using ZigZag extremes combined with mathematical zone calculations. The indicator works on multiple timeframes simultaneously, providing a comprehensive view
Italian Questo indicatore funge da assistente avanzato per l'analisi dei grafici per i trader che amano operare con i Pattern Grafici (Chart Patterns). È progettato per ridurre il carico dell'analisi visiva e aumentare la precisione nell'ottenere profitti. Caratteristiche principali di questo indicatore dal punto di vista dell'utilizzo pratico: 1. Rilevamento automatico dei pattern (Automated Pattern Detection) Risparmia tempo e riduce le distorsioni (Bias): Non è necessario tracciare manualment
Nova AC Trader is a modern automation of the Accelerator Oscillator (AC) — a Bill Williams momentum tool designed to detect shifts in market acceleration before trends fully form. This EA transforms the indicator’s early-warning nature into a structured trading system that reacts only when momentum changes are clear and consistent. Instead of waiting for the trend to be obvious, Nova AC Trader identifies when market acceleration starts to turn — offering opportunities at the earliest stage of mo
Be notified of every color change of Heiken Ashi (HA) candles. The indicator will trigger past and new signals every time that HA candles change their colors. ( Note : this tool is based on the code of Heiken Ashi indicator developed by MetaQuotes Software Corp.) Features The signals are triggered at closing of last bar/opening of a new bar; Any kind of alerts can be enabled: Dialog Box, Email message, SMS notifications for smartphones and tablets, and Sound alerts; By default, up arrows are pl
Volume Profile V6
Andrey Kolesnik
4.67 (3)
Indicatore del profilo di volume del mercato + oscillatore intelligente. Funziona su quasi tutti gli strumenti: coppie di valute, azioni, futures, criptovalute, sia su volumi reali che su tick. È possibile impostare la definizione automatica dell'intervallo di costruzione del profilo (ad esempio, per una settimana o un mese, ecc.), oppure impostare l'intervallo manualmente spostando i confini (due linee verticali: rossa e blu). Viene visualizzato sotto forma di istogramma. La larghezza dell'isto
Rainbow EA MT5
Jamal El Alama
Description : Rainbow EA MT5 is a simple Expert advisor based on   Rainbow MT5 indicator witch is based on Moving average with period 34. The indicator is incorporated in the EA, therefore, it is not required for the EA to operate, but if you wish, you can download it from   my product page . The Expert Advisor settings are as follows : Suitable for Timeframes up to H1 The parameters below can be set according to your trading rules. StopLoss ( Stop Loss in pips) TakeProfit ( Take Profit in pips
Price Magnet — Price Density and Attraction Levels Indicator Price Magnet is a professional analytical tool designed to identify key support and resistance levels based on statistical Price Density. The indicator analyzes a specified historical period and detects price levels where the market spent the most time. These zones act as “magnets,” attracting price action or forming a structural base for potential reversals. Unlike traditional Volume Profile tools, Price Magnet focuses on price-time d
Order Book, known also as Market Book, market depth, Level 2, - is a dynamically updated table with current volumes of orders to buy and to sell specific financial instument at price levels near Bid and Ask. MetaTrader 5 provides the means for receiving market book from your broker, but in real time only, without access to its history. The indicator OrderBook Cumulative Indicator accumulates market book data online and visualizes them on the chart. In addition, the indicator can show the market
VR Grid Mt5
Vladimir Pastushak
3.25 (8)
L'indicatore Griglia VR è progettato per creare una griglia grafica con impostazioni definite dall'utente. A differenza della griglia standard , VR Grid viene utilizzata per costruire livelli circolari . A seconda della scelta dell'utente, il passaggio tra i livelli rotondi può essere arbitrario. Inoltre, a differenza di altri indicatori e utilità, VR Grid mantiene la posizione della griglia anche quando cambia l'intervallo di tempo o si riavvia il terminale. È possibile ottenere impostazioni, f
FREE
Signal Strike
Murtadha Majid Jeyad Al-Khuzaie
Signal Strike is a professional trading indicator designed for MetaTrader 5 that delivers clear, high‑confidence entry signals directly on your chart. Built with advanced logic that combines trend, momentum, volatility, and volume confirmation, this tool helps traders identify precise BUY and SELL opportunities with confidence. Unlike generic indicators, Signal Strike is engineered to filter out indecision candles and weak setups. When conditions align, the indicator plots entry, stop loss, an
Noize Absorption Index - is the manual trading system that measures the difference of pressure between bears forces and bulls forces. Green line - is a noize free index that showing curent situation. Zero value of index shows totally choppy/flat market.Values above zero level shows how powerfull bullish wave is and values below zero measures bearish forces.Up arrow appears on bearish market when it's ready to reverse, dn arrow appears on weak bullish market, as a result of reverse expectation.
Visual CrossPulse Dynamics Indicator
AL MOOSAWI ABDULLAH JAFFER BAQER
Visual CrossPulse Dynamics: Trade with the Market's True Rhythm Unlock a new level of market insight with Visual CrossPulse Dynamics, a sophisticated trading indicator designed to adapt to ever-changing volatility and reveal the true direction of the trend. Are you tired of indicators that lag in fast-moving markets or give false signals during consolidation? The Visual CrossPulse Dynamics indicator solves this problem by using an advanced, adaptive algorithm that intelligently adjusts to the m
RBreaker
Zhong Long Wu
RBreaker Gold Indicators is a short-term intraday trading strategy for gold futures that combines trend following and intraday reversal approaches. It not only captures profits during trending markets but also enables timely profit-taking and counter-trend trading during market reversals. This strategy has been ranked among the top ten most profitable trading strategies by the American magazine   Futures Truth   for 15 consecutive years. It boasts a long lifecycle and remains widely used and st
Il livello Premium è un indicatore unico con una precisione superiore all'80% delle previsioni corrette! Questo indicatore è stato testato dai migliori Specialisti di Trading per più di due mesi! L'indicatore dell'autore che non troverai da nessun'altra parte! Dagli screenshot puoi vedere di persona la precisione di questo strumento! 1 è ottimo per il trading di opzioni binarie con un tempo di scadenza di 1 candela. 2 funziona su tutte le coppie di valute, azioni, materie prime, criptovalu
Golden Surfer EA
Aleksandr Chebotaev
5 (1)
Golden Surfer — Potente.Stabile.Professionale PREZZO DI LANCIO SPECIALE Offerta limitata — $355 per i prossimi 5 acquirenti. Successivamente, il prezzo aumenterà a $455 Golden Surfer è un Expert Advisor per il trading automatizzato di XAUUSD (ORO). L'EA è progettato per un'esecuzione controllata e un rischio predefinito. Regola principale: l'EA mantiene una sola posizione alla volta. Nessuna griglia. Nessuna martingala. Nessuna media. Nessun sistema di recupero. Come funziona Mi chiamo   Alex
Overview Harmonic Patterns MT5 is a technical analysis indicator designed for the MetaTrader 5 platform. It identifies and displays harmonic price patterns, such as Butterfly, Cypher, Crab, Bat, Shark, and Gartley, in both bullish and bearish directions. The indicator calculates key price levels, including entry, stop loss, and three take-profit levels, to assist traders in analyzing market movements. Visual elements and customizable alerts enhance usability on the chart. Features Detects six ha
Panoramica Candle Timer Countdown Pro mostra un conto alla rovescia fluido e preciso fino alla chiusura della candela corrente con un arco circolare di progresso. Caratteristiche Conto alla rovescia preciso Arco circolare (Ring o Filled Pie) 6 posizioni disponibili 3 schemi colore Evidenziazione finale Avvisi nuova candela Basso consumo CPU Installazione Scaricare dal MQL5 Market Applicare al grafico Configurare le impostazioni Compatibilità MetaTrader 5 Build 2500+ Tutti i timeframe
Supply Demand areas
Makarii Gubaydullin
Zone di offerta/domanda: aree osservabili dove il prezzo si è avvicinato più volte in passato. Utilità multifunzionale:  66+ funzioni , inclusa questo indicatore  |   Contattami  per qualsiasi domanda  |  Versione MT4 L’indicatore mostra dove il prezzo potrebbe potenzialmente invertirsi di nuovo. Di solito, più volte il prezzo è stato respinto da un livello, più questo è significativo. Nelle impostazioni di input   puoi regolare: Abilitare o disabilitare zone deboli; Mostrare o nascondere descr
HMA Trend Professional MT5
Pavel Zamoshnikov
4.25 (4)
Improved version of the free HMA Trend indicator (for MetaTrader 4) with statistical analysis. HMA Trend is a trend indicator based on the Hull Moving Average (HMA) with two periods. HMA with a slow period identifies the trend, while HMA with a fast period determines the short-term movements and signals in the trend direction. The main differences from the free version: Ability to predict the probability of a trend reversal using analysis of history data. Plotting statistical charts for analyzi
DAILY OH/OL SDEV QUANT MODEL - STATISTICAL TRADING WITH PRECISION RISK MANAGEMENT TRADE WITH MATHEMATICAL CERTAINTY - KNOW YOUR EXACT STOP-LOSS AND TAKE-PROFIT BEFORE YOU ENTER This indicator analyzes 5,000+ days of price history to give you: Exact entry levels (sigma bands locked at daily open) Exact stop-loss distance (from M
Introducing the Boom 300 Sniper Spike Detector – a powerful, non-repainting indicator specifically engineered to help you master spike trading in the Boom 300 market. Whether you're a seasoned trader or new to the game, this tool offers precise and timely signals, allowing you to catch spikes with confidence and improve your overall trading performance. Key Features: Non-Repainting Signals : Ensures consistent and accurate signals that do not repaint, providing you with reliable data to make con
Crash 1000 Scalping Indicator for the Crash 1000 Deriv Synthetic Index. Introduction The Crash 1000 Scalping Indicator is a specialized tool designed for the Crash 1000 index on the Deriv Synthetic market. This indicator is particularly useful for scalping on the M1 timeframe, helping traders to identify precise entry and exit points for buy positions. It is designed to be non-repainting, providing clear signals with audible alerts and push notifications, and is compatible with mobile devices th
Buy Sell Smart
Syamsurizal Dimjati
BUY and SELL smart The BUY and SELL Smart Indicator is a next-generation trading tool engineered for precision scalpers, intraday strategists, and professional analysts who demand both speed and clarity in market visualization. It seamlessly integrates smart candle-based analytics, adaptive ATR logic, and real-time economic event awareness — giving you a fully synchronized view of market volatility and momentum. Through an elegant and optimized interface, FlashScalp delivers   instant signal fee
FourAverageMT5
Mikhail Sergeev
5 (2)
FourAverage è una nuova parola nel rilevamento delle tendenze. Con lo sviluppo della tecnologia dell'informazione e un gran numero di partecipanti, i mercati finanziari sono sempre meno analizzabili da indicatori obsoleti. I mezzi tecnici convenzionali di analisi, come la media mobile o lo stocastico, nella loro forma pura non sono in grado di determinare le direzioni di una tendenza o la sua inversione. Un indicatore può indicare la giusta direzione del prezzo futuro, senza cambiare i suoi para
The indicator displays a matrix of indicators across multiple timeframes with a sum total and optional alert. Custom indicators can also be added to the matrix, in a highly configurable way. The alert threshold can be set to say what percentage of indicators need to be in agreement for an alert to happen. The alerts can turned on/off via on chart tick boxes and can be set to notify to mobile or sent to email, in addition to pop-up. The product offers a great way to create an alert when multiple
Was: $249  Now: $99   Market Profile defines a number of day types that can help the trader to determine market behaviour. A key feature is the Value Area, representing the range of price action where 70% of trading took place. Understanding the Value Area can give traders valuable insight into market direction and establish the higher odds trade. It is an excellent addition to any system you may be using. Inspired by Jim Dalton’s book “Mind Over Markets”, this indicator is designed to suit the
RangeZone  Indicator General Overview: Global Exchange Trading from East to West World financial markets operate on the principle of continuous trading sessions, where activity moves with the sun from one financial center to another. Understanding this dynamic is key to successful trading! How Trading Moves Around the World: Asian Session   (Sydney, Tokyo): Opens first, sets the tone for daily volatility Japanese yen, Australian dollar, Asian indices Often forms key support/resistance level
Gli utenti di questo prodotto hanno anche acquistato
SuperScalp Pro
Van Minh Nguyen
5 (14)
SuperScalp Pro – Sistema avanzato di indicatore per scalping con filtri multipli SuperScalp Pro è un sistema avanzato di indicatore per scalping che combina il classico Supertrend con molteplici filtri di conferma intelligenti. L’indicatore funziona in modo efficiente su tutti i timeframe da M1 a H4 ed è particolarmente adatto per XAUUSD, BTCUSD e le principali coppie Forex. Può essere utilizzato come sistema stand-alone o integrato in modo flessibile nelle strategie di trading esistenti. L’indi
Azimuth Pro
Ottaviano De Cicco
5 (6)
LAUNCH PROMO Azimuth Pro price is initially set at 299$ for the first 100 buyers. Final price will be 499$ . THE DIFFERENCE BETWEEN RETAIL AND INSTITUTIONAL ENTRIES ISN'T THE INDICATOR — IT'S THE LOCATION. Most traders enter at arbitrary price levels, chasing momentum or reacting to lagging signals. Institutions wait for price to reach structured levels where supply and demand actually shift. Azimuth Pro maps these levels automatically: swing-anchored VWAP, multi-timeframe structure lines, an
Divergence Bomber
Ihor Otkydach
4.89 (85)
Ogni acquirente dell’indicatore riceverà inoltre gratuitamente: L’utilità esclusiva “Bomber Utility”, che gestisce automaticamente ogni operazione, imposta i livelli di Stop Loss e Take Profit e chiude le posizioni secondo le regole della strategia I file di configurazione (set file) per adattare l’indicatore a diversi asset I set file per configurare il Bomber Utility in tre modalità: “Rischio Minimo”, “Rischio Bilanciato” e “Strategia di Attesa” Una guida video passo-passo per installare, conf
ARICoins
Temirlan Kdyrkhan
ARICoin is a powerful trading companion designed to generate high-probability entry signals with dynamic TP/SL/DP levels based on volatility. Built-in performance tracking shows win/loss stats, PP1/PP2 hits, and success rates all updated live. Key Features: Buy/Sell signals with adaptive volatility bands Real-time TP/SL/DP levels based on ATR Built-in MA Filter with optional ATR/StdDev volatility Performance stats panel (Success, Profit/Loss, PP1/PP2) Alerts via popup, sound, push, or email Cust
Entry In The Zone and SMC Multi Timeframe is a real-time market analysis tool developed based on Smart Money Concepts (SMC). It is designed to analyze market structure, price direction, reversal points, and key zones across multiple timeframes in a systematic way. The system displays Points of Interest (POI) and real-time No Repaint signals, with instant alerts when price reaches key zones or when signals occur within those zones. It functions as both an Indicator and a Signal System (2-in-1), c
CGE Trading Suite
Carl Gustav Johan Ekstrom
5 (1)
CGE Trading Suite delivers the analytical edge typically reserved for professional trading desks. The platform integrates a full suite of analytical tools into one seamless workflow: dynamic grid mapping, liquidity behavior analysis, ECM, trend lines, MIDAS, trade cycles, and directional channel projections. Together, these provide a unified view of market structure and momentum. Directional clarity is further enhanced by the capital flow index, which measures currency basket strength to identif
Se acquisti questo indicatore, riceverai il mio Trade Manager Professionale + EA  GRATUITAMENTE. Innanzitutto è importante sottolineare che questo sistema di trading è un indicatore Non-Repainting, Non-Redrawing e Non-Lagging, il che lo rende ideale sia per il trading manuale che per quello automatico. Corso online, manuale e download di preset. Il "Sistema di Trading Smart Trend MT5" è una soluzione completa pensata sia per i trader principianti che per quelli esperti. Combina oltre 10 indicat
Meridian Pro
Ottaviano De Cicco
5 (1)
Meridian Pro: Professional Multi-Timeframe Trend Matrix for MT5 Overview Meridian Pro is a multi-timeframe trend matrix by Merkava Labs that compresses directional state, strength, momentum condition and matrix agreement into one compact panel. One adaptive engine, applied consistently from M1 to W1. No per-symbol tuning. No indicator stacking. One structured readout across every asset and every timeframe. Launch Offer — Get Meridian Pro for USD 99 (introductory). Regular price: USD 149. 1. Why
RelicusRoad Pro: Sistema Operativo Quantitativo di Mercato 70% DI SCONTO ACCESSO A VITA (TEMPO LIMITATO) - UNISCITI A 2.000+ TRADER Perché la maggior parte dei trader fallisce anche con indicatori "perfetti"? Perché operano su Singoli Concetti isolati. Un segnale senza contesto è una scommessa. Per vincere serve CONFLUENZA . RelicusRoad Pro non è un semplice indicatore. È un Ecosistema Quantitativo completo . Mappa la "Fair Value Road", distinguendo tra rumore e rotture strutturali. Smetti di in
FX Trend MT5 NG
Daniel Stein
5 (4)
FX Trend NG: La Nuova Generazione di Intelligenza di Trend Multi-Mercato Panoramica FX Trend NG è uno strumento professionale di analisi del trend multi-timeframe e monitoraggio dei mercati. Ti consente di comprendere la struttura completa del mercato in pochi secondi. Invece di passare tra numerosi grafici, puoi identificare immediatamente quali strumenti sono in trend, dove il momentum sta diminuendo e dove esiste un forte allineamento tra i timeframe. Offerta di Lancio – Ottieni FX Trend NG
Power Candles MT5
Daniel Stein
5 (6)
Power Candles – Segnali di ingresso basati sulla forza per tutti i mercati Power Candles porta l’analisi di forza collaudata di Stein Investments direttamente sul grafico dei prezzi. Invece di reagire solo al prezzo, ogni candela viene colorata in base alla reale forza di mercato, consentendo di identificare immediatamente accumuli di momentum, accelerazioni della forza e transizioni di trend pulite. Un’unica logica per tutti i mercati Power Candles funziona automaticamente su tutti i simboli di
AriX
Temirlan Kdyrkhan
1 (4)
AriX Indicator for MT5 A powerful trend-following and signal-evaluation tool AriX is a custom MT5 indicator that combines Moving Averages and ATR-based risk/reward logic to generate clear buy/sell signals. It visualizes dynamic SL/TP levels, evaluates past trade outcomes, and displays win/loss statistics in a clean on-chart panel. Key features include: Buy/Sell signals based on MA crossovers ATR-based SL/TP1/TP2/TP3 levels with visual lines and labels Signal outcome tracking with real-time stat
Quantum TrendPulse
Bogdan Ion Puscasu
5 (22)
Ecco   Quantum TrendPulse   , lo strumento di trading definitivo che combina la potenza di   SuperTrend   ,   RSI   e   Stocastico   in un unico indicatore completo per massimizzare il tuo potenziale di trading. Progettato per i trader che cercano precisione ed efficienza, questo indicatore ti aiuta a identificare con sicurezza le tendenze di mercato, i cambiamenti di momentum e i punti di entrata e uscita ottimali. Caratteristiche principali: Integrazione SuperTrend:   segui facilmente l'andame
Trend Screener Pro MT5
STE S.S.COMPANY
4.84 (102)
Indicatore di tendenza, soluzione unica rivoluzionaria per il trading di tendenze e il filtraggio con tutte le importanti funzionalità di tendenza integrate in un unico strumento! È un indicatore multi-timeframe e multi-valuta al 100% non ridipingibile che può essere utilizzato su tutti i simboli/strumenti: forex, materie prime, criptovalute, indici e azioni. Trend Screener è un indicatore di tendenza che segue un indicatore efficiente che fornisce segnali di tendenza a freccia con punti nel gra
Atomic Analyst MT5
Issam Kassas
3.94 (31)
Innanzitutto, vale la pena sottolineare che questo indicatore di trading non è repaint, non è ridisegno e non presenta ritardi, il che lo rende ideale sia per il trading manuale che per quello automatico. Manuale utente: impostazioni, input e strategia. L'Analista Atomico è un indicatore di azione del prezzo PA che utilizza la forza e il momentum del prezzo per trovare un miglior vantaggio sul mercato. Dotato di filtri avanzati che aiutano a rimuovere rumori e segnali falsi, e aumentare il pote
Strumento per market maker. Meravith: Analizzerà tutti i timeframe e mostrerà il trend attualmente in corso. Evidenzierà le zone di liquidità (equilibrio dei volumi) dove i volumi rialzisti e ribassisti sono uguali. Mostrerà tutti i livelli di liquidità dei diversi timeframe direttamente sul grafico. Genererà e presenterà un’analisi di mercato testuale a scopo di riferimento. Calcolerà obiettivi, livelli di supporto e punti di stop-loss in base al trend attuale. Calcolerà il rapporto rischio/ren
OmniSync Projection
Antonio-alin Teculescu
5 (1)
Chronos Fractal Engine is an innovative price projection indicator for MetaTrader 5, designed to transform your technical analysis by intelligently identifying and projecting historical price patterns. Built upon an advanced correlation algorithm and the fractal principles of the market, this powerful tool visualizes potential future price movements, giving you a unique edge in your trading decisions. What is Chronos Fractal Engine? At its core, the Chronos Fractal Engine employs a sophisticat
Bill Williams Advanced
Siarhei Vashchylka
5 (11)
Bill Williams Advanced is designed for automatic chart analysis using Bill Williams' "Profitunity" system. The indicator analyzes four timeframes at once. Manual (Be sure to read before purchasing) Advantages 1. Analyzes the chart using Bill Williams' "Profitunity" system. Signals are displayed in a table in the corner of the screen and on the price chart. 2. Finds all known AO and AC signals, as well as zone signals. Equipped with a trend filter based on the Alligator. 3. Finds "Divergence Bar
Currency Strength Dashboard Pro Pannello professionale di analisi della forza delle valute in tempo reale per MetaTrader 5 . L’indicatore calcola e visualizza la forza di 8 valute principali (EUR, USD, GBP, JPY, CHF, AUD, CAD, NZD) utilizzando 28 coppie di valute simultaneamente su più timeframe. Il pannello offre al trader una visione completa del mercato a colpo d’occhio — senza calcoli aggiuntivi né la necessità di passare tra diversi grafici. Metodo di calcolo L’indicatore si basa su un meto
Grabber System MT5
Ihor Otkydach
4.83 (23)
Ti presento un eccellente indicatore tecnico: Grabber, che funziona come una strategia di trading "tutto incluso", pronta all’uso. In un solo codice sono integrati strumenti potenti per l’analisi tecnica del mercato, segnali di trading (frecce), funzioni di allerta e notifiche push. Ogni acquirente di questo indicatore riceve anche gratuitamente: L’utility Grabber: per la gestione automatica degli ordini aperti Video tutorial passo dopo passo: per imparare a installare, configurare e utilizzare
Presentazione       Quantum Breakout PRO   , l'innovativo indicatore MQL5 che sta trasformando il modo in cui scambi le zone di breakout! Sviluppato da un team di trader esperti con un'esperienza di trading di oltre 13 anni,       Quantum Breakout PRO       è progettato per spingere il tuo viaggio di trading a nuovi livelli con la sua strategia innovativa e dinamica della zona di breakout. Quantum Breakout Indicator ti fornirà frecce di segnalazione sulle zone di breakout con 5 zone target di
FX Power MT5 NG
Daniel Stein
5 (31)
FX Power: Analizza la Forza delle Valute per Decisioni di Trading Più Intelligenti Panoramica FX Power è lo strumento essenziale per comprendere la reale forza delle principali valute e dell'oro in qualsiasi condizione di mercato. Identificando le valute forti da comprare e quelle deboli da vendere, FX Power semplifica le decisioni di trading e rivela opportunità ad alta probabilità. Che tu segua le tendenze o anticipi inversioni utilizzando valori estremi di Delta, questo strumento si adatta
Advanced Supply Demand MT5
Bernhard Schweigert
4.53 (15)
La migliore soluzione per qualsiasi principiante o trader esperto! Questo indicatore è uno strumento di trading unico, di alta qualità e conveniente perché abbiamo incorporato una serie di funzionalità proprietarie e una nuova formula. Con questo aggiornamento, sarai in grado di mostrare fusi orari doppi. Non solo potrai mostrare una TF più alta, ma anche entrambe, la TF del grafico, PIÙ la TF più alta: SHOWING NESTED ZONES. Tutti i trader di domanda di offerta lo adoreranno. :) Informazioni imp
RFI levels PRO MT5
Roman Podpora
3.67 (3)
L'indicatore mostra accuratamente i punti di inversione e le zone di ritorno dei prezzi in cui il       Principali attori   . Vedi dove si formano le nuove tendenze e prendi decisioni con la massima precisione, mantenendo il controllo su ogni operazione. VERSION MT4     -    Rivela il suo massimo potenziale se combinato con l'indicatore   TREND LINES PRO Cosa mostra l'indicatore: Strutture di inversione e livelli di inversione con attivazione all'inizio di un nuovo trend. Visualizzazione dei li
Market Structure Order Block Dashboard MT5 è un indicatore per MT5 focalizzato sulla struttura di mercato e sui concetti ICT / Smart Money: HH/HL/LH/LL , BOS , ChoCH , oltre a Order Blocks , Fair Value Gaps (FVG) , liquidità (EQH/EQL, sweeps), sessioni / Kill Zones e un Volume Profile integrato, con una dashboard compatta di confluence. Importante: è uno strumento di analisi . Non esegue operazioni (non è un EA). Bonus per gli acquirenti Dopo l’acquisto, puoi ricevere 2 indicatori bonus (a scel
Trend Forecaster
Alexey Minkov
5 (7)
The Trend Forecaster indicator utilizes a unique proprietary algorithm to determine entry points for a breakout trading strategy. The indicator identifies price clusters, analyzes price movement near levels, and provides a signal when the price breaks through a level. The Trend Forecaster indicator is suitable for all financial assets, including currencies (Forex), metals, stocks, indices, and cryptocurrencies. You can also adjust the indicator to work on any time frames, although it is recommen
Crystal Heikin Ashi Signals
Muhammad Jawad Shabir
5 (1)
Crystal Heikin Ashi Signals - Professional Trend & Signal Detection Indicator Advanced Heikin Ashi Visualization with Intelligent Signal System for Manual & Automated Trading Final Price: $149 ---------> Price goes up $10 after every 10 sales . Limited slots available — act fast . Overview Crystal Heikin Ashi Signals is a professional-grade MetaTrader 5 indicator that combines pure Heikin Ashi candle visualization with an advanced momentum-shift detection system. Designed for both manual traders
Scopri quale strategia funziona davvero sul tuo simbolo - prima di rischiare denaro reale. Power Bar rileva le barre di prezzo estreme su qualsiasi simbolo e qualsiasi timeframe, poi esegue istantaneamente il backtest di 3 diverse strategie di trading per confrontare tassi di vincita, fattori di profitto e P&L fianco a fianco. Tutto in un unico pannello interattivo. Niente supposizioni. Niente curve-fitting. Solo dati. Cosa rende Power Bar unico? La maggior parte degli indicatori fornisce un se
Smart Stop Indicator – Precisione intelligente dello stop-loss direttamente sul grafico Panoramica Smart Stop Indicator è la soluzione ideale per i trader che desiderano posizionare il loro stop-loss in modo chiaro e metodico, senza dover indovinare o affidarsi all’intuizione. Questo strumento combina la logica classica del price action (massimi e minimi strutturali) con un moderno riconoscimento dei breakout per identificare il prossimo livello di stop realmente logico. In trend, in range o i
Gann Made Easy è un sistema di trading Forex professionale e facile da usare che si basa sui migliori principi del trading utilizzando la teoria di mr. WD Gann. L'indicatore fornisce segnali ACQUISTA e VENDI accurati, inclusi i livelli di Stop Loss e Take Profit. Puoi fare trading anche in movimento utilizzando le notifiche PUSH. CONTATTAMI DOPO L'ACQUISTO PER RICEVERE GRATUITAMENTE LE ISTRUZIONI DI TRADING E OTTIMI INDICATORI EXTRA! Probabilmente hai già sentito parlare molte volte dei metodi d
Altri dall’autore
TTM Squeeze MT5
Tinashe Ndarimani
4.83 (6)
Overview The TTM Squeeze indicator helps identify low volatility periods (squeeze) that often precede price breakouts. It uses Bollinger Bands (BB) and Keltner Channels (KC) to determine when the market is "coiling" and ready to move. Configuration Guide Volatility Settings The indicator uses Bollinger Bands to measure market volatility. When BBs are inside Keltner Channels, a squeeze is detected. The squeeze suggests the market is consolidating and may soon break out. True Range Option Optional
FREE
XAU Scalper MT5
Tinashe Ndarimani
XAU Scalper MT5 Versione MT4   Uno strumento analitico per l'osservazione dei movimenti di prezzo a breve termine nelle coppie d'oro. L'Indicatore XAU Scalper fornisce segnali di acquisto e vendita basati sulla stabilità della candela, sull'RSI e sul momentum a breve termine. È progettato per aiutare i trader a identificare potenziali punti di ingresso durante i brevi movimenti di mercato nelle coppie XAU. Caratteristiche     Indice di Stabilità della Candela:   Misura la proporzione tra il corp
FREE
SMC Breakout Channels Anticipate market breakouts with precision. SMC Breakout Channels automatically detect accumulation and distribution ranges where professional traders (“smart money”) are most active. By combining volatility-based range detection with real-time volume analysis, this tool highlights the key breakout zones that often precede strong directional moves. Advantages Clarity: No clutter, just clean breakout boxes with clear bullish/bearish bias. Early Signals: Detect hidden ac
FREE
XAU Scalper MT4
Tinashe Ndarimani
XAU Scalper MT4 Versione MT5 Uno strumento analitico per l'osservazione dei movimenti di prezzo a breve termine nelle coppie d'oro. L'Indicatore XAU Scalper fornisce segnali di acquisto e vendita basati sulla stabilità della candela, sull'RSI e sul momentum a breve termine. È progettato per aiutare i trader a identificare potenziali punti di ingresso durante i brevi movimenti di mercato nelle coppie XAU. Caratteristiche Indice di Stabilità della Candela ( Candle Stability Index ): Misura la prop
FREE
Ultra Charts
Tinashe Ndarimani
Ultra Charts - Advanced Custom Chart Types for MT5 Get Manual Here! Get The Free Ultra Charts Trader Here! Ultra Charts is a comprehensive charting solution that brings professional-grade alternative chart types to MetaTrader 5. This Expert Advisor provides traders with multiple custom chart formats beyond standard time-based candlesticks, enabling enhanced technical analysis and pattern recognition. Chart Types Included The product includes six distinct chart types, each designed to filter mark
FREE
TTM Squeeze MT4
Tinashe Ndarimani
Overview The TTM Squeeze indicator helps identify low volatility periods (squeeze) that often precede price breakouts. It uses Bollinger Bands (BB) and Keltner Channels (KC) to determine when the market is "coiling" and ready to move. Configuration Guide Volatility Settings The indicator uses Bollinger Bands to measure market volatility. When BBs are inside Keltner Channels, a squeeze is detected. The squeeze suggests the market is consolidating and may soon break out. True Range Option Optiona
FREE
Interactive Trader - Advanced Visual Trading Panel for MT5 Get Ultra Charts Here! Interactive Trader is a comprehensive visual trading solution that enables traders to execute and manage trades directly from the chart using an intuitive graphical interface. This Expert Advisor combines one-click trading with advanced order management capabilities, making professional trading tools accessible through simple mouse and keyboard controls. Core Features Visual Trading Interface - Clean, customizable
FREE
Lowess Channel
Tinashe Ndarimani
5 (1)
MT5 version Overview The Lowess Channel indicator is a smoothed trend-following tool designed to help traders identify the direction of the trend , detect flat or ranging markets , and spot breakouts from consolidation zones. It creates a central smoothed line with upper and lower channel boundaries, adapting to market noise while maintaining clarity. How It Works The indicator builds a channel around a smoothed price line. The central line reflects the current trend. The upper and lower bound
FREE
MT4 version Overview The Lowess Channel indicator is a smoothed trend-following tool designed to help traders identify the direction of the trend , detect flat or ranging markets , and spot breakouts from consolidation zones. It creates a central smoothed line with upper and lower channel boundaries, adapting to market noise while maintaining clarity. How It Works The indicator builds a channel around a smoothed price line. The central line reflects the current trend. The upper and lower bounda
FREE
Market Cipher
Tinashe Ndarimani
Overview Inspired by Tradingview’s falconCoin, The Market Cipher indicator is a momentum oscillator used to detect overbought/oversold conditions and potential trend reversals. Traders can also use it to spot divergences between price action and momentum for early entry or exit signals. Configuration Guide Core Indicator Settings The indicator calculates momentum using a short-term and a longer-term average. Momentum is plotted as a wave oscillating between overbought and oversold thresholds. Ov
FREE
Heiken Ashi Charts
Tinashe Ndarimani
This EA generates custom Heiken Ashi bars (Standard or Smoothed) on a separate symbol. Below is a guide for using the EA effectively with each input setting: 1. HeikenAshiType input ENUM_HEIKEN_ASHI HeikenAshiType = HEIKEN_STANDARD; Options: HEIKEN_STANDARD or HEIKEN_SMOOTHED Use: Choose the type of Heiken Ashi to generate: HEIKEN_STANDARD for traditional Heiken Ashi bars. HEIKEN_SMOOTHED for smoothed versions using MA filters. 2. SmoothingPeriod input int SmoothingPeriod = 7; Use: Applies only
FREE
Trend Wave Surfer
Tinashe Ndarimani
5 (1)
MT4 Version PANORAMICA Questo indicatore integra un modello di trend-following raffinato con rilevamento dinamico del rifiuto del prezzo, colorazione dinamica delle candele e proiezione degli obiettivi basata su ATR, offrendo ai trader un sistema visivo completo per identificare e gestire configurazioni di continuazione del trend. Si sovrappone direttamente al grafico, individua automaticamente potenziali cambi di trend, conferma i rifiuti vicino a supporti/resistenze adattativi e mostra live
Line Break
Tinashe Ndarimani
This EA generates custom Line Break charts on a separate symbol using the following input settings: 1. LineBreak input int LineBreak = 3; Use: Defines the number of lines required for a reversal (e.g., 3-line break chart). Set to 1: For 1-line break charts (more responsive). Higher values: Create smoother, trend-following charts. 2. StartDate input datetime StartDate = D'2025.03.01';s Use: Specifies the date from which historical data should be loaded and processed. 3. LineBreakTime input bool L
FREE
Overview Inspired by Tradingview’s falconCoin, The Market Cipher indicator is a momentum oscillator used to detect overbought/oversold conditions and potential trend reversals. Traders can also use it to spot divergences between price action and momentum for early entry or exit signals. Configuration Guide Core Indicator Settings The indicator calculates momentum using a short-term and a longer-term average. Momentum is plotted as a wave oscillating between overbought and oversold thresholds. Ov
FREE
MT5 Version PANORAMICA Questo indicatore integra un modello di trend-following raffinato con rilevamento dinamico del rifiuto del prezzo, colorazione dinamica delle candele e proiezione degli obiettivi basata su ATR, offrendo ai trader un sistema visivo completo per identificare e gestire configurazioni di continuazione del trend. Si sovrappone direttamente al grafico, individua automaticamente potenziali cambi di trend, conferma i rifiuti vicino a supporti/resistenze adattativi e mostra live
MT5 Bar Replay Pro
Tinashe Ndarimani
3.5 (2)
A causa di una limitazione di MetaTrader 5, l’EA non funziona in modalità Strategy Tester. Per vedere come funziona, puoi scaricare la versione demo Questi sono i due passaggi fondamentali per utilizzare questo EA: How To Use Carica l’EA sul simbolo desiderato con input "Constructor". Successivamente, carica l’EA sul simbolo personalizzato appena creato, con input "Controller". Overview MT5 Bar Replay Pro è la risposta di MetaTrader 5 alla funzione "Bar Replay" di TradingView. Include tut
Filtro:
Nessuna recensione
Rispondi alla recensione