Dynamic Flux Oscillator Pro
- Indicatori
-
AL MOOSAWI ABDULLAH JAFFER BAQER
 To trade successfully we need to go through the proven path that others had gone and reached!
Here are 17 quotes from such successful investors:
1- Limit your size in any position so that fear does not become the prevailing instinct guiding your judgment.
Joe Vidich - Versione: 1.0
- Attivazioni: 5
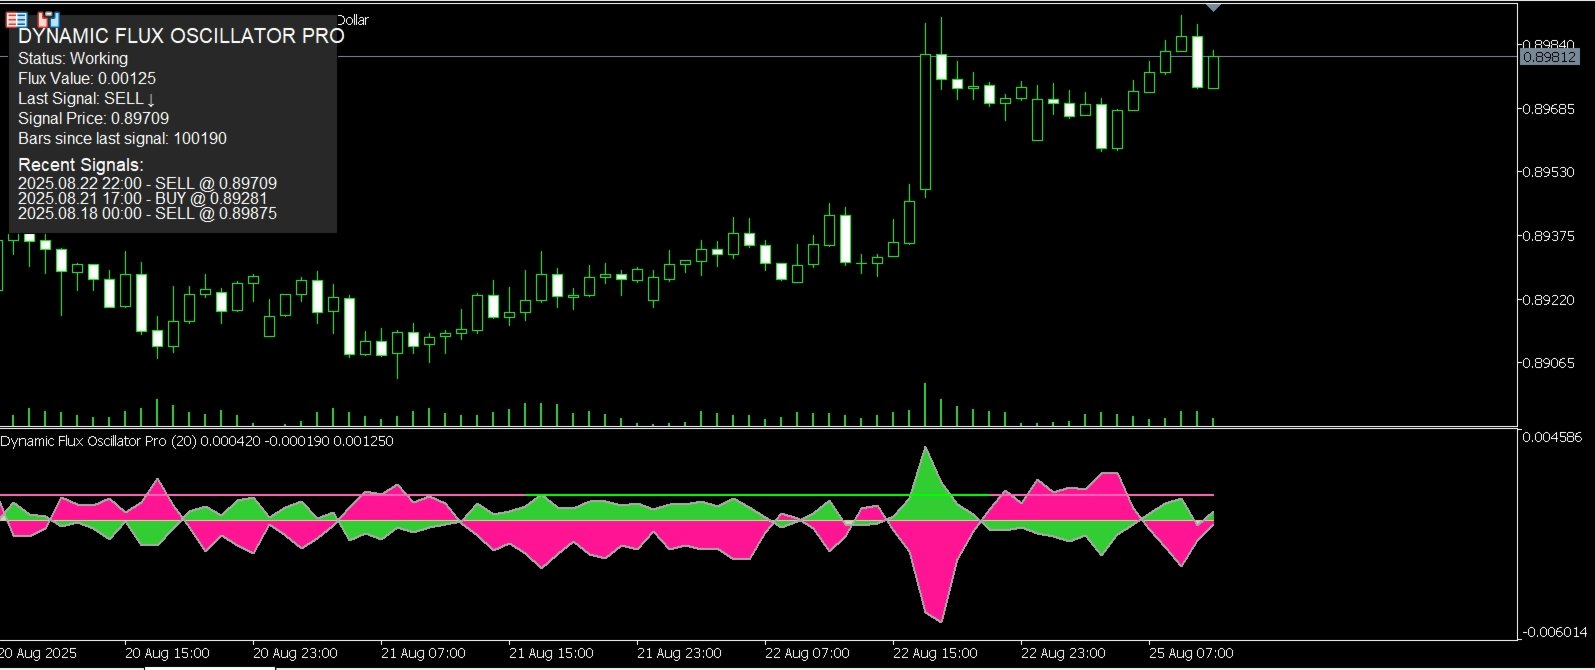
Dynamic Flux Oscillator Pro
Unlock the Market's True Momentum and Trade with Unprecedented Clarity
Are you tired of lagging indicators that generate signals long after the optimal entry point has passed? The Dynamic Flux Oscillator Pro is a professional-grade trading tool meticulously engineered to solve this problem. It moves beyond traditional oscillators by analyzing the raw, underlying momentum of the market—what we call "market flux"—to provide you with timely, high-probability trading signals. For just $30, you can equip yourself with an indicator that thinks ahead of the crowd.
The Logic Behind the Dynamic Flux Oscillator Pro
This is not just another moving average crossover tool. The power of the Dynamic Flux Oscillator Pro lies in its sophisticated, multi-stage calculation engine that gives you a genuine edge.
1. Advanced Adaptive Smoothing Core (JMA)
At the heart of the indicator is an advanced Jurik Moving Average (JMA) algorithm. Unlike standard moving averages (Simple, Exponential, etc.) that suffer from significant lag, our JMA core is designed for minimal delay and maximum responsiveness. It intelligently adapts to market volatility, becoming faster and more sensitive during high-momentum moves and smoother during quiet periods. This means the baseline for our calculation is always a true, responsive representation of the current price action, eliminating the noise without sacrificing speed.
2. Measuring the "Flux"
Once we have this highly adaptive baseline, the indicator calculates the "flux." This is a precise measurement of how forcefully the price is moving away from its smoothed average. We calculate two types of flux:
-
Upward Flux: Measures the strength of bullish pressure pushing the price above its adaptive average.
-
Downward Flux: Measures the strength of bearish pressure pulling the price below its adaptive average.
These values represent the real-time buying and selling energy in the market.
3. Dynamic Volatility Bands
The true innovation is how we determine a valid signal. The indicator calculates a dynamic threshold level based on recent market volatility over a user-defined history. This level acts as a breakout zone. Instead of using fixed overbought or oversold levels like a standard RSI or Stochastics, our levels expand and contract with the market's volatility. In volatile markets, the threshold is higher, requiring more momentum for a signal and filtering out false moves. In quiet markets, the threshold is lower, allowing you to catch moves earlier.
4. High-Probability Signal Generation
A trade signal is generated only when the market's momentum is strong enough to break past these dynamic volatility bands:
-
A BUY signal occurs when the Upward Flux (green line) crosses above the dynamic upper band. This indicates that bullish momentum is exceptionally strong and a new uptrend is likely forming.
-
A SELL signal occurs when the Downward Flux (pink line) crosses above the dynamic lower band. This shows that bearish pressure is powerful enough to signal a potential new downtrend.
Key Features
-
Advanced JMA Smoothing: A high-performance core that dramatically reduces lag and filters market noise effectively.
-
No Repainting: Signals are locked in on the close of the bar. You can trust what you see.
-
Dynamic Volatility Levels: Breakout levels that adapt to the market, ensuring the indicator is effective in any condition, from ranging to trending.
-
Clear Visual Signals: The main oscillator line changes color to green for bullish momentum and pink for bearish momentum, giving you an instant read on the market's state.
-
Comprehensive On-Screen Dashboard: The professional info panel keeps you informed with the latest signal type, entry price, bars since the last signal, and a history of recent signals, so you never lose track of the action.
-
Fully Customizable: Tailor every core parameter, including the analysis period, price type, history depth, and multiplier, to fit your specific trading style and instrument. All colors and visual elements are also fully adjustable.
How to Trade with the Dynamic Flux Oscillator Pro
Trading with the indicator is intuitive and straightforward:
-
Entry for a Buy Trade: Wait for the main oscillator line to turn lime green and cross above the upper dynamic gray line. This is your confirmation of strong bullish momentum.
-
Entry for a Sell Trade: Wait for the main oscillator line to turn hot pink and cross above the lower dynamic gray line. This confirms significant bearish momentum.
-
Confirmation: For best results, use the signals as a primary confirmation tool in conjunction with your existing strategy, such as support and resistance levels, chart patterns, or higher timeframe trend analysis.
Stop relying on outdated tools that leave you trading in the past. The Dynamic Flux Oscillator Pro provides a forward-looking view of market momentum, giving you the confidence to enter trades at the right time. Add this powerful and versatile tool to your collection today.