CCI Breakout SW
- Indicatori
- Versione: 2.0

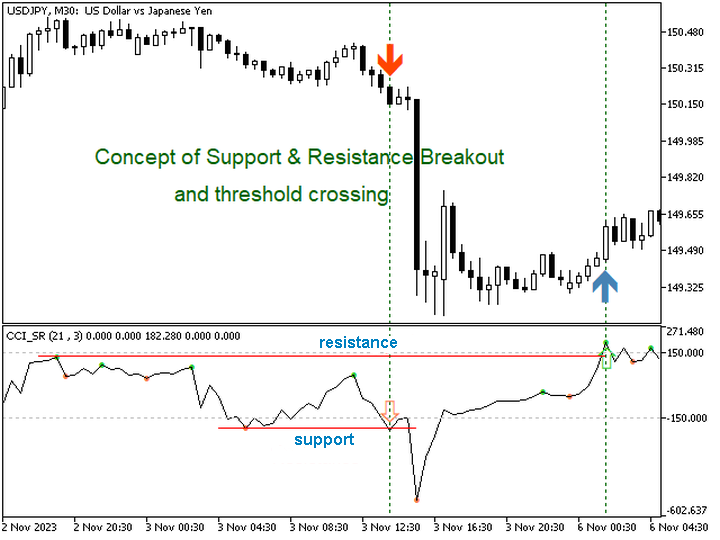
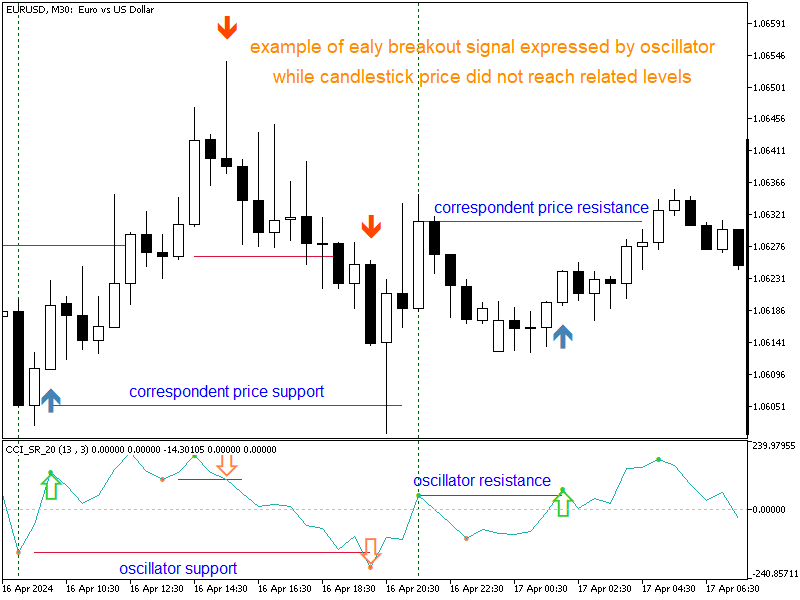
Probability emerges to record higher prices when Commodity Channel Index breaks out oscillator historical resistance level when exhibit overbought values. Since, oscillator breakout of support and resistance have similar effect as price breaks support and resistance levels, therefore, its highly advised to confirm price breakout with oscillator breakout; certainly, will have the same output in short trades.
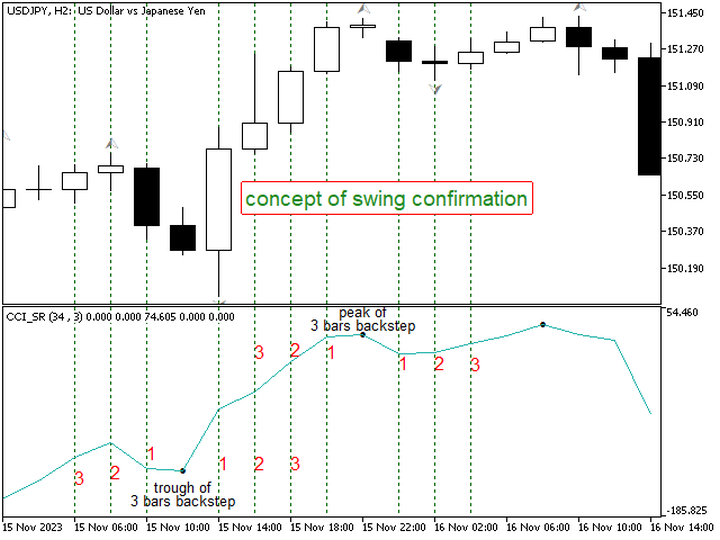
Concept is based on find swing levels which based on number of bars by each side of peak or trough - as mentioned by first screenshot - and in turn subjected to change by indicator settings "swing backstep".
Indicator signals are shown only on separated window; however, in case of desire to have signals displayed on chart window, pertained indicator could be found at https://www.mql5.com/en/market/product/120352/
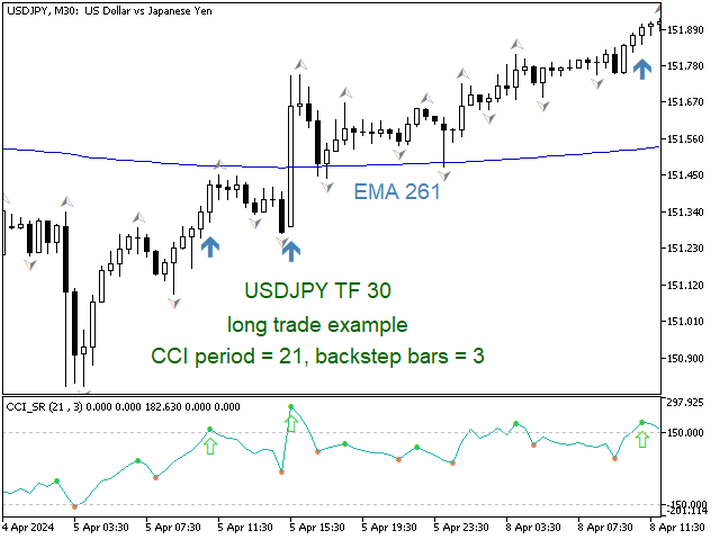
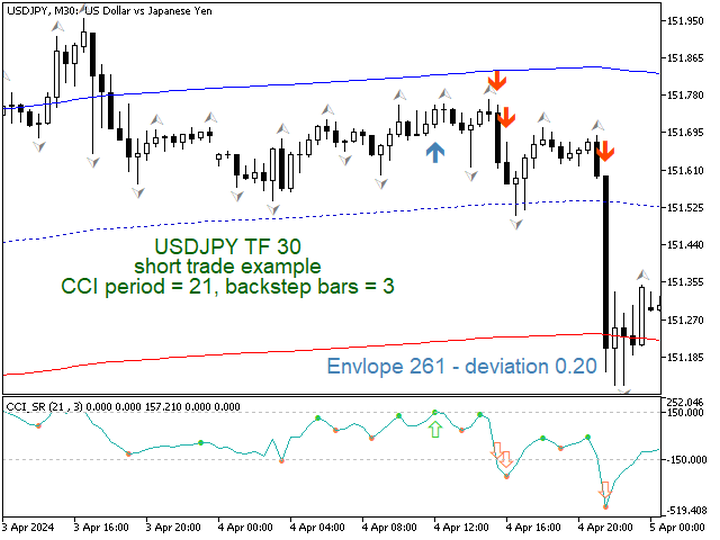
Indicator recommended to be used coinciding use other indicators for price support and resistance and/or trend indicator/s
Having desire to use the indicator in your EA , consider buffer no 3 for long trades , and buffer no 4 for short trades
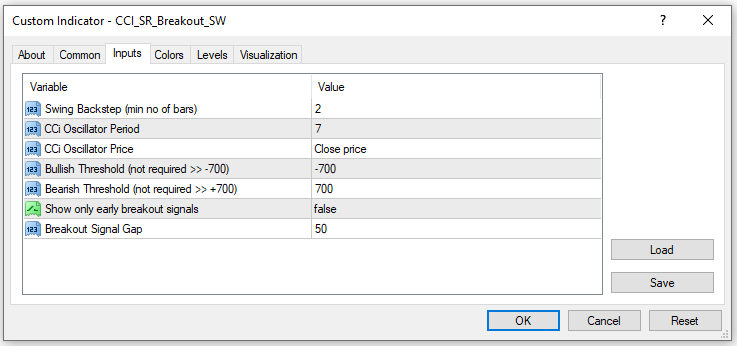
indicator setting:
- Swing Backstep (min no of bars) : minimum no of bars to form peak or trough by each side
- CCi Oscillator Period : No of bars to calculate CCi values
- CCi Oscillator Price : Applied price to calculate CCi values, open, high, low, close
- Bullish Threshold (not required >> -700) : minimum CCi value to consider overbought and display signal; having no desire to use threshold and display signals of any breakout, use a very low value (ex. -700)
- Bearish Threshold (not required >> +700) : maximum CCi value to consider oversold and display signal; having no desire to use threshold and display signals of any breakout, use a very high value (ex. +700).
- Show only early breakout signals : false to display coinciding and early signals , true to display only early signals - check last screenshot
- Breakout Signal Gap : controls the distance between signal arrow and CCI curve
Note:
No indicator will guarantee 100% of wining trades, but user shall backtest for optimized setting in conjunction with other indicators
MT5 version available at https://www.mql5.com/en/market/product/116041