Unisciti alla nostra fan page
- Pubblicati da::
- Nikolay Kositsin
- Visualizzazioni:
- 45
- Valutazioni:
- Pubblicato:
-
Hai bisogno di un robot o indicatore basato su questo codice? Ordinalo su Freelance Vai a Freelance
Il vero autore:
Rosh
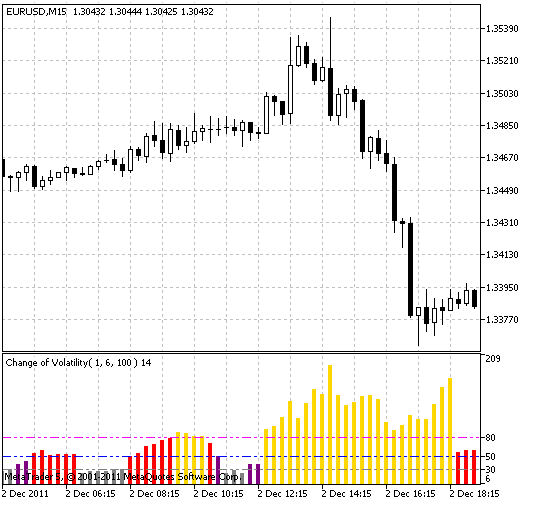
Ci sono molti modi per misurare la volatilità (variabilità). Uno di questi consiste nel calcolare la deviazione standard degli incrementi di prezzo (rendimenti) in un certo periodo di tempo. A volte la volatilità attuale su un breve periodo (ad esempio, 6 giorni) è correlata alla volatilità su un intervallo più lungo, ad esempio la volatilità su 100 giorni. Questo indicatore misura il rapporto tra la volatilità a breve termine Vol_short e la volatilità a lungo termine Vol_long:
Vol_change=Vol_short/Vol_long
La deviazione standard non viene ricavata dalla differenza dei prezzi di chiusura, ma dal rapporto tra il prezzo di chiusura del giorno corrente e il prezzo di chiusura del giorno precedente:
Mom[i]=Chiusura[i]/Chiusura[i+1]
Vol_k=Std(Mom,k),
dove k è il periodo di misurazione della volatilità.
L'indicatore utilizza le classi della libreria SmoothAlgorithms.mqh (copiatele nella directory terminal_data_terminal\MQL5\Include); una descrizione dettagliata del funzionamento di queste classi è stata pubblicata nell'articolo"Averaging price series without additional buffer for intermediate calculations".
Questo indicatore è stato implementato per la prima volta in MQL4 e pubblicato in Code Base il 21.11.2007.

Tradotto dal russo da MetaQuotes Ltd.
Codice originale https://www.mql5.com/ru/code/773
 Zigzag Custom Timeframe
Si tratta del classico zigzag con un input di timeframe per visualizzare uno zigzag HTF su un grafico LTF.
 Consolidation
Questo indicatore calcola il conteggio dei movimenti in una direzione nel periodo selezionato.
 Bezier
Un'alternativa alle medie mobili, ma con un ritardo inferiore e un fattore di sensibilità regolabile.
 FlatTrend2
L'indicatore di segnale più semplice per determinare la forza e la direzione del trend.