Unisciti alla nostra fan page
- Visualizzazioni:
- 3573
- Valutazioni:
- Pubblicato:
- Aggiornato:
-
Hai bisogno di un robot o indicatore basato su questo codice? Ordinalo su Freelance Vai a Freelance
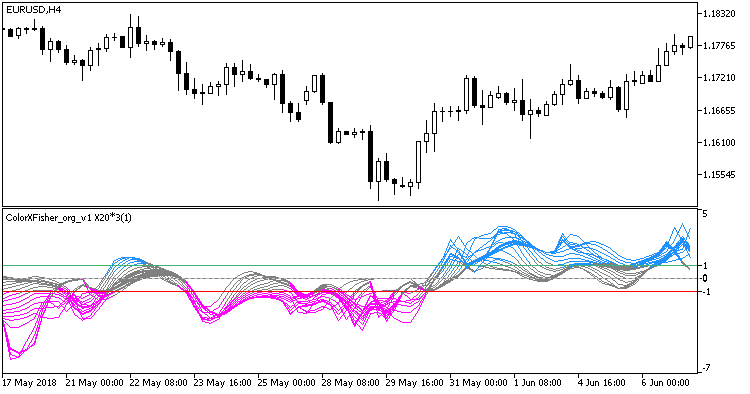
XFisher_org_v1_X20 indicator is able to color each line depending on its position relative to overbought and oversold areas. When launching the indicator, you can change the style and color of only the first indicator line, while the remaining lines will have a similar look.
The indicator uses SmoothAlgorithms.mqh library classes (copy it to <terminal_data_folder>\MQL5\Include). The use of the classes was thoroughly described in the article "Averaging Price Series for Intermediate Calculations Without Using Additional Buffers".
To provide correct operation of the indicator, place the compiled XFisher_org_v1.ex5 indicator file in terminal_data_folder\MQL5\Indicators.

Fig. 1. ColorXFisher_org_v1_X20 indicator
Tradotto dal russo da MetaQuotes Ltd.
Codice originale https://www.mql5.com/ru/code/23012
 ColorXFisher_org_v1_X20_Cloud
XColorFisher_org_v1_X20 indicator featuring background filling in overbought/oversold areas
 ColorRSI_X20_Cloud
ColorRSI_X20 indicator featuring background filling in overbought/oversold areas
 Time_Bar_Custom_Weekly
The indicator plots one vertical line per day in a specified moment of time once per week
 Wick_Length
Wick length indicator