 MetaTrader 5
 Sistemi Esperti
 Indicatori
 Script
 Librerie
 Archiviazione
Guarda come scaricare robot di trading gratuitamente
Ci trovi su Telegram!
Unisciti alla nostra fan page
Unisciti alla nostra fan page
Ti è piaciuto lo script? Provalo nel Terminale MetaTrader 5

Vertical Horizontal Filter - indicatore per MetaTrader 5

- Visualizzazioni:
- 9668
- Valutazioni:
- Pubblicato:
- Aggiornato:
-
 Ti stai perdendo delle opportunità di trading:
- App di trading gratuite
- Oltre 8.000 segnali per il copy trading
- Notizie economiche per esplorare i mercati finanziari
Registrazione AccediAccetti la politica del sito e le condizioni d’uso
Se non hai un account, registrati -
 Hai bisogno di un robot o indicatore basato su questo codice? Ordinalo su Freelance
Vai a Freelance
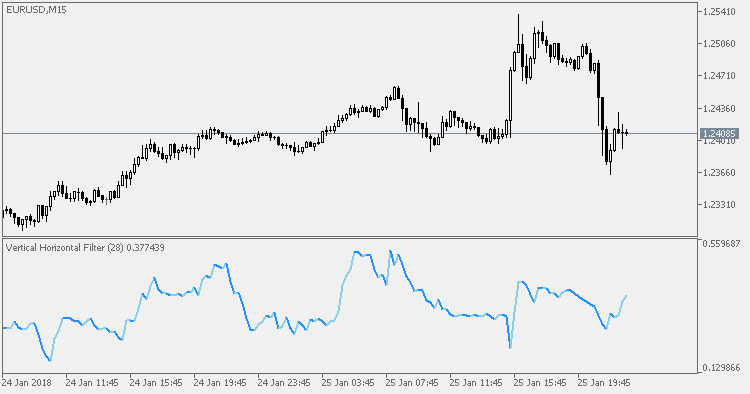
The Vertical Horizontal Filter ("VHF") determines whether prices are in a trending phase or a congestion phase. The VHF was first presented by Adam White in an article published in the August, 1991 issue of Futures Magazine.
Interpretation
Probably the biggest problem in technical analysis is determining if prices are trending or are in a trading-range. The VHF indicator attempts to determine the "trendiness" of prices to help you decide which indicators to use.
There are three major ways to interpret the VHF indicator:
- You can use the VHF values themselves to determine the degree that prices are trending. The higher the VHF, the higher the degree of trending and the more you should be using trend-following indicators.
- You can use the direction of the VHF to determine whether a trending or congestion phase is developing. A rising VHF indicates a developing trend; a falling VHF indicates that prices may be entering a congestion phase.
- You can use the VHF as a contrarian indicator. Expect congestion periods to follow high VHF values; expect prices to trend following low VHF values.
Recommendations
- Accompany the VHF indicator with some "trending" in order to be able to determine if the trending indicator is indeed showing a trend or we are in a ranging phase.
Relative Momentum Index
Relative Momentum Index (RMI) is a variation of the RSI indicator. The RMI counts up and down days from the Close relative to the Close X days ago (where X is not limited to 1 as is required by the RSI) instead of counting up and down days from Close to Close as the RSI does.
Moving slope rate of change - Extended
Extended version of MSROC indicator.
Ulcer Index
This Ulcer Index indicator was derived from the stock risk indicator by Peter Martin in the 1987 book "The Investors Guide to Fidelity Funds".
Chandes Quick Stick (Qstick)
Chandes Quick Stick (Qstick)