 MetaTrader 5
 Sistemi Esperti
 Indicatori
 Script
 Librerie
 Archiviazione
Guarda come scaricare robot di trading gratuitamente
Ci trovi su Telegram!
Unisciti alla nostra fan page
Unisciti alla nostra fan page
Ti è piaciuto lo script? Provalo nel Terminale MetaTrader 5

Trend indicator based on singular spectrum analysis - indicatore per MetaTrader 5

- Visualizzazioni:
- 19271
- Valutazioni:
- Pubblicato:
- Aggiornato:
-
 Ti stai perdendo delle opportunità di trading:
- App di trading gratuite
- Oltre 8.000 segnali per il copy trading
- Notizie economiche per esplorare i mercati finanziari
Registrazione AccediAccetti la politica del sito e le condizioni d’uso
Se non hai un account, registrati -
 Hai bisogno di un robot o indicatore basato su questo codice? Ordinalo su Freelance
Vai a Freelance
Extracting trend and filtering noises using the method of singular spectrum analysis. Adjusting the indicator parameters allows to control the smoothness of the extracted trend and noise filtering threshold.
The time horizon of the trading strategy determines the optimum dissection of data into trend, low-frequency and high-frequency additive components, followed by signal reconstruction. The indicator (smoothed trend) does not have phase delays, unlike the conventional filtering methods and smoothed average.
Trend indicator based on the "Caterpillar" method involves expansion of the price series into additive components. This does not require the series to be stationary, knowing the trend model or information on presence of period components and their periods [1-4].
Capabilities of the developed indicator allow to smooth the series, extract the trend and (by selecting the adjustment parameters of the model for the initial price series) consider the contribution of the oscillator summands on a smaller time scale — filter out the "noise" fluctuations.
Indicator Parameters
The main parameters are:
- SegmentLength — length of "latest history" fragment in the price series.
- SegmentLag — length of caterpillar. Selected in the range from 1/4 to 1/2 of the fragment length. Affects the discriminability of the components and the trend smoothness.
- EigMax — the number of principal components (dissection modes). Defines the dimension of the signals subspace and consideration of the fluctuations at different scales.
- EigNoiseFlag — flag for calculating the number of principle components, to toggle between "fixed" number of modes and the value of the allowed noise. Options = 0,1,2.
- EigNoiseLevel — allowed noise percentage in the overall "fluctuation energy" of the series, if EigNoiseFlag != 0. Overrides the EigMax during calculations.
Options of the EigNoiseFlag integer parameter:
- 0 - the dimension of the signal space is fixed: [1,EigMax] ( EigNoiseLevel is ignored. If EigMax is greater than allowed, it is limited to the allowed value).
- 1 — the share of an individual mode value to the total sum of values not less than the specified error EigNoiseLevel. EigMax is selected automatically.
- 2 — consider the modes with the total share different from "one" (full) no more than by EigNoiseLevel. EigMax is selected automatically.
Typical selection and impact of parameters:
- SegmentLength — length of price series fragment at the end of the data history. It is selected based on the history stability and more or less uniform nature of changes in data or strategy period.
- SegmentLag — sets the dimension for the "filter width" for individual modes (inversely proportional). Affects the smoothness and adjustment of the trend to the volatility of the price chart.
- EigMax — set the dimension to the "signal" subspace with useful information. Sets the "noise" threshold.
- EigNoiseLevel — sets the "noise" value in the total dispersion of the series. Should be specified as a Percentage.
Implementation
The CCaterpillar class implemented in the CCaterpillar.mqh file includes everything necessary for the calculation of trend, except the linear algebra procedures (the ALGLIB library is used for the singular dissection of the trajectory matrix). The code presented in the file includes the descriptions for members and procedures of the class.
The indicator operation requires the files:
- 1) MQL5\Include\SSA\CCaterpillar.mqh
- 2) MQL5\Indicators\SingularMA.mq5
- The ALGLIB library (I side with many people, who are thankful to Sergey Bochkanov for providing the wonderful ALGLIB library of numerical methods)
Peculiarities of usage
It is not recommended to set a data fragment greater than 300 values due to high computational load. It is optimal to use 150-200. You can always switch to another period of chart calculations to cover a larger history interval.
It is advisable to change the "caterpillar" window in the range from 1/3 to 1/2 of the fragment length. If the window exceeds half of the fragment, then due to the symmetry of the trajectory and the matrix transposed of it, that is equivalent to a segment with length, symmetrical relative to the middle of the fragment. Small window length does not provide qualitative averaging and splitting of information to by certain modes.
If there is a slow flow of data in the graphical interface of the price series, the possible solutions may be: a) decrease the fragment length; b) increase the ReCalcLim parameter of recalculation discreteness in the OnCalculate function.
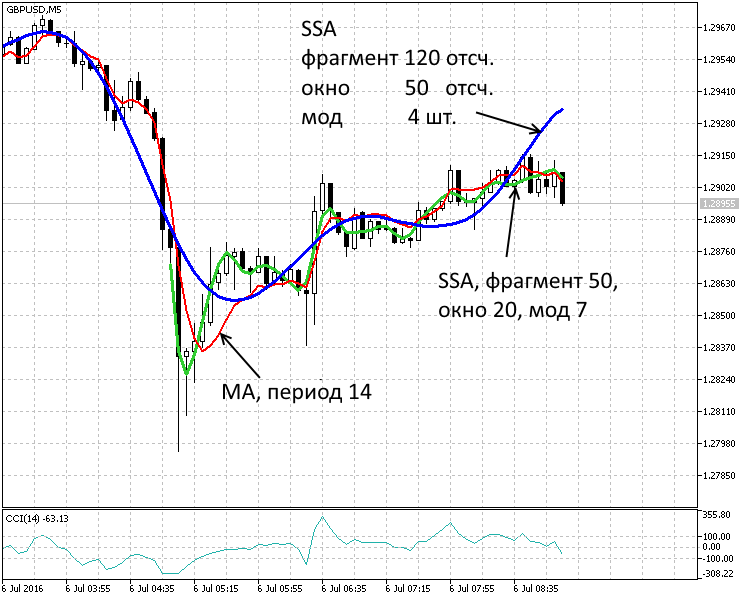
Fig.1. Period of 5 minutes. Two trends SSA(120,50,4), SSA(50,20,7) and moving average MA(14)

Fig. 2. Period of 1 hour. Two trends SSA(120,50,4), SSA(50,20,7) and moving average MA(14)
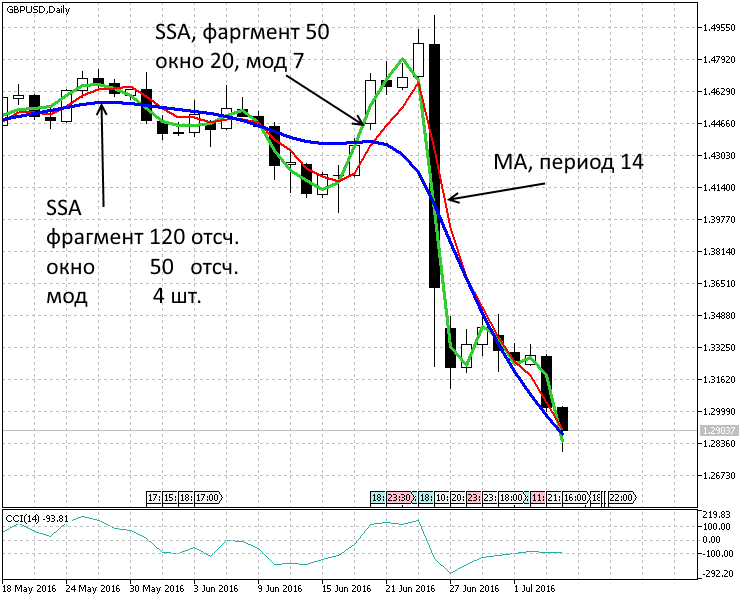
Fig. 3. Period of 1 day. Two trends SSA(120,50,4), SSA(50,20,7) and moving average MA(14)
The use of the singular analysis for the implementation of a trend indicator in this form is a basic illustration. Widespread use of the SSA methods in financial sector for the analysis and forecasting of time series is presented in [5-7].
References
- Elsner J.B., Tsonis A.A. Singular Spectrum Analysis: A New Tool in Time Series Analysis. Plenum Press. New York, 1996. 164 p.
- D. L. Danilov and A. A. Zhiglyavskii Principal Components in Time Series: the Caterpillar Method. St. Petersburg State Univ., St. Petersburg, 1997 -308 p.
- N. E. Golyandina The "Caterpillar"-SSA method: analysis of time series: Study Guide. St. Petersburg: 2004. - 76 p.
- Principal Components in Time Series: the Caterpillar Method, edited by D. L. Danilov, A. A. Zhigljavsky. St. Petersburg: Presskom, 1997. P. 308.
- Method of «Caterpillar»-SSA — ARIMA — SIGARCH and ARSIMA — SIGARCH model for the analysis and forecast of the financial and economic time series: Proceedings of the Second International Scientific Conference "Mathematical methods, models and information technology in economy", 4-6 May 2011, Chernivtsi. — P. 306—308.
- Kozhihova N.A., Shiryaev V.I. Time series forecasting using chaotic component. Bulletin of the South Ural State University, № 22, 2010, P. 22-25.
- A.M. Avdeenko Advisors and indicators based on the SSA models and non-linear generalizations // see. arXiv:
Tradotto dal russo da MetaQuotes Ltd.
Codice originale https://www.mql5.com/ru/code/15865
Volume_Weighted_MA_Cloud_Digit
The Volume_Weighted_MA indicator that fills the chart space with a colored background and displays the most recent value as a price label with the possibility to round the channel levels up to a required number of digits.
Volume_Weighted_MA_StDev_HTF
The Volume_Weighted_MA_StDev indicator with the timeframe selection option available in input parameters.
 Exp_Fisher_org_v1
The Exp_Fisher_org_v1 EA is based on the signals generated by the Fisher_org_v1 oscillator.
Fisher_org_v1_Sign
Semaphore arrow signal indicator based on the Fisher_org_v1 oscillator leaving the overbought and oversold areas.