Buy and Sell Zones MT5

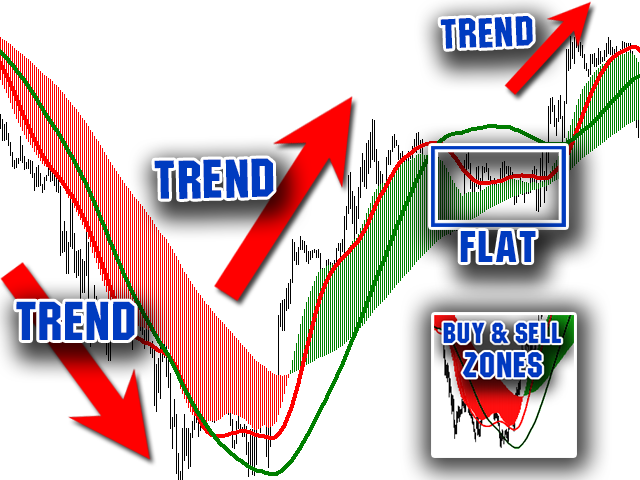
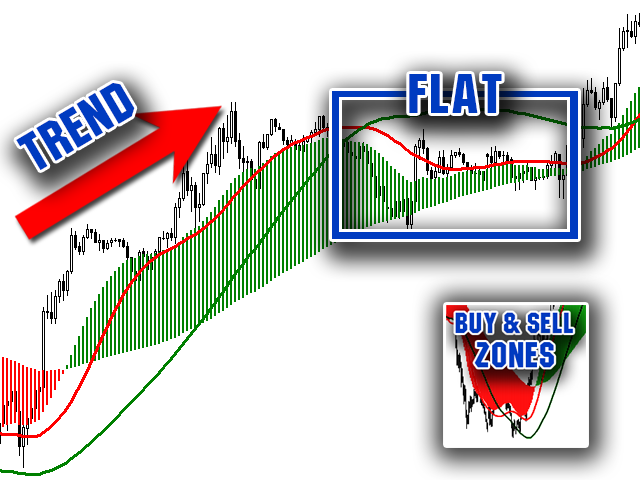
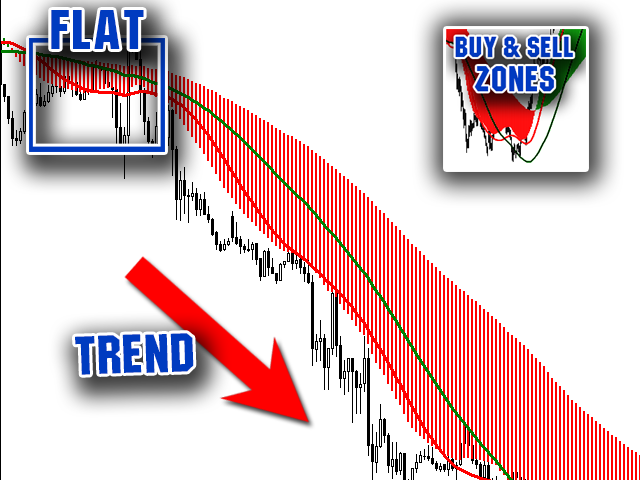
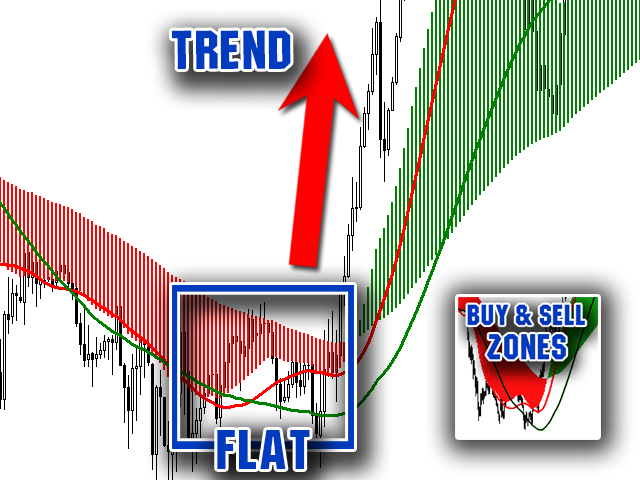
Indicateur pour déterminer plat et tendance.
Si le prix est inférieur à l'un des deux histogrammes et des deux lignes (rouge et bleu), il s'agit d'une zone de vente.

Lors de l'achat de cette version de l'indicateur, version MT4 pour un compte réel et un compte démo - en cadeau (pour recevoir, écrivez-moi un message privé) !

Si le prix est au-dessus de l'un des deux histogrammes et des deux lignes (rouge et bleue), il s'agit d'une zone d'achat.


Si le prix se situe entre deux lignes ou dans la zone de l'un des histogrammes, alors il n'y a pas de tendance définie sur le marché. Autrement dit, le marché est plat.

Le travail de l'indicateur est plus clairement montré dans les captures d'écran.
Produits recommandés
L'indicateur SMC Venom Model BPR est un outil professionnel pour les traders travaillant dans le concept Smart Money (SMC). Il identifie automatiquement deux modèles clés sur le graphique des prix: FVG   (Fair Value Gap) est une combinaison de trois bougies, dans laquelle il y a un écart entre la première et la troisième bougie. Forme une zone entre les niveaux où il n'y a pas de support de volume, ce qui conduit souvent à une correction des prix. BPR   (Balanced Price Range) est une combinaiso
Noize Absorption Index - is the manual trading system that measures the difference of pressure between bears forces and bulls forces. Green line - is a noize free index that showing curent situation. Zero value of index shows totally choppy/flat market.Values above zero level shows how powerfull bullish wave is and values below zero measures bearish forces.Up arrow appears on bearish market when it's ready to reverse, dn arrow appears on weak bullish market, as a result of reverse expectation.
Le niveau Premium est un indicateur unique avec une précision de plus de 80 % des prédictions correctes ! Cet indicateur a été testé par les meilleurs Trading Specialists depuis plus de deux mois ! L'indicateur de l'auteur que vous ne trouverez nulle part ailleurs ! À partir des captures d'écran, vous pouvez constater par vous-même la précision de cet outil ! 1 est idéal pour le trading d'options binaires avec un délai d'expiration de 1 bougie. 2 fonctionne sur toutes les paires de devises
RBreaker
Zhong Long Wu
RBreaker Gold Indicators est une stratégie de trading intraday à court terme pour les contrats à terme sur l'or, qui combine deux approches : le suivi de tendance et le retournement intraday. Elle permet non seulement de capturer les profits dans les marchés en tendance, mais aussi de prendre des bénéfices en temps opportun lors des retournements de marché et d'ouvrir une position en sens inverse. Cette stratégie a été classée pendant 15 années consécutives parmi les dix stratégies de trading l
Prime Power ML est un Currency Strength Meter avancé enrichi de deux modèles de réseaux neuronaux ONNX qui filtrent les signaux par probabilité de gain avant de les afficher. Contrairement aux indicateurs CSM traditionnels qui affichent chaque divergence entre devises, Prime Power ML ne met en évidence que les signaux où l'AI confirme un avantage statistique. Comment ça fonctionne L'indicateur calcule en temps réel la force de 8 devises principales (USD, EUR, GBP, JPY, AUD, CAD, CHF, NZD) en uti
Indicateur unique qui met en œuvre une approche professionnelle et quantitative pour signifier le trading de réversion. Il capitalise sur le fait que le prix dévie et revient à la moyenne de manière prévisible et mesurable, ce qui permet des règles d'entrée et de sortie claires qui surpassent largement les stratégies de trading non quantitatives. [ Installation Guide | Update Guide | Troubleshooting | FAQ | All Products ] Des signaux de trading clairs Étonnamment facile à échanger Couleurs et t
Monitor your order
Eslam Mohamed Hassanein Hassan Aly
Advanced Lot & Profit Monitor PRO is a powerful MT5 indicator that provides real-time monitoring of your trading positions directly on the chart. It displays the number of orders, total lot sizes, and profit (including swap) for Buy and Sell positions separately, as well as the overall account performance. Designed with a clean and customizable interface, this tool helps traders stay in control of their exposure and risk at all times. Key Features: Real-time monitoring of open positions Sepa
HMA Trend Professional MT5
Pavel Zamoshnikov
4.25 (4)
Improved version of the free HMA Trend indicator (for MetaTrader 4) with statistical analysis. HMA Trend is a trend indicator based on the Hull Moving Average (HMA) with two periods. HMA with a slow period identifies the trend, while HMA with a fast period determines the short-term movements and signals in the trend direction. The main differences from the free version: Ability to predict the probability of a trend reversal using analysis of history data. Plotting statistical charts for analyzi
Max Min Delta Indicator - Market Volume Imbalance Analysis Gain Deeper Insights into Market Volume Imbalance with Delta Analysis What is the Max Min Delta Indicator? The Max Min Delta Indicator is a powerful market volume analysis tool that visually represents maximum and minimum delta values using a histogram. It helps traders identify market strength, weakness, absorption, and aggressive buying/selling activity with precision. Key Features Histogram Visualization: Displays Max Delta (Green) an
Price manipulation risk
Vincent Albert Feugier
Price Manipulation Risk Indicator Outil Avancé d’Évaluation du Risque & de Détection de Manipulation Price Manipulation Risk Indicator est un indicateur professionnel conçu pour mesurer le niveau de risque présent sur le marché . Il analyse le comportement du prix, l’activité du marché et la dynamique des bougies afin d’identifier les phases instables ou potentiellement manipulées. Cet outil aide le trader à éviter les pièges , filtrer les faux signaux , et améliorer son timing d’entrée et
Was: $249  Now: $99   Market Profile defines a number of day types that can help the trader to determine market behaviour. A key feature is the Value Area, representing the range of price action where 70% of trading took place. Understanding the Value Area can give traders valuable insight into market direction and establish the higher odds trade. It is an excellent addition to any system you may be using. Inspired by Jim Dalton’s book “Mind Over Markets”, this indicator is designed to suit the
MultiTimeframe Support and Resistance Zones
Mohamed Gamal Abdelnasser Yous Hashesh
A powerful indicator that highlights key market zones and helps traders identify potential opportunities across multiple timeframes. Designed for clarity and efficiency, it provides real-time alerts to keep you informed of important price levels. Key Features: Works on multiple timeframes: M1, M5, M15, M30, H1, H4, D1, W1, MN1. Customizable zone colors for each timeframe. Real-time alerts and notifications when price reaches significant zones. Automatically manages chart objects to keep your wor
Volume Profile V6
Andrey Kolesnik
4.67 (3)
Indicateur de profil de volume de marché + oscillateur intelligent. Fonctionne sur pratiquement tous les instruments — paires de devises, actions, futures, crypto-monnaies, sur volumes réels et sur ticks. Il est possible de configurer la définition automatique de la plage de construction du profil (par exemple, pour une semaine ou un mois, etc.), ou de définir la plage manuellement en déplaçant les limites (deux lignes verticales : rouge et bleue). L'affichage se fait sous forme d'histogramme. L
Price Magnet — Price Density and Attraction Levels Indicator Price Magnet is a professional analytical tool designed to identify key support and resistance levels based on statistical Price Density. The indicator analyzes a specified historical period and detects price levels where the market spent the most time. These zones act as “magnets,” attracting price action or forming a structural base for potential reversals. Unlike traditional Volume Profile tools, Price Magnet focuses on price-time d
Divergent Stochastic Filter II Catch Reversals Early, Filter Noise, Trade with Confidence The Edge: Why This Stochastic is Different  Every trader knows the Stochastic oscillator. But knowing when to trust its signals, that's the real challenge. The Divergent Stochastic Filter II transforms this classic indicator into a precision reversal detection system by adding critical elements: divergence intelligence, signal filtering and exhaustion detection.  While standard Stochastic oscillators fire s
CosmiCLab SMC FIBO CosmiCLab SMC FIBO is a professional trading indicator designed for traders who use Smart Money Concepts (SMC), market structure analysis and Fibonacci retracement levels. The indicator automatically detects market swings and builds Fibonacci levels based on the latest impulse movement. It also identifies market structure changes such as BOS (Break of Structure) and CHOCH (Change of Character), helping traders understand the current market direction. CosmiCLab SMC FIBO also pr
# DRAWDOWN INDICATOR V4.0 - L'Outil Essentiel pour Maîtriser Votre Trading ## Transformez Votre Trading avec une Vision Complète de Vos Performances en Temps Réel Dans le monde exigeant du trading Forex et CFD, **connaître vos performances en temps réel** n'est pas un luxe, c'est une **nécessité absolue**. Le **Drawdown Indicator V4.0** est bien plus qu'un simple indicateur : c'est votre **tableau de bord professionnel** qui vous donne une vision claire, précise et instantanée de l'état de vo
Fibo Channels
Jeffrey Quiatchon
Fibo Daily Channel Indicator The  Indicator is a powerful tool for traders, providing precise daily support and resistance levels based on Fibonacci retracement and extension calculations. This indicator automatically draws key pivot points (PP, R1, R2, S1, S2) as well as additional extension levels (R3, R4, S3, S4), helping traders identify potential reversal and breakout zones with ease. It includes customizable alerts and push notifications, allowing traders to receive updates whenever the pr
Pro Gold System Indicator
PEDRO JOAQUIM GONCALVES GOMES
ADVANCED FUNCTIONALITIES: Trend Score (0-100) with visual bar Intelligent signals with adjustable strength (1-10) Risk management with automatic TP/SL Audible and visual alerts Price zones with smooth filling Multi-indicator analysis (RSI, ATR, BB, EMAs) DESIGN FEATURES Modern Visual: Smooth and well-spaced lines (EMA with 2-3px width) Vibrant and professional colors (Sky Blue, Orange, Gold) Modern arrows (code 233/234) for buy/sell signals Configurable dark/light theme Adjustable transparency f
Your Trend Friend
Luigi Nunes Labigalini
5 (1)
The trend is your friend! Look at the color of the indicator and trade on that direction. It does not  repaint. After each candle is closed, that's the color of the trend. You can focus on shorter faster trends or major trends, just test what's most suitable for the symbol and timeframe you trade. Simply change the "Length" parameter and the indicator will automatically adapt. You can also change the color, thickness and style of the lines. Download and give it a try! There are big movements w
Trade smarter, not harder: Empower your trading with Harmonacci Patterns This is arguably the most complete harmonic price formation auto-recognition indicator you can find for the MetaTrader Platform. It detects 19 different patterns, takes fibonacci projections as seriously as you do, displays the Potential Reversal Zone (PRZ) and finds suitable stop-loss and take-profit levels. [ Installation Guide | Update Guide | Troubleshooting | FAQ | All Products   |  Get Help ] It detects 19 differen
Introduction to the Manual Backtesting Indicator on MQL5 The MetaTrader platform provides an excellent backtesting tool for evaluating Expert Advisors (EAs). However, when it comes to manually backtesting a strategy to assess its effectiveness, this tool has some limitations: You cannot manually draw zones or trend lines while in backtesting mode. You cannot switch timeframes to check time alignment. For example, if my strategy requires additional confirmation from a higher timeframe (HTF), this
PipFinite Exit EDGE MT5
Karlo Wilson Vendiola
4.88 (32)
Did You Have A Profitable Trade But Suddenly Reversed? In a solid strategy, exiting a trade is equally important as entering. Exit EDGE helps maximize your current trade profit and avoid turning winning trades to losers. Never Miss An Exit Signal Again Monitor all pairs and timeframes in just 1 chart www.mql5.com/en/blogs/post/726558 How To Trade You can close your open trades as soon as you receive a signal Close your Buy orders if you receive an Exit Buy Signal. Close your Sell orders if
STRICTLY FOR BOOM INDEX ONLY!!!!! Here I bring the Maximum Trend Arrows OT1.0 MT5 indicator. This indicator is made up of a combination of different trend indicators for entries and exits, for entries an orange arrow will paint on the chart below the current market and a red flag for closing of trades and it produces buy arrows only. When the orange arrow appears, it will appear along with it's sound to notify you. The 1H timeframe is recommended, don't use it anywhere else than on the 1H timefr
TRI Visualizer
Yoshimi Mon 三 Ura
TRI Visualizer MT5 – Thermodynamic Market Analysis Overview The TRI (Thermal Range Indicator) Visualizer Enhanced is a rare market analysis indicator that goes beyond conventional technical analysis, applying principles of thermodynamics from physics. It interprets market price fluctuations as “thermodynamic energy,” enabling the highly accurate detection of subtle market changes that are often overlooked. Innovative Mechanisms 1. Dual Calculation Engines Classic TRI Mode Formula: |Close
Caicai L&S Yield Histogram Important Notice: This indicator is an integral tool of the automated EA Caicai Long and Short Pair Trading . This indicator visually displays the percentage deviation (Yield %) of a pair's current spread relative to its own historical mean. It is an excellent tool for quickly visualizing the gross financial potential of a market distortion in Long & Short operations. Main Features: Percentage Visualization: Understand the size of the distortion in palpable percentage
L'indicateur DYJ BoS identifie et marque automatiquement les éléments essentiels des changements de structure du marché, notamment : Rupture de structure (BoS) : détectée lorsque le prix effectue un mouvement significatif, franchissant un point de structure précédent. Il marque les lignes de tendance haussière et baissière possibles (UP & DN, c'est-à-dire de nouveaux sommets et de nouveaux creux continus), et une fois que le prix franchit ces lignes, il marque des flèches rouges (BEAR) et ver
Gioteen Volatility Index (GVI) - your ultimate solution to overcoming market unpredictability and maximizing trading opportunities. This revolutionary indicator helps you in lowering your losing trades due to choppy market movements. The GVI is designed to measure market volatility, providing you with valuable insights to identify the most favorable trading prospects. Its intuitive interface consists of a dynamic red line representing the volatility index, accompanied by blue line that indicate
JONUX TPO Market Profile — Professional Market Structure Analysis Ever look at a chart and wonder: where does price actually want to go? Most indicators tell you what price did . JONUX TPO Market Profile shows you where the market spent its time — and where it didn't. The difference matters more than most traders realise. Every trading session, institutions leave behind a structural map: price levels they accepted, levels they rejected, and gaps they'll almost certainly return to. JONUX TPO rea
Crash 1000 Scalping Indicator for the Crash 1000 Deriv Synthetic Index. Introduction The Crash 1000 Scalping Indicator is a specialized tool designed for the Crash 1000 index on the Deriv Synthetic market. This indicator is particularly useful for scalping on the M1 timeframe, helping traders to identify precise entry and exit points for buy positions. It is designed to be non-repainting, providing clear signals with audible alerts and push notifications, and is compatible with mobile devices th
Les acheteurs de ce produit ont également acheté
Divergence Bomber
Ihor Otkydach
4.9 (86)
Chaque acheteur de cet indicateur reçoit également gratuitement : L’outil exclusif « Bomber Utility », qui accompagne automatiquement chaque opération de trading, fixe les niveaux de Stop Loss et de Take Profit, et clôture les positions selon les règles de la stratégie Des fichiers de configuration (set files) pour adapter l’indicateur à différents actifs Des set files pour configurer le Bomber Utility selon différents modes : « Risque Minimum », « Risque Équilibré » et « Stratégie d’Attente » U
Entry In The Zone and SMC Multi Timeframe is a real-time 2-in-1 market analysis tool that combines market structure analysis and a No Repaint BUY / SELL signal system into a single indicator, built on Smart Money Concepts (SMC) — a widely adopted framework used by professional traders to understand market structure. This indicator helps you see the market more clearly, make decisions based on structure rather than guesswork, and focus on high-probability zones where price is more likely to react
Azimuth Pro
Ottaviano De Cicco
5 (6)
Azimuth Pro V2: Synthetic Fractal Structure and Confirmed Entries for MT5 Overview Azimuth Pro is a multi-level swing structure indicator by Merkava Labs . Four nested swing layers, swing-anchored VWAP, ABC pattern detection, three-timeframe structural filtering, and closed-bar confirmed entries — one chart, one workflow from micro-swings to macro-cycles. This is not a blind signal product. It is a structure-first workflow for traders who care about location, context, and timing. V2 Launch Offe
Quantum TrendPulse
Bogdan Ion Puscasu
5 (23)
Présentation de   Quantum TrendPulse   , l'outil de trading ultime qui combine la puissance de   SuperTrend   ,   RSI   et   Stochastic   dans un seul indicateur complet pour maximiser votre potentiel de trading. Conçu pour les traders qui recherchent précision et efficacité, cet indicateur vous aide à identifier les tendances du marché, les changements de dynamique et les points d'entrée et de sortie optimaux en toute confiance. Caractéristiques principales : Intégration SuperTrend :   suivez f
Si vous achetez cet indicateur, vous recevrez mon Gestionnaire de Trading Professionnel + EA  GRATUITEMENT. Tout d'abord, il convient de souligner que ce système de trading est un indicateur non repeint, non redessiné et non retardé, ce qui le rend idéal pour le trading manuel et automatisé. Cours en ligne, manuel et téléchargement de préréglages. Le "Système de Trading Smart Trend MT5" est une solution de trading complète conçue pour les traders débutants et expérimentés. Il combine plus de 10
OmniSync Projection
Antonio-alin Teculescu
5 (1)
Chronos Fractal Engine is an innovative price projection indicator for MetaTrader 5, designed to transform your technical analysis by intelligently identifying and projecting historical price patterns. Built upon an advanced correlation algorithm and the fractal principles of the market, this powerful tool visualizes potential future price movements, giving you a unique edge in your trading decisions. What is Chronos Fractal Engine? At its core, the Chronos Fractal Engine employs a sophisticat
FX Trend MT5 NG
Daniel Stein
5 (4)
FX Trend NG : La Nouvelle Génération d’Intelligence de Tendance Multi-Marchés Vue d’ensemble FX Trend NG est un outil professionnel d’analyse de tendance multi-timeframe et de surveillance des marchés. Il vous permet de comprendre la structure complète du marché en quelques secondes. Au lieu de naviguer entre de nombreux graphiques, vous identifiez immédiatement quels instruments sont en tendance, où le momentum s’affaiblit et où plusieurs unités de temps sont alignées. Offre de Lancement – Ob
Présentation       Quantum Breakout PRO   , l'indicateur révolutionnaire MQL5 qui transforme la façon dont vous négociez les zones d'évasion ! Développé par une équipe de traders expérimentés avec une expérience commerciale de plus de 13 ans,       Évasion quantique PRO       est conçu pour propulser votre parcours commercial vers de nouveaux sommets grâce à sa stratégie de zone de discussion innovante et dynamique. Quantum Breakout Indicator vous donnera des flèches de signalisation sur les z
CGE Trading Suite
Carl Gustav Johan Ekstrom
5 (2)
Institutional-Grade Analytics for MT5 C GE Trading Suite delivers the analytical edge typically reserved for professional trading desks. The platform integrates a full suite of analytical tools into one seamless workflow: dynamic grid mapping, liquidity behavior analysis, ECM, trend lines, MIDAS, trade cycles, and directional channel projections. Together, these provide a unified view of market structure and momentum. Directional clarity is further enhanced by the capital flow index, which meas
Voyez quelle strategie fonctionne reellement sur votre symbole - avant de risquer de l'argent reel. Power Bar detecte les barres de prix extremes sur n'importe quel symbole et n'importe quel timeframe, puis backteste instantanement 3 strategies de trading differentes pour que vous puissiez comparer les taux de reussite, les facteurs de profit et les P&L cote a cote. Le tout dans un seul panneau interactif. Pas de suppositions. Pas de suroptimisation. Juste des donnees. Qu'est-ce qui rend Power
Grabber System MT5
Ihor Otkydach
4.83 (23)
Je vous présente un excellent indicateur technique : Grabber, qui fonctionne comme une stratégie de trading "tout-en-un", prête à l'emploi. En un seul code sont intégrés des outils puissants d'analyse technique du marché, des signaux de trading (flèches), des fonctions d'alerte et des notifications push. Chaque acheteur de cet indicateur reçoit également gratuitement : L'utilitaire Grabber : pour la gestion automatique des ordres ouverts Un guide vidéo étape par étape : pour apprendre à installe
Atomic Analyst MT5
Issam Kassas
3.94 (31)
Tout d'abord, il convient de souligner que cet indicateur de trading n'est ni repainting, ni redrawing et ne présente aucun délai, ce qui le rend idéal à la fois pour le trading manuel et automatisé. Manuel de l'utilisateur : réglages, entrées et stratégie. L'Analyste Atomique est un indicateur d'action sur les prix PA qui utilise la force et le momentum du prix pour trouver un meilleur avantage sur le marché. Équipé de filtres avancés qui aident à éliminer les bruits et les faux signaux, et à
FX Power MT5 NG
Daniel Stein
5 (31)
FX Power : Analysez la force des devises pour des décisions de trading plus intelligentes Aperçu FX Power est l'outil essentiel pour comprendre la force réelle des principales devises et de l'or, quelles que soient les conditions du marché. En identifiant les devises fortes à acheter et les faibles à vendre, FX Power simplifie vos décisions de trading et révèle des opportunités à forte probabilité. Que vous suiviez les tendances ou anticipiez les retournements à l'aide de valeurs extrêmes de D
Bill Williams Advanced
Siarhei Vashchylka
5 (11)
Bill Williams Advanced is designed for automatic chart analysis using Bill Williams' "Profitunity" system. The indicator analyzes four timeframes at once. Manual (Be sure to read before purchasing) Advantages 1. Analyzes the chart using Bill Williams' "Profitunity" system. Signals are displayed in a table in the corner of the screen and on the price chart. 2. Finds all known AO and AC signals, as well as zone signals. Equipped with a trend filter based on the Alligator. 3. Finds "Divergence Bar
Btmm state engine pro
Garry James Goodchild
5 (4)
BTMM State Engine Pro is a MetaTrader 5 indicator for traders who use the Beat The Market Maker approach: Asian session context, kill zone timing, level progression, peak formation detection, and a multi-pair scanner from a single chart. It combines cycle state logic with a built-in scanner dashboard so you do not need the same tool on many charts at once. What it does Draws the Asian session range; session times can follow broker server offset or be set in inputs. Tracks level progression (L
SignalTech MT5 is a trading system for EURUSD, USDCHF, USDJPY, AUDUSD, NZDUSD, EURJPY, AUDJPY, NZDJPY, CADJPY H2 and H3 Timeframe.  It can generate signals with Buy/Sell Arrows and Pop-Up/Sound Alerts. Each signal has clear Entry and Stop Loss levels, which should be automatically flagged on the chart, as well as potential Targets 1, 2, and 3. The Entry and TP levels are fixed after the trade is taken. The exit level is dynamic. If there are signs of a potential short-term trend reversal, the
Berma Bands
Muhammad Elbermawi
5 (8)
L'indicateur Berma Bands (BB) est un outil précieux pour les traders qui cherchent à identifier et à capitaliser sur les tendances du marché. En analysant la relation entre le prix et les BB, les traders peuvent déterminer si un marché est dans une phase de tendance ou de range. Visitez le [ Berma Home Blog ] pour en savoir plus. Les bandes de Berma sont composées de trois lignes distinctes : la bande de Berma supérieure, la bande de Berma moyenne et la bande de Berma inférieure. Ces lignes sont
Meridian Pro
Ottaviano De Cicco
5 (1)
Meridian Pro: Professional Multi-Timeframe Trend Matrix for MT5 Overview Meridian Pro is a multi-timeframe trend matrix by Merkava Labs that compresses directional state, strength, momentum condition and matrix agreement into one compact panel. One adaptive engine, applied consistently from M1 to W1. No per-symbol tuning. No indicator stacking. One structured readout across every asset and every timeframe. Launch Offer — Get Meridian Pro for USD 99 (introductory). Regular price: USD 149. 1. Why
ARICoins
Temirlan Kdyrkhan
ARICoin is a powerful trading companion designed to generate high-probability entry signals with dynamic TP/SL/DP levels based on volatility. Built-in performance tracking shows win/loss stats, PP1/PP2 hits, and success rates all updated live. Key Features: Buy/Sell signals with adaptive volatility bands Real-time TP/SL/DP levels based on ATR Built-in MA Filter with optional ATR/StdDev volatility Performance stats panel (Success, Profit/Loss, PP1/PP2) Alerts via popup, sound, push, or email Cust
La Master Edition est un outil d'analyse de qualité professionnelle conçu pour visualiser la structure du marché à travers le prisme du volume et du flux monétaire. Contrairement aux indicateurs de volume standard, cet outil affiche un Profil de Volume Quotidien directement sur votre graphique, vous permettant de voir exactement où la découverte des prix a eu lieu et où est positionné "l'argent intelligent". Cette Master Edition est conçue pour la clarté et la rapidité, dotée d'un système unique
Gartley Hunter Multi
Siarhei Vashchylka
5 (11)
Gartley Hunter Multi - An indicator for searching for harmonic patterns simultaneously on dozens of trading instruments and on all possible timeframes. Manual (Be sure to read before purchasing) | Version for MT4 Advantages 1. Patterns: Gartley, Butterfly, Shark, Crab. Bat, Alternate Bat, Deep Crab, Cypher 2. Simultaneous search for patterns on dozens of trading instruments and on all possible timeframes 3. Search for patterns of all possible sizes. From the smallest to the largest 4. All fou
RelicusRoad Pro : Système d'Exploitation Quantitatif du Marché 70% DE RÉDUCTION ACCÈS À VIE (DURÉE LIMITÉE) - REJOIGNEZ 2 000+ TRADERS Pourquoi la plupart des traders échouent-ils même avec des indicateurs "parfaits" ? Parce qu'ils tradent des concepts isolés dans le vide. Un signal sans contexte est un pari. Pour gagner, il faut de la CONFLUENCE . RelicusRoad Pro est un Écosystème Quantitatif complet . Il cartographie la "Fair Value Road", distinguant le bruit des cassures structurelles. Arrête
FX Volume MT5
Daniel Stein
4.79 (24)
FX Volume : Découvrez le Sentiment du Marché tel que perçu par un Courtier Présentation Rapide Vous souhaitez faire passer votre approche de trading au niveau supérieur ? FX Volume vous fournit, en temps réel, des informations sur la manière dont les traders particuliers et les courtiers sont positionnés—bien avant la publication de rapports retardés comme le COT. Que vous visiez des gains réguliers ou recherchiez simplement un avantage plus solide sur les marchés, FX Volume vous aide à repére
Tout d'abord, il convient de souligner que cet outil de trading est un indicateur non repeint, non redessiné et non retardé, ce qui le rend idéal pour le trading professionnel. Cours en ligne, manuel utilisateur et démonstration. L'indicateur Smart Price Action Concepts est un outil très puissant à la fois pour les nouveaux et les traders expérimentés. Il regroupe plus de 20 indicateurs utiles en un seul, combinant des idées de trading avancées telles que l'analyse du trader Inner Circle et le
Weltrade Spike Sentinel
Batsirayi L Marango
5 (1)
Introducing Indicator for PainX and GainX Indices Traders on Weltrade Get ready to experience the power of trading with our indicator, specifically designed for Weltrade   broker's PainX and GainX Indices.  Advanced Strategies for Unbeatable Insights Our indicator employs sophisticated strategies to analyze market trends, pinpointing optimal entry and exit points.  Optimized for Maximum Performance To ensure optimal results, our indicator is carefully calibrated for 5-minute timeframe charts on
Blahtech Supply Demand MT5
Blahtech Limited
4.54 (13)
Was: $299  Now: $99  Supply Demand uses previous price action to identify potential imbalances between buyers and sellers. The key is to identify the better odds zones, not just the untouched ones. Blahtech Supply Demand indicator delivers functionality previously unavailable on any trading platform. This 4-in-1 indicator not only highlights the higher probability zones using a multi-criteria strength engine, but also combines it with multi-timeframe trend analysis, previously confirmed swings a
Ce tableau de bord découvre et affiche les zones   d'offre   et de   demande   sur le graphique, à la fois en mode scalping et à long terme, en fonction de votre stratégie de trading pour les symboles sélectionnés. En outre, le mode scanner du tableau de bord vous permet de vérifier tous les symboles souhaités en un coup d'œil et de ne manquer aucune position appropriée /   Version MT4 Indicateur gratuit:   Basic Supply Demand Caractéristiques Permet de visualiser les opportunités de tradin
Currency Strength Dashboard Pro Tableau de bord professionnel d’ analyse de la force des devises en temps réel pour MetaTrader 5 . L’indicateur calcule et affiche la force de 8 devises majeures (EUR, USD, GBP, JPY, CHF, AUD, CAD, NZD) en utilisant 28 paires de devises simultanément sur plusieurs unités de temps. Le tableau de bord offre au trader une vision complète du marché en un seul coup d’œil — sans calculs supplémentaires ni changement entre plusieurs graphiques. Méthode de calcul L’indica
L'indicateur « Dynamic Scalper System MT5 » est conçu pour la méthode de scalping, permettant de trader au sein des vagues de tendance. Testé sur les principales paires de devises et l'or, il est compatible avec d'autres instruments de trading. Fournit des signaux pour l'ouverture de positions à court terme le long de la tendance, avec un support supplémentaire pour les fluctuations de prix. Principe de l'indicateur : De grandes flèches déterminent la direction de la tendance. Un algorithme de
RFI levels PRO MT5
Roman Podpora
3.67 (3)
L'indicateur montre avec précision les points de retournement et les zones de retour des prix où le       Acteurs majeurs   . Vous repérez les nouvelles tendances et prenez des décisions avec une précision maximale, en gardant le contrôle de chaque transaction. VERSION MT4     -    Révèle son potentiel maximal lorsqu'il est combiné à l'indicateur   TREND LINES PRO Ce que l'indicateur montre : Structures et niveaux d'inversion avec activation au début d'une nouvelle tendance. Affichage des nivea
Plus de l'auteur
TickCounter MT5
Evgeniy Zhdan
5 (1)
L'indicateur TickCounter compte les ticks de haut en bas sur chaque nouvelle barre. Le calcul commence à partir du moment où l'indicateur est placé sur le graphique. Les barres d'histogramme représentent : Barres jaunes - nombre total de ticks ; Barres bleues - ticks UP ; Barres rouges - coches vers le BAS. Si la barre bleue n'est pas visible, il y a plus de graduations vers le bas et la barre rouge s'affiche au-dessus de la bleue (la couche rouge est au-dessus de la bleue). MT4 version:  htt
Divergence indicator 10 different indicators. Finding and displaying classic and hidden divergences. Indicators in which divergences are searched: MACD MACD Histogram; RSI; Stochastic; CCI; momentum; OBV; VWmacd; Chaikin Money Flow; Money Flow Index. This is a replica of the indicator from the   tradingview   resource, adapted for the MT5 terminal. MT4 version available here:  https://www.mql5.com/en/market/product/87846 Settings: Bars in history for analysis - number of bars for analysis; D
Dual View HTF Patterns Pro est un outil analytique de haut niveau conçu pour les traders manuels s'appuyant sur le Price Action et l'analyse multi-temporelle. Il résout efficacement le problème de la « vision en tunnel » en vous permettant de surveiller la structure du marché et les modèles de bougies des unités de temps supérieures (HTF) directement sur votre graphique d'exécution habituel. MT4-version:   https://www.mql5.com/en/market/product/166824 Pourquoi avez-vous besoin de cet indicateur
Buy and sell zones
Evgeniy Zhdan
5 (2)
Indicator for determining flat and trend. If the price is below any of the two histograms and two lines (red and blue), this is a sell zone. When purchasing this version of the indicator, MT5 version for one real and one demo account - as a gift (to receive, write me a private message)! If the price is above any of the two histograms and two lines (red and blue), this is a buy zone. MT5 version:  https://www.mql5.com/en/market/product/70409 If the price is between two lines or in the zone of
SuperTrend
Evgeniy Zhdan
2.5 (2)
The Supertrend Expert Advisor The Supertrend Expert Advisor with averaging elements. It has been developed during three months until I finally got good results. It is not a scalper. The minimum balance to start trading - 100 $. Is automatically adjusted to the 4 and 5-digit prices. Has an efficient risk management system. The lot and limit on the maximum lot is automatically calculated based on the settings specified in the EA. As a result, you have a complete automated trading system. Download
Stardust
Evgeniy Zhdan
StarDust searches for divergences in the values of several indicators considering them as signs of flat and enters the market if a relatively steady trend is detected. The Expert Advisor trades "basic" symbols with a low spread. The best results are achieved on М15. The EA automatically adjusts to 4 and 5-digit quote flows. Settings Comment_to_orders – comment to a placed order. The field can be left blank if no comment is required. MM – enable money management with automatic setting of a worki
Top Floor
Evgeniy Zhdan
The EA catches the price when it moves against the trend in an effort to open an order in an opposite direction (direction of the main trend). Screenshots illustrate examples of entries and the strategy gist. The EA uses stop losses depending on values of ATR. Settings: Lot_ - if Risk_ = 0, the EA will trade this lot; Risk_ - risk per one trade. Stop loss is taken into account; koeff_ATR - coefficient multiplied by the ATR value to calculate stop loss (the bigger the value, the bigger stop loss
FastBoom
Evgeniy Zhdan
The FastBoom EA finds the most probable points of price pullback/reverse and places an order. It places averaging orders if the price moves further against take profit. Settings of the EA: Lots - initial lot; LotExponent - multiplier for following orders (Martingale). 1 - no multiplier. TakeProfit - take profit in points; Stochastic Settings InpKPeriod - K Period of Stochastic InpDPeriod - D Period of Stochastic InpSlowing - Stochastic Slowing LevHigh - level for sell positions of Stochastic L
The Expert Advisor calculates the double/triple divergence of volumes, and starts trading. It uses a unique formula of lot calculation, which greatly improves stability of trading. Recommended TF - 1h. Currency pair - EURUSD , but the EA can be used on any trading instruments which are not subject to high volatility. Settings mode - trading direction can be set manually; close - order close level (details on the screenshot); Step between orders - step between orders in points; Maximum orders -
OrderOnLine
Evgeniy Zhdan
The Expert Advisor opens orders from the horizontal line, the a trader can set on any level by dragging using the mouse or by changing the line properties. For example, when a horizontal line is above the current price, the EA will open a Buy order once the horizontal line is reached. And vice versa: If the line is below the current price, the EA will open a sell order once the line is crossed. A buy crossover of the line is: opening of the current candlestick below the horizontal line; the curr
SellerATR
Evgeniy Zhdan
5 (1)
The Expert Advisor only sells. Recommended currency pairs : EURUSD; GBPUSD; USDCHF; USDJPY; USDCAD; AUDUSD; EURGBP; EURAUD; EURCHF; EURJPY; GBPCHF; CADJPY; GBPJPY; AUDNZD; AUDCAD; AUDCHF; AUDJPY; CHFJPY; EURNZD; EURCAD; CADCHF; NZDJPY; NZDUSD. Timeframe: H1. Percent% manages closing both loss-making and profitable deals based on the account overall status. Using the EA on 23 symbols mentioned above allows the robot to cope with the drawdown in case of a long trend. While positions on some pairs
Illusion
Evgeniy Zhdan
3 (2)
The Illusion EA uses the probability theory - after a series of consecutive virtual losses - i.e. right during a flat the EA already starts trading in the trend. In addition, the EA considers the ratio of bullish/bearish candles on the higher timeframes to determine the greatest probability of the price movement direction. Only 1 order can be opened at a time. In case of a loss the following order will be placed with an increased lot (the multiplication coefficient is set in the parameters). The
L'indicateur calcule les zones d'arrêt / d'inversion de tendance les plus probables, les zones de mouvement de tendance confiantes. Le calcul considère : le taux de variation des prix ; l'angle de déviation relative de la carte ; l'amplitude moyenne des mouvements de prix ; le prix sortant de sa « zone de confort » ; les valeurs de l'indicateur ATR. L'indicateur peut générer une alerte lorsque le prix entre dans une zone d'arrêt/d'inversion. Paramètres Dessiner toute la longueur ? - tracer l
The indicator plots a trend line and determines the levels for opening trades, in case the price goes "too far" away from the trend level. More detailed information is available in the screenshots. Settings Away from the trend line - distance from the trend line to the trades level; Arrow Signal for deals - enable displaying an arrow when the price reaches the trades level; Size of Arrow - size of the arrow; Alert Signal for deals - enable generating alerts when the price reaches the trades lev
Turbina
Evgeniy Zhdan
5 (4)
The axiom of the Forex market is that any trend will be broken. The Expert Advisor determines trend direction (the pink line), and calculates levels for opening opposite orders depending on the settings. The value of Away from the trend line for Deal will be different for each pair and timeframe, depending on the volatility of the trading instrument. Next orders can be opened with an increased lot (a static lot is used by default). See the screenshots to understand the idea of the Expert Advisor
Odysseus
Evgeniy Zhdan
The Expert Advisor determines the moments of strong movements and opens a position in the direction of the most probable price movement. The strategy always uses stop loss and take profit. Several independent orders can be in the market (the maximum number is set in parameters). The goal of the EA's underlying trading system is the quantitative excess of the number of profitable deals over the number of losing ones. Recommended: EURUSD 5m; GBPUSD 5m; USDJPY 5m. The Expert Advisor is able to work
Vise
Evgeniy Zhdan
Vise is a trend indicator. The upper and lower lines follow the price showing the prevailing price direction. Frequent breakthroughs of the upper line indicate a bullish trend, while frequent breakthroughs of the lower line indicate a bearish one. Parameters Points for UpLine - initial number of points for the upper line; Points for DownLine - initial number of points for the lower line. During the breakthrough of the upper level (line), this level shifts upwards by Points for UpLine. If the up
Twinkle
Evgeniy Zhdan
Twinkle is a trend-based scalper using stop loss and take profit invisible to the broker. The EA does not look for trend reversals. The EA catches strong market movements and opens orders in the direction of the trend. Your broker will not see the order closing levels. The EA closes orders independently when reaching the take profit or stop loss levels specified in the settings. Recommended trading symbols: EURUSD M5, GBPUSD M5. ECN accounts with 5 digits quotes are recommended. Expert Advisor
Shine
Evgeniy Zhdan
4.75 (4)
This Expert Advisor implements elements of the Martingale system. Orders are opened at a specified distance from the moving average. The Parabolic SAR indicator and certain technical details are used to ensure the most accurate entries. The EA is highly customizable. It is recommended for simultaneous use on 4 currency pairs: EURUSD M15; GBPUSD M15; USDJPY M15; USDCAD M15. Despite good stability, it is advisable to disable the EA operation during the days rich in news releases. Configurations P
LuckyCase
Evgeniy Zhdan
LuckyCase is an Expert Advisor with martingale elements. The EA strategy is based on a significant "deviation" of the price from SAR inadicator and the Bands levels breakthrough point. The money management system is an essential part of the EA. It starts working after a trade is opened. Trades are closed after accumulating specified points of market orders, by deposit % or after an opposite side of the channel is broken through. The default EA settings are meant for: EURUSD M15; USDJPY M15. The
Elize
Evgeniy Zhdan
The Elize Expert Advisor has been designed to work with the EURCHF currency pair. It considers the peculiarities of this trading instrument, its behavior and dependence on the behavior of other currencies. In particular, when the currencies of the European countries (EURUSD, GBPUSD, EURNOK, EURCHF) move in the same direction, the EA starts its operation and opens a deal in the trend direction of the European currencies. In the event of price rollbacks, the EA uses a unique method for making the
AllTrendLines
Evgeniy Zhdan
4 (1)
Brief Description of the All Trend Lines Indicator The indicator analyzes the wave structure of the market. What it displays on the chart: First. Wave pivots (semaphores) • Red markers – wave highs • Yellow markers – wave lows • Yellow-green markers – additional local extremes Second. Trend lines • Purple/blue lines – trends based on highs (resistance/support) • Beige/green lines – trends based on lows • Lines are built automatically by connecting wave pivots of the same type Third. Main trend
FastTraffic
Evgeniy Zhdan
The Expert Advisor has been specifically developed for trading gold (Spot Gold). The strategy is based on Fibo levels calculated from the previous (first) candle High/Low and the width of the current and lower timeframes channel. If important Fibo levels of different orders are located in a single price channel (within a spread), the EA defines this channel as the target for price movement and starts operation. Martingale and averaging are not used. Each order is independent and is accompanied b
Jazz
Evgeniy Zhdan
The algorithm of this Expert Advisor determines the significant price levels, where the trend often turns into a flat or reverses. Stochastic Oscillator serves as an additional filter of overbought/oversold zones. The EA sets stop loss and take profit after opening an order. The underlying trailing strategy applies a trailing stop. The EA is recommended for simultaneously use on three trading instruments: EURUSD M5, GBPUSD M5, EURCHF M5. Settings: Comment to order - comment to orders. MaxRisk -
Panther
Evgeniy Zhdan
The Expert Advisor looks for technical analysis patterns formed on the higher (hourly) timeframe to start working on the 5-minute chart. Technical analysis patterns used: double top/double bottom, head/shoulders, flag, expanding/narrowing triangles. The Relative Vigor Index technical indicator is used as the filter for opening deals. It is based on the idea that on the bull market the closing price is, as a rule, higher, than the opening price. It is the other way round on the bear market. This
Spook
Evgeniy Zhdan
The Expert Advisor calculates the divergence on the current and higher timeframes. In case the divergences coincide, the EA starts its operation. Deals have strict take profit and stop loss levels. Each deal is managed by trailing stop. The strategy involves the use of a tight stop-loss. Therefore, losing deals and/or series of losing deals are not uncommon. This EA is not suitable for those who have difficulties coping with losing deals. The EA is recommended for simultaneous use on the followi
Grand
Evgeniy Zhdan
The Expert Advisor has been developed specifically for the features of the CHFJPY currency pair. The EA's algorithm determines the direction of the current trend and starts operation. In case of a price reversal within the current trend, the EA adds additional orders. If trend changes, the EA starts to work in the direction contrary to the initial grid of orders. If there were no conditions for closing orders and the trend direction changed again, the EA continues to work with the "first" grid o
Intensive
Evgeniy Zhdan
The Expert Advisor algorithm determines on daily charts those candlestick patterns, which set the intraday trading direction. The trading EA determines how long the price is moving in overbought/oversold zones and starts working in the direction of the expected trend movement. Each position is accompanied with a tight stop loss and take profit. Only one active position can be open in the market. The EA was developed and tested using 99% quality quotes. The Expert Advisor has a built-in news filt
Slender
Evgeniy Zhdan
The strategy of this Expert Advisor is based on a hedging system, which implies placing opposite orders. The EA algorithm determines trend beginning and opens a position in the trend direction. In case of a wrong entry, the EA tries to neutralize the drawdown through opposite (hedging) orders at a preset interval (Coefficient of counter orders). Orders are closed when one of the two values ​​is reached - profit in percent or profit in points. The EA does not use lot increase. The EA wast tested
Dreamer
Evgeniy Zhdan
Советник работает по принципу хеджирования с периодическими "перекосами" в сторону трендовых направлений. Направления тренда советник определяет на основании стандартного индикатора Parabolic Stop and Reverse system (SAR). Уникальная стратегия установки балансирующих позиций позволяет избегать больших просадок даже при самых не благоприятных рыночных условиях. Параметры по умолчанию рекомендуется использовать на торговом инструменте: GBPJPY 15m. Разработка и оптимизация параметров производились
Filtrer:
Aucun avis
Répondre à l'avis