Cardwell Range Analyze
- Indicateurs
- Version: 1.1

Overview
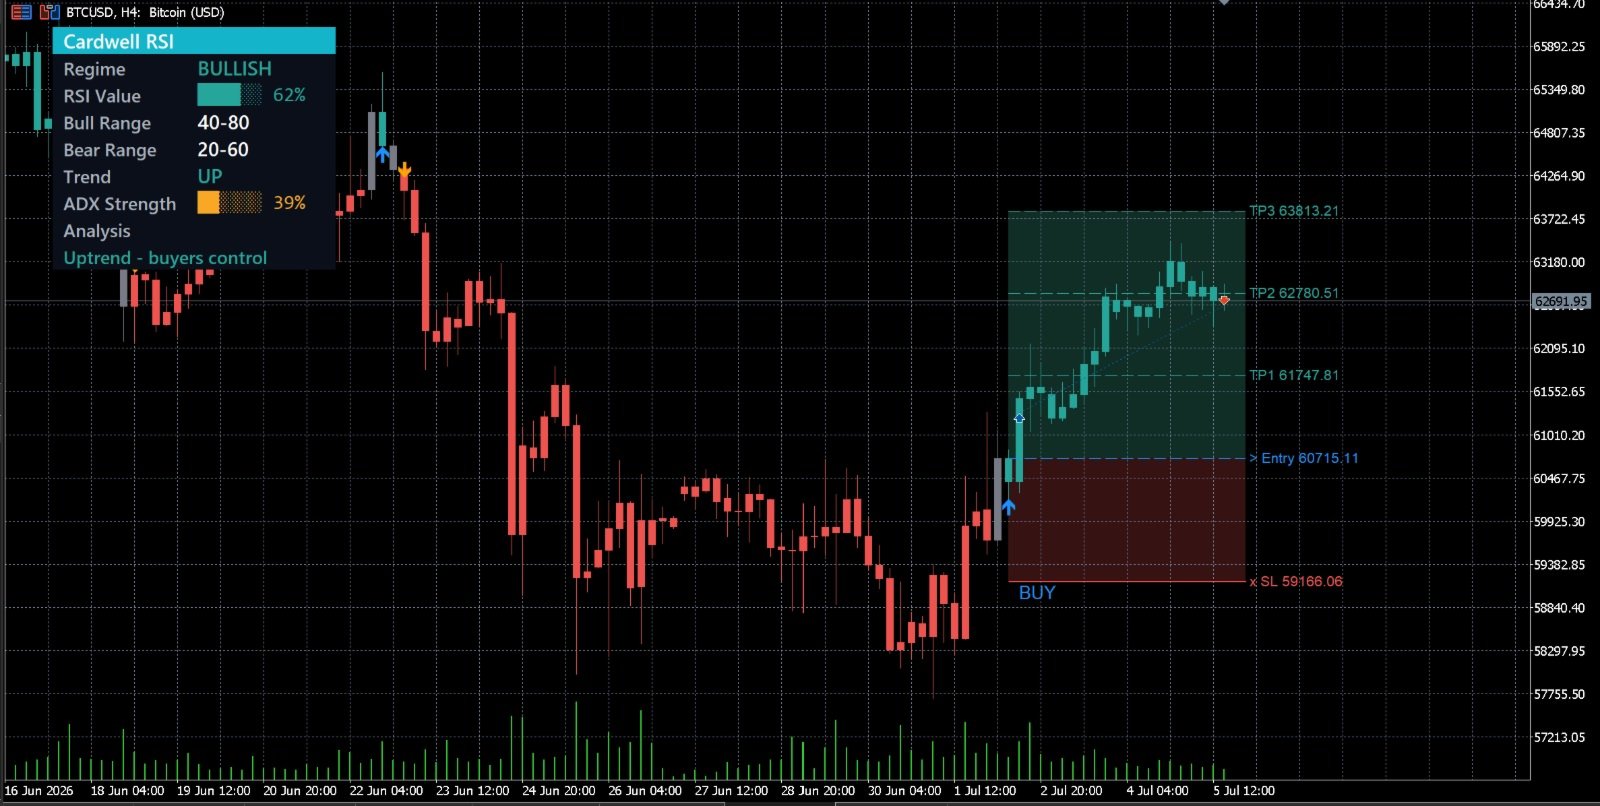
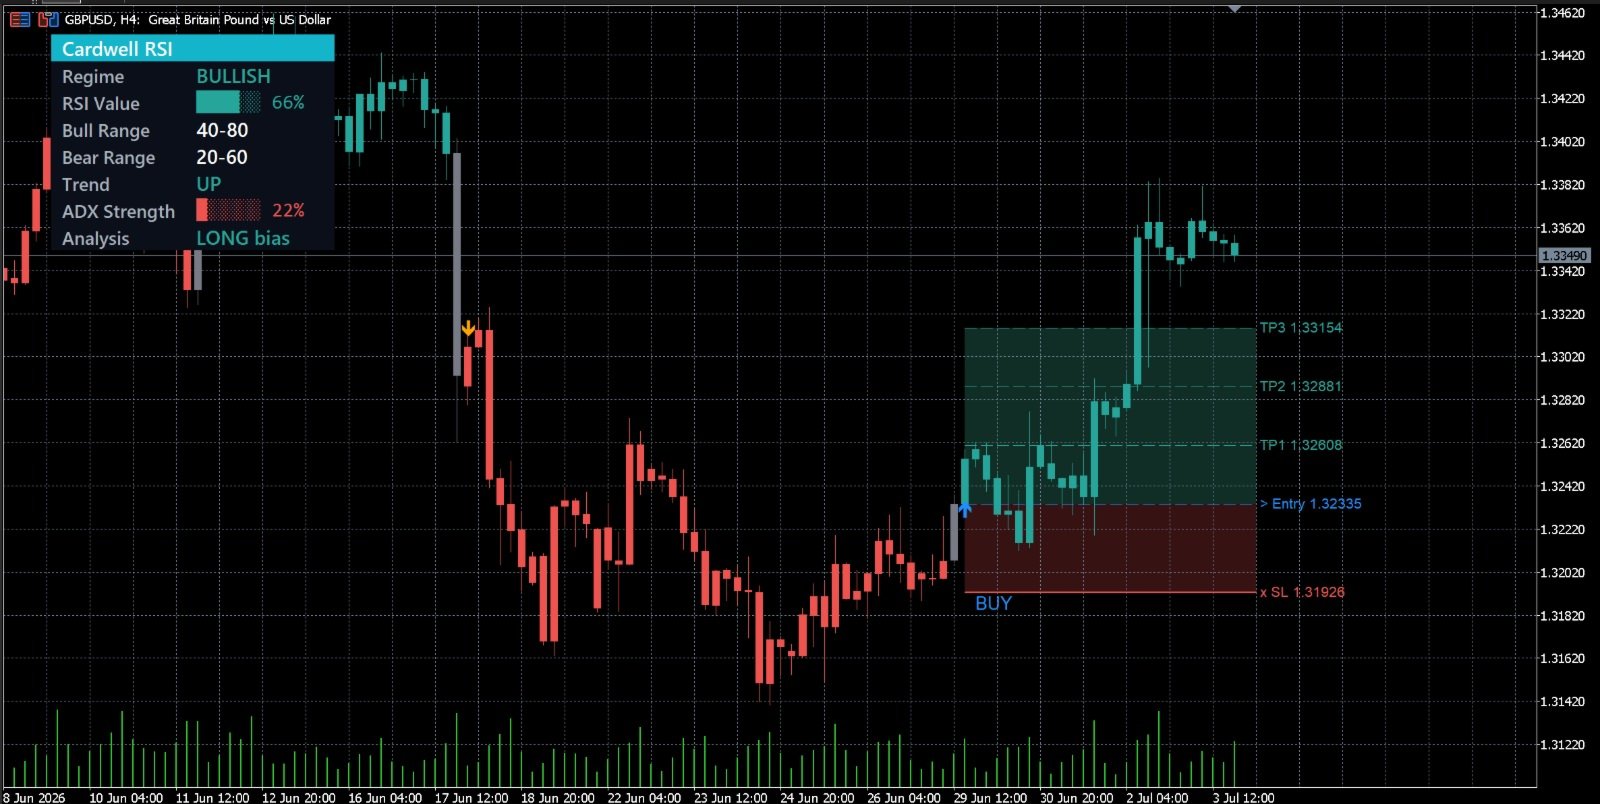
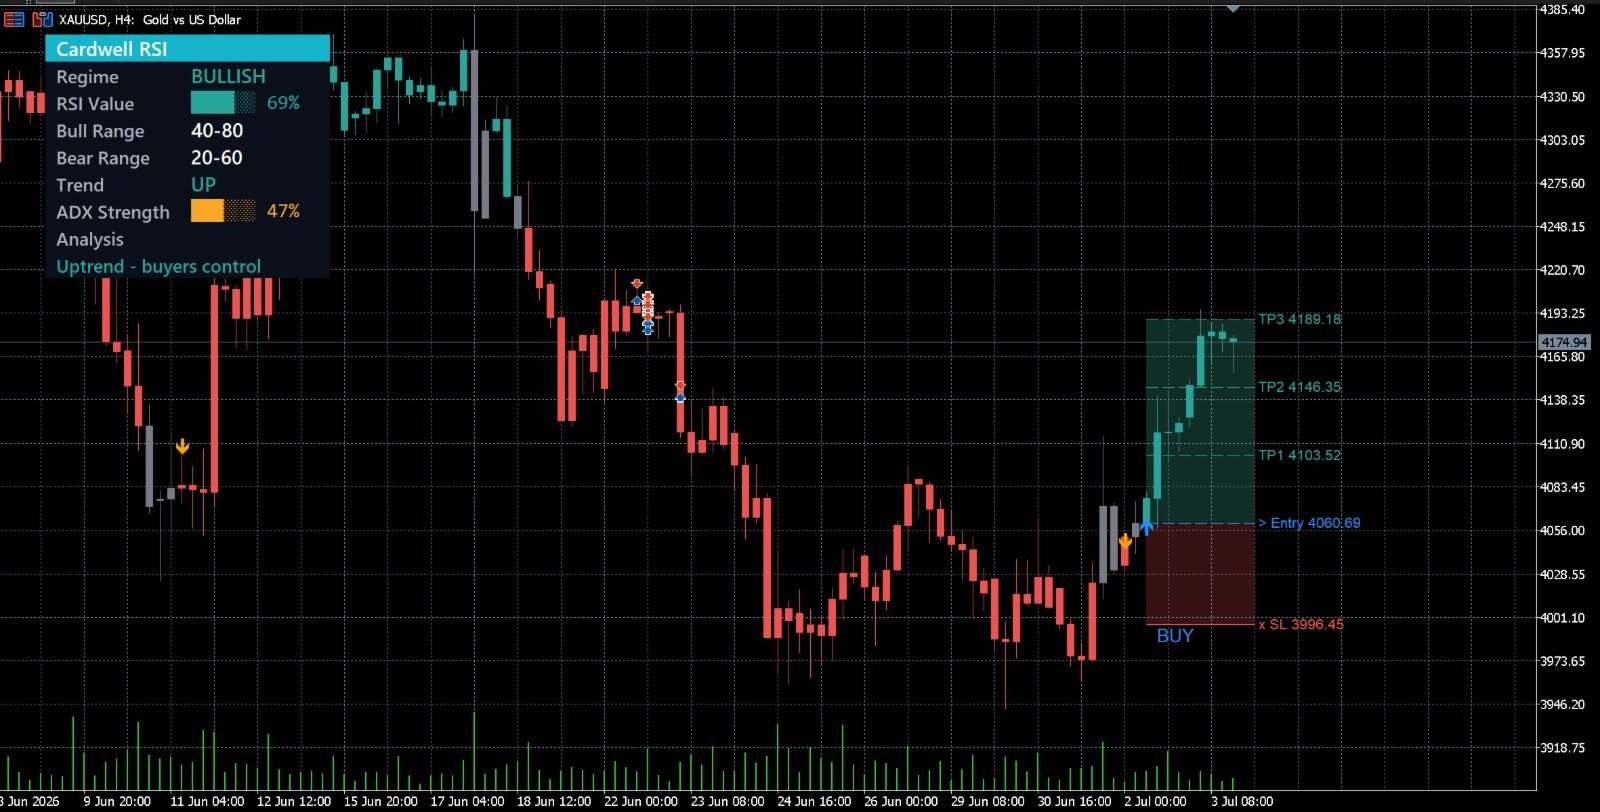
Cardwell Range Analyze reads the market through an RSI range regime, inspired by Andrew Cardwell's RSI rules, combined with a trend filter. It adds higher timeframe confirmation and an ADX filter to avoid weak, sideways markets. When momentum and trend agree, the indicator prints a Buy or Sell signal and draws a complete trade plan on the chart: Entry, Stop Loss and three Take Profit targets, with shaded risk and reward zones. A compact dashboard summarizes the market state at a glance.
Features
- RSI regime engine that classifies the market as bullish, bearish or neutral.
- Higher timeframe trend confirmation and an ADX filter for choppy markets.
- Automatic ATR based Entry, Stop Loss and three Take Profit levels for the latest signal.
- Shaded risk and reward zones drawn behind price.
- Heatmap candles colored by the current regime.
- On chart dashboard with regime, RSI, trend, ADX strength and a plain language analysis.
- Popup and push alerts on every new signal.
- Customizable colors, ranges, ATR multipliers and dashboard position.
How it works
The trend is defined by price relative to a moving average. A bullish regime requires RSI inside the bull range, and a bearish regime requires RSI inside the bear range. The regime must hold for a number of confirmation bars before it is accepted, which reduces whipsaw. A new signal fires only when the higher timeframe agrees and ADX is above the minimum strength. Entry is taken at the close of the bar before the signal, and the Stop Loss and Take Profit levels are placed at Entry plus or minus a multiple of ATR.
How to use
Attach the indicator to a chart. The recommended timeframe is H4, or H1 with the higher timeframe set to H4; always keep the chart timeframe lower than the higher timeframe setting. Watch the dashboard for the current regime and the analysis line. When a Buy or Sell signal appears, the Entry, Stop Loss and Take Profit lines and the risk and reward zones are drawn automatically. Only the most recent signal is shown, so a new signal replaces the previous one. Enable alerts to be notified of new signals.
Chart legend
Candle color shows the regime: teal for bullish, red for bearish, gray for neutral. A blue up arrow below the bar marks a Buy signal, and an orange down arrow above the bar marks a Sell signal.
The blue dashed line is the Entry price, the red line is the Stop Loss, and the teal dashed lines are the three Take Profit targets. The red box is the risk zone between Entry and Stop Loss, and the green box is the reward zone between Entry and the final target.
Dashboard
- Regime: bullish, bearish or neutral.
- RSI value with the active bull and bear ranges.
- Trend direction and ADX strength.
- Analysis: a plain language read such as uptrend, downtrend, choppy or no clear signal.
Inputs
Core: RSI length and source, trend moving average length and source.
Filters: bull and bear ranges, regime confirmation bars, higher timeframe confirmation and timeframe, ADX filter and minimum strength.
Trade tools: ATR length and the Stop Loss and Take Profit multipliers.
Visuals and dashboard: toggle candles, signals and levels, and choose the dashboard corner.
Alerts and colors: popup and push alerts, and full color customization.
Recommended settings
Use H4 as a balanced default with the higher timeframe set to H4. For intraday trading use an H1 chart, and for swing trading use an H4 chart with the higher timeframe set to D1. Avoid very low timeframes such as M1 and M5, where signals are noisier.
This indicator is an analysis tool and not financial advice. The levels are mathematical guides based on ATR and past price and do not guarantee results. Always apply your own risk management and test on a demo account first.