• Aperçu
  • Avis (7)
  • Commentaires (4)
  • Nouveautés

VR Pivot MT5

VR Pivot is an indicator of key pivot points.

Pivot points are a special type of support and resistance levels that are used to determine the strongest price zones. Professional traders use pivot levels to determine prices at which there is a high probability of a price reversal. The levels are calculated using special mathematical formulas, which include the closing, opening, high, and low prices of the previous time period. The most effective is the daily period. It is important to note that at first glance it may seem that there is nothing special about these levels, but if you analyze the price movement using pivot levels, you can clearly see that in most cases these levels show good, accurate results.

You can request technical support, settings and demo versions of programs in the author's profile.

Pivot levels can be used not only as pivot points, but also as levels at which Take Profit can be used as efficiently as possible to maximize profit, Stop Loss to minimize losses as much as possible, and transfer positions to a no-loss zone to reduce risks.

Advantages of the VR Pivot Indicator:

  • The indicator supports the calculation of several formulas:
    • Classic Pivot - the classic formula for pivot points
    • DeMark Pivot - DeMark formula
    • Woodie Pivot - Woodie Formula
    • Camarilla Pivot - Camarilla Formula
    • Fibonacci Pivot - Fibonacci Formula
  • The program is implemented as an indicator and can work together with your Expert Advisors and other indicators
  • It is possible to analyze historical data
  • The program is written in such a way that it displays information for the period set by the user and does not clutter the chart with historical data.
  • The indicator can calculate losses for any financial instruments (Forex, Crypto, CFD, Futures, Metals)
  • The trader can choose any time frames for the calculation
  • The indicator has a large number of settings that allows you to customize it in any style

Indicator operation algorithm

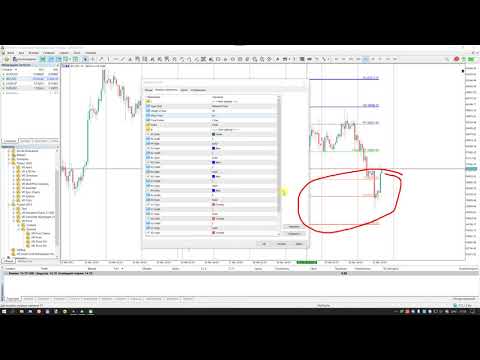
After you drag the indicator from the navigator to the chart, you will see a settings window where you can select the calculation formula and adjust the colors of the levels. After you click the "Ok" button, the chart will display horizontal levels and one vertical level. Using the vertical level, the trader can move the starting point of the calculations. Use the vertical level to study the historical data. To calculate new key levels, move the vertical level to the current period.

Indicator Settings

  • Main settings - main indicator settings
  • Type Pivot - type of pivots
    • Classic Pivot - the classic formula for pivot points
    • DeMark Pivot - DeMark formula
    • Woodie Pivot - Woodie Formula
    • Camarilla Pivot - Camarilla Formula
    • Fibonacci Pivot - Fibonacci Formula
  • Length of lines - the length of horizontal levels in bars
  • Show Price - display prices on levels
  • Time Frame - The period for calculating the levels, must be greater than the period for which the indicator is set
  • Prefix - prefix for indicator objects
  • Color settings - indicator color settings
Versions for MetaTrader 5 Versions for MetaTrader 4
Produits recommandés
My Pivot Pro
Ashok Kumar Singha
My Pivot Pro is the Pro Version of the Indicator " My PIVOT " ( Link:  https://www.mql5.com/en/market/product/90336 ) This indicator will help you a lot to decide the Market Range and Movement.  This Indicator is based on Pivot Lines and Support-Resistance zones. Now we can Plot Standard/Classic; Fibonacci; Demark; Camarilla nd Woodies Pivot Levels as per our requirements. Steps to Setup the Indicator: Install the Custom Indicator; Set the Pivot Type; Period and Time ( We recommend to use
KT Auto Trendline MT5
KEENBASE SOFTWARE SOLUTIONS
KT Auto Trendline draws the upper and lower trendlines automatically using the last two significant swing highs/lows. Trendline anchor points are found by plotting the ZigZag over X number of bars. Features No guesswork requires. It instantly draws the notable trendlines without any uncertainty. Each trendline is extended with its corresponding rays, which helps determine the area of breakout/reversal. It can draw two separate upper and lower trendlines simultaneously. It works on all timefr
BTFX Pivot Points
Bradley Thomas Farrington
The BTFX Pivot Points is an indicator which calculates the Support and Resistance levels for each day. By using this indicator the pivot levels point out clear targets to aim for. The resistance levels are shown in purple above the silver pivot line. The support levels are shown in Orange and can be found below the silver pivot line. This indicators works very well when used with The BTFX Daybreak Indicator. For a more in depth explanation of these indicators please watch the Youtube video attac
The indicator represents the session boxes for the Asian, European and American sessions. It is possible to change the time of each session, such as color. It is also possible to disable the display of each session. You will find in input parameters variables to modify in format hh:mm. In Colors tab you can change the color of boxes of each sessions. If you need some implementations please contact me.
Key level wedge MT5
Presley Annais Tatenda Meck
The   Key level wedge MT5   indicator automatically draws rising wedge pattern and falling wedge pattern for you on the chart. This pattern is really good when used as a confirmation entry at key support & resistance, supply & demand and reversal zones. Advantages  The   Key level wedge MT5   block DOES NOT RE-PAINT, giving you confidence when a signal appears and also helps when looking back.  The   Key level wedge MT5   includes an on/off button on the chart to easily keep the charts cle
Swiss VWAPsimple
Terence Gronowski
5 (4)
Swiss VWAPsimple Motivation Did not find free VWAP that works, the one that I found craseh. So I created a VWAP which calculates values only for the actual day. So computer resouces are not over stressed. What is VWAP, how is it used?  VWAP stands for Volume Weighed Average Price, it calculates the running sum of tick volume and the runnung sum of price times tickvolume. The division of these sums result in a weighed price (Sum P*V/Sum V). The calculation starts normally at midnight. The value
FREE
This indicator is stand alone version from  MP Pivot Levels  (All in one) containing Demark's Pivots. Calculations:     PP = X / 4     R1 = X / 2 - LOWprev     S1 = X / 2 - HIGHprev Uses: When the pair currency price may change the direction of movement. Possible constraints of support and resistance that creates plateaus for the currency pair prices. Tendency identification by comparing the present prices according to current day's pivot point and also the prior day's pivot points. ___________
FREE
Midas is the acronym for Market Interpretation / Data Analysis System is a trade approach started in 1995 by technical analyst Paul Levine and later developed by Andrew Coles, PhD and David Hawkins. Learn more in the book MIDAS Technical Analysis: A VWAP Approach to Trading and Investing in Today's Markets , (I saw that it is possible buy via Amazon). The positive points in relation to the Midas-based indicators are the prediction of movement reversal points, the negative point is the subjectivi
Big Players
Cesar Afif rezende Oaquim
Nade com os grandes ou evite-os a todo custo. Com esse indicador, a escolha é sua! Indicador por coloração de barras, com respostas simples se os "grandes" estão negociando ou não. Saiba quando agir se o mercado está calmo ou agitado, de forma simples, pelo valor de retorno do indicador ou pela aparência das barras. Indispensável indicador para a construção do seu robô ou para seu setup. Resultado do Indicador: 0 - 5. Participantes do mercado: 0 e 1 = Big Players! 2 e 3 = Dia normal. 4 e 5 = M
Weis Wave Double Side
Eduardo Da Costa Custodio Santos
L'indicateur latéral Weis Wave Bouble pour MT5 fait partie de la boîte à outils (Wyckoff Academy Wave Market) L'indicateur latéral Weis Wave Bouble pour MT5 a été créé sur la base de la Weis Wave déjà établie créée par David Weis. L'indicateur Weis Wave Double Side lit le marché par vagues comme cela a été fait par R. Wyckoff en 1900. Il aide à identifier l'effort x le résultat, la cause et l'effet, et l'offre et la demande Son différentiel est qu'il peut être utilisé en dessous de l'axe zéro, a
AliPivot Points is a Meta Trader 5 Indicator that draws you the latest pivot points. You can choose from timeframes ranging from 1 Minute to 1 Month. Calculation methods for pivot points includes: Classic Pivot Points Camarilla Pivot Points Fibonacci Pivot Points Woodie Pivot Points You can personalize the line colors, style, and width to suit your preference. The indicator displays values on the right side of the chart. AliPivot Points values can also be utilized by developers for creating Expe
FREE
Pivots Lines
Abakou Nazaire Ayelenou
Dessinez des points pivots Traditionnels, Fibonacci, Woodie, Classic, Demark, Camarilla pour n'importe quelle période. Supporte tous les types de pivot : Traditionnel, Fibonacci, Woodie, Classic, Demark, Camarilla. Supporte tous les cadres temporels (M1...H1...D1...MN1...Annuel) Supporte l'heure d'été du serveur Support de la section quotidienne du forex de l'ouverture de Sydney à la fermeture des États-Unis Support Crypto trading Remplir l'écart entre le pivot et la tendance, très utile Le
WAPV Weis Wave Chart Forex
Eduardo Da Costa Custodio Santos
Le Weis Wave Chart Forex pour MT5 est un indicateur de prix et de volume. La lecture du prix et du volume a été largement diffusée par Richard Demille Wyckoff sur la base des trois lois qu'il a créées : l'offre et la demande, la cause et l'effet et l'effort contre le résultat. En 1900 R.Wyckoff utilisait déjà le wave chart dans ses analyses. De nombreuses années plus tard, vers 1990, David Weis a automatisé le diagramme d'onde de R. Wyckoff et aujourd'hui nous vous apportons l'évolution du diagr
AutomaticZigZag
Stanislav Korotky
4.67 (3)
This is a non-parametric ZigZag providing 4 different methods of calculation. Upward edge continues on new bars while their `highs` are above highest `low` among previous bars, downward edge continues on next bars while their `lows` are below lowest `high` among previous; Gann swing: upward edge continues while `highs` and `lows` are higher than on the left adjacent bar, downward edge continues while `highs` and `lows` are lower than on the left adjacent bar. Inside bars (with lower `high` and
FREE
Horizontal Level indicator - reflects, using a histogram, the horizontal volumes of transactions at a certain price without reference to time. At the same time, the histogram appears directly in the terminal window, and each column of the volume is easily correlated with the quote value of the currency pair. The volume of transactions is of great importance in exchange trading, usually an increase in the number of concluded contracts confirms the trend, and their reduction indicates an imminent
Pivot Points MT5 is a universal color multicurrency/multisymbol indicator of the Pivot Points levels systems. You can select one of its three versions: Standard Old, Standard New and Fibo . It plots pivot levels for financial instruments in a separate window . The system will automatically calculate the Pivot Point on the basis of market data for the previous day ( PERIOD_D1 ) and the system of support and resistance levels, three in each. A user can choose colors for the indicator lines. The on
The   Pivot Point indicator   automatically calculates and displays the pivot point line and support and resistance levels. Pivot can be calculated according to the Classic, Floor, Fibonacci, Woodie, Camarilla or DeMark formula. It is also possible to select the period for calculating the indicator. A trader can choose from daily, weekly, monthly, or user-defined periods. Types of pivots Classic Floor Fibonacci Woodie Camarilla DeMark Main features The indicator shows the current and histor
FREE
Draw levels of support and resistance based on highs/lows or closes from daily, weekly or monthly. This indicator uses the highs, lows or closes to draw horizontal lines on the graph. By observing those lines you can identify trend (gaining or losing levels of resistence/support) and find good levels where price can bounce. For those who trade price action, this is a very useful indicator.
White Weis Volume Ticks
Ricardo Almeida Branco
5 (3)
White Weis Volume This indicator shows the sum of the volume in each wave, bulish or bearish, as idealized by David Weis , but it brings an important addition , which is the marking of the bar with the highest volume of the wave (White Bar)! In coding the indicator, it was sought to optimize the code to require minimal processing during use and not to overload mt5. The indicator can be used for pre-trading analysis and study, where the trader analyzes possible points of support and resi
This z-score indicator shows the correct z-score of an asset, as it uses the normalized price data for calculation, which is the only correct way. Z-score is only applicable for normal distributed data, therefore not the actual price is considered, but the normalised returns, which were assumed to follow a normal distribution. Returns are mean reverting and assumed to follow a normal distribution, therefore z-score calculation of returns is more reliable than z-score on price, as price is NOT m
ArcTracer
Syed Oarasul Islam
This Indicator draws Fibonacci Arc levels in two different ways. You can select whether to draw Fibonacci Arc levels based on your favourite ZigZag settings or you can let the indicator to draw Arc levels based on given number of bars or candles.  You can also set Mobile and Email notification for your favourite Arc levels individually. With this indicator you will not have to feel lonely as the it can generate Voice alerts, which will keep you focused on your trading and remove boredom.  Produc
HiqIndi
Ratul Goswami
It is 1 Minute Strategy. When Indicator Gives Signal Then Put on Buy. It's Best Work on Crash 300 & Crash 500. If you want to know anything details please Contact Me on Telegram In this Link:  https://t.me/+mi_52VwFp3E4MGNl It is very nice for scalping & for who not gives enough time on market. N/B: Please be carefully it's only for scalping & not trade all the day. It's only 10 or maximum 15 trade per day. Thanks everyone.
Weis Wave Double Side Alert
Eduardo Da Costa Custodio Santos
L'indicateur latéral Weis Wave Bouble pour MT5 fait partie de la boîte à outils (Wyckoff Academy Wave Market) L'indicateur latéral Weis Wave Bouble pour MT5 a été créé sur la base de la Weis Wave déjà établie créée par David Weis. L'indicateur Weis Wave Double Side lit le marché par vagues comme R. Wyckoff l'a fait en 1900. Il aide à identifier l'effort x le résultat, la cause et l'effet, et l'offre et la demande Son différentiel est qu'il peut être utilisé en dessous de l'axe zéro et dispose d'
Vwap Freeze
Ricardo Almeida Branco
5 (1)
The previous day's vwap is used by some traders as a support and resistance point, after all it is one of the ways to consider the fair price of that asset or that pair the day before. Possible defenses can occur in this region indicating a reversal, or triggering stops starting a new, more directional movement. It is a matter of analyzing how it will add to your operational. To avoid manually drawing the previous day's vwaps and saving time for your analysis, use the Vwap Freeze indicator,
The   ICT Unicorn Model   indicator highlights the presence of "unicorn" patterns on the user's chart which is derived from the lectures of   "The Inner Circle Trader" (ICT) . Detected patterns are followed by targets with a distance controlled by the user.   USAGE (image 2) At its core, the ICT Unicorn Model relies on two popular concepts, Fair Value Gaps and Breaker Blocks. This combination highlights a future area of support/resistance. A   Bullish Unicorn Pattern   consists ou
Automatic Fibonacci  is an indicator for automatic Fibonacci Levels drawing. It is fully customizable by user. User can also select different Fibobonacci Levels by user settings or can use multiple Automatic Fibonacci indicator in one chart. All details can be found >>HERE<< Instructions Move Indicator to the chart (simply drag and drop) When pop up window appears select desired settings. Confirm settings and enjoy the Automatic Fibonacci indicator. Features Any chart Any time-frame C
PP Super Trend MT5
Mohammad Taher Halimi Tabrizi
Pivot Point Super Trend is another type of famous super trend indicator which is equipped with pivot points in different way. this indicator used to be available in the Trading view and this is converted from there to the MT5 language. MT4 version of the indicator is also available and you can find in my products. there are also buy/sell signals shown on the screen.
This is a multi-timeframe indicator that detects and displays support and resistance (S&R) lines using the ZigZag indicator. Features The support and resistance lines are not redrawing. The indicator is capable of adding new support and resistance levels as they appear. Each S&R line has a tooltip that displays the price level and start time. Shows the start time, price level and number of touches of all S&R lines when pressing the shortcut Shift+I Save time for multi-timeframe analysis on
MarketMagnet
Kelly Adediran Raymond
Are you ready to take your trading journey to new heights? Look no further than MarketMagnet, this groundbreaking indicator designed to propel your trading success with excitement and accuracy. Powered by the convergence of Momentum and CCI (Commodity Channel Index), MarketMagnet equips traders with the ultimate tool to determine direction and entry prices for a wide range of recommended currency pairs and instruments. It is designed for traders seeking to scalp for a few pips on lower timeframe
VWAP with more settings
Maria Cristina Sabatini
I developed this vwap with more settings in order to be customized as much as possible.  VWAP is a really strong indicator for your trading. It can be used to check if the market is in balance or ranged, and also you can use the levels as support/resistence/target.  In the pictures you can see the main settings, and you can select the use of real volume from the broker. Hope you will find it useful. Many thanks in advance.  
Les acheteurs de ce produit ont également acheté
Atomic Analyst MT5
Issam Kassas
3.64 (11)
Tout d'abord, il convient de souligner que cet indicateur de trading n'est ni repainting, ni redrawing et ne présente aucun délai, ce qui le rend idéal à la fois pour le trading manuel et automatisé. L'Analyste Atomique est un indicateur d'action sur les prix PA qui utilise la force et le momentum du prix pour trouver un meilleur avantage sur le marché. Équipé de filtres avancés qui aident à éliminer les bruits et les faux signaux, et à augmenter le potentiel de trading. En utilisant plusieur
Tout d'abord, il convient de souligner que ce système de trading est un indicateur non repeint, non redessiné et non retardé, ce qui le rend idéal pour le trading manuel et automatisé. Le "Système de Trading Smart Trend MT5" est une solution de trading complète conçue pour les traders débutants et expérimentés. Il combine plus de 10 indicateurs premium et propose plus de 7 stratégies de trading robustes, ce qui en fait un choix polyvalent pour différentes conditions de marché. Stratégie de suivi
Quantum Trend Sniper
Bogdan Ion Puscasu
5 (37)
Présentation       Quantum Trend Sniper Indicator   , l'indicateur révolutionnaire MQL5 qui transforme la façon dont vous identifiez et négociez les inversions de tendance ! Développé par une équipe de traders expérimentés avec une expérience commerciale de plus de 13 ans,       Indicateur Quantum Trend Sniper       est conçu pour propulser votre parcours de trading vers de nouveaux sommets grâce à sa manière innovante d'identifier les inversions de tendance avec une précision extrêmement élevée
Trend Screener Pro MT5
STE S.S.COMPANY
4.89 (61)
Indicateur de tendance, solution unique révolutionnaire pour le trading et le filtrage des tendances avec toutes les fonctionnalités de tendance importantes intégrées dans un seul outil ! Il s'agit d'un indicateur multi-période et multi-devises 100 % non repeint qui peut être utilisé sur tous les symboles/instruments : forex, matières premières, crypto-monnaies, indices et actions. Trend Screener est un indicateur de suivi de tendance efficace qui fournit des signaux de tendance fléchés avec des
FX Volume MT5
Daniel Stein
4.94 (17)
Obtenez votre mise à jour quotidienne du marché avec des détails et des captures d'écran via notre Morning Briefing ici sur mql5 et sur Telegram ! FX Volume est le PREMIER et SEUL indicateur de volume qui fournit un VRAI aperçu du sentiment du marché du point de vue d'un courtier. Il fournit des informations impressionnantes sur la façon dont les acteurs institutionnels du marché, comme les courtiers, sont positionnés sur le marché des changes, bien plus rapidement que les rapports COT. Voir c
RelicusRoad Pro MT5
Relicus LLC
4.81 (21)
Maintenant 147 $ (augmentant à 499 $ après quelques mises à jour) - Comptes illimités (PCS ou Mac) Manuel d'utilisation RelicusRoad + Vidéos de formation + Accès au groupe Discord privé + Statut VIP UNE NOUVELLE FAÇON DE REGARDER LE MARCHÉ RelicusRoad est l'indicateur de trading le plus puissant au monde pour le forex, les contrats à terme, les crypto-monnaies, les actions et les indices, offrant aux traders toutes les informations et tous les outils dont ils ont besoin pour rester renta
FX Power MT5 NG
Daniel Stein
5 (4)
Obtenez votre mise à jour quotidienne du marché avec des détails et des captures d'écran via notre Morning Briefing ici sur mql5 et sur Telegram ! FX Power MT5 NG est la nouvelle génération de notre très populaire indicateur de force des devises, FX Power. Et qu'est-ce que ce compteur de force de nouvelle génération offre ? Tout ce que vous avez aimé de l'original FX Power PLUS Analyse de la force de l'OR/XAU Des résultats de calcul encore plus précis Périodes d'analyse configurables individuel
Advanced Supply Demand MT5
Bernhard Schweigert
4.53 (15)
La meilleure solution pour tout commerçant débutant ou expert ! Cet indicateur est un outil de trading unique, de haute qualité et abordable car nous avons intégré un certain nombre de fonctionnalités propriétaires et une nouvelle formule. Avec cette mise à jour, vous pourrez afficher des zones à double horaire. Vous pourrez non seulement afficher un TF plus élevé, mais afficher les deux, le graphique TF, PLUS le TF supérieur : AFFICHAGE DES ZONES NICHÉES. Tous les traders Supply Demand vont ado
Tout d'abord, il convient de souligner que cet outil de trading est un indicateur non repeint, non redessiné et non retardé, ce qui le rend idéal pour le trading professionnel. L'indicateur Smart Price Action Concepts est un outil très puissant à la fois pour les nouveaux et les traders expérimentés. Il regroupe plus de 20 indicateurs utiles en un seul, combinant des idées de trading avancées telles que l'analyse du trader Inner Circle et les stratégies de trading Smart Money Concepts. Cet in
XQ Indicator MetaTrader 5
Marzena Maria Szmit
5 (1)
Step into the realm of Forex trading with confidence and precision using XQ, a cutting-edge Forex indicator designed to elevate your trading game to unprecedented heights. Whether you're a seasoned trader or just stepping into the world of currency exchange, XQ Forex Indicator empowers you with the insights and signals needed to make informed trading decisions. The signal conditions are a combination of three indicators, and XQ Forex Indicator only display  medium and long-term trends . The ind
The Volume by Price Indicator for MetaTrader 5 features Volume Profile and Market Profile TPO (Time Price Opportunity). Get valuable insights out of currencies, equities and commodities data. Gain an edge trading financial markets. Volume and TPO histogram bar and line charts. Volume Footprint charts. TPO letter and block marker charts including split structures. Versatile segmentation and compositing methods. Static, dynamic and flexible ranges with relative and/or absolute visualizations. Lay
Présentation       Quantum Breakout PRO   , l'indicateur révolutionnaire MQL5 qui transforme la façon dont vous négociez les zones d'évasion ! Développé par une équipe de traders expérimentés avec une expérience commerciale de plus de 13 ans,       Évasion quantique PRO       est conçu pour propulser votre parcours commercial vers de nouveaux sommets grâce à sa stratégie de zone de discussion innovante et dynamique. Quantum Breakout Indicator vous donnera des flèches de signalisation sur le
ICT, SMC, SMART MONEY CONCEPTS, SMART MONEY, Smart Money Concept, Support and Resistance, Trend Analysis, Price Action, Market Structure, Order Blocks, BOS/CHoCH,   Breaker Blocks ,  Momentum Shift,   Supply&Demand Zone/Order Blocks , Strong Imbalance,   HH/LL/HL/LH,    Fair Value Gap, FVG,  Premium  &   Discount   Zones, Fibonacci Retracement, OTE, Buy Side Liquidity, Sell Side Liquidity, BSL/SSL Taken, Equal Highs & Lows, MTF Dashboard, Multiple Time Frame, BigBar, HTF OB, HTF Market Structure
Top indicator for MT5   providing accurate signals to enter a trade without repainting! It can be applied to any financial assets:   forex, cryptocurrencies, metals, stocks, indices .  Watch  the video  (6:22) with an example of processing only one signal that paid off the indicator! MT4 version is here It will provide pretty accurate trading signals and tell you when it's best to open a trade and close it. Most traders improve their trading results during the first trading week with the help of
AW Trend Predictor MT5
AW Trading Software Limited
4.76 (54)
La combinaison des niveaux de tendance et de panne dans un seul système. Un algorithme d'indicateur avancé filtre le bruit du marché, détermine la tendance, les points d'entrée, ainsi que les niveaux de sortie possibles. Les signaux indicateurs sont enregistrés dans un module statistique, qui vous permet de sélectionner les outils les plus appropriés, montrant l'efficacité de l'historique des signaux. L'indicateur calcule les marques Take Profit et Stop Loss. Manuel et instruction ->   ICI   / v
Auto Order Block with break of structure based on ICT and Smart Money Concepts Futures Break of Structure ( BoS )             Order block ( OB )            Higher time frame Order block / Point of Interest ( POI )    shown on current chart           Fair value Gap ( FVG ) / Imbalance   ,  MTF      ( Multi Time Frame )    Volume Imbalance     ,  MTF          vIMB Gap’s Equal High / Low’s     ,  MTF             EQH / EQL Liquidity               Current Day High / Low           HOD /
L'indicateur de Carré Gann est un puissant outil d'analyse du marché basé sur l'article "Formule Mathématique pour les Prédictions de Marché" écrit par W.D. Gann. Cet outil utilise des concepts mathématiques et des théories de Gann pour réaliser une analyse précise du marché. Il utilise les carrés de 144, 90, 52 et aussi le carré de 9. De plus, il intègre la méthode du  pour le carré de 9 et sa relation avec les canaux et le modèle en étoile de ce carré. Manuel d'Utilisateur et Application : Ava
TrendMaestro5
Stefano Frisetti
note: this indicator is for METATRADER4, if you want the version for METATRADER5 this is the link:  https://www.mql5.com/it/market/product/108106 TRENDMAESTRO recognizes a new TREND in the bud, he never makes mistakes. The certainty of identifying a new TREND is priceless. DESCRIPTION TRENDMAESTRO identifies a new TREND in the bud, this indicator examines the volatility, volumes and momentum to identify the moment in which there is an explosion of one or more of these data and therefore the mome
Le profit de la structure du marché change à mesure que le prix s'inverse et recule. L'indicateur d'alerte d'inversion de la structure du marché identifie le moment où une tendance ou un mouvement de prix approche de l'épuisement et est prêt à s'inverser. Il vous avertit des changements dans la structure du marché qui se produisent généralement lorsqu'un renversement ou un recul majeur est sur le point de se produire. L'indicateur identifie initialement les cassures et la dynamique des prix,
Trend Line Map Pro MT5
STE S.S.COMPANY
4.67 (9)
Trend Line Map indicator is an addons for   Trend Screener Indicator . It's working as a scanner for all signals generated by Trend screener ( Trend Line Signals ) . It's a Trend Line Scanner based on Trend Screener Indicator.  If you don't have Trend Screener Pro Indicator,   the Trend Line Map Pro will not work.     LIMITED TIME OFFER : Trend Line Map Indicator is available for only 50 $ and lifetime. ( Original price 125$ ) By accessing to our MQL5 Blog,  you can find all our premium indica
Blahtech Supply Demand MT5
Blahtech Limited
4.57 (14)
Was: $299  Now: $99   Supply Demand uses previous price action to identify potential imbalances between buyers and sellers. The key is to identify the better odds zones, not just the untouched ones. Blahtech Supply Demand indicator delivers functionality previously unavailable on any trading platform. This 4-in-1 indicator not only highlights the higher probability zones using a multi-criteria strength engine, but also combines it with multi-timeframe trend analysis, previously confirmed swings
Owl Smart Levels MT5
Sergey Ermolov
4.47 (36)
Version MT4   |  FAQ L' indicateur Owl Smart Levels est un système de trading complet au sein d'un seul indicateur qui comprend des outils d'analyse de marché populaires tels que les fractales avancées de Bill Williams , Valable ZigZag qui construit la structure d'onde correcte du marché et les niveaux de Fibonacci qui marquent les niveaux exacts d'entrée. sur le marché et les endroits où prendre des bénéfices. Description détaillée de la stratégie Mode d'emploi de l'indicateur Conseiller-Assis
TPSpro TRENDPRO  - is a trend indicator that automatically analyzes the market and provides information about the trend and each of its changes, as well as giving signals for entering trades without redrawing! The indicator uses each candle, analyzing them separately. referring to different impulses - up or down impulse. Exact entry points into transactions for currencies, crypto, metals, stocks, indices!  -  Version MT4                  DETAILED DESCRIPTION        /       TRADING SETUPS       
TrendLine PRO MT5
Evgenii Aksenov
4.78 (49)
The Trend Line PRO indicator is an independent trading strategy. It shows the trend change, the entry point to the transaction, as well as automatically calculates three levels of Take Profit and Stop Loss protection Trend Line PRO is perfect for all Meta Trader symbols: currencies, metals, cryptocurrencies, stocks and indices Advantages of Trend Line PRO Never redraws its signals The possibility of using it as an independent strategy It has three automatic levels Take Profit and Stop Loss lev
Gartley Hunter Multi
Siarhei Vashchylka
5 (5)
Gartley Hunter Multi - An indicator for searching for harmonic patterns simultaneously on dozens of trading instruments and on all classic timeframes: (m1, m5, m15, m30, H1, H4, D1, Wk, Mn). Manual (Be sure to read before purchasing) | Version for MT4 Advantages 1. Patterns: Gartley, Butterfly, Shark, Crab. Bat, Alternate Bat, Deep Crab, Cypher 2. Simultaneous search for patterns on dozens of trading instruments and on all classic timeframes 3. Search for patterns of all possible sizes. Fr
TrendDecoder Premium MT5
Christophe, Pa Trouillas
5 (1)
Identifiez les ranges et les tendances fortes  |  Obtenez les premiers signaux   |    Obtenez des TP et des sorties   clairs   |    Repérer les niveaux Fibo que le prix va tester   |  Indicateur qui ne retrace pas, non retardé - idéal pour le trading manuel et automatisé - adapté à tous les actifs et à toutes les unités de temps - 50% discount   pour le lancement - puis retour à >>   149 $ Après votre achat,   contactez-moi sur ce canal  pour obtenir les réglages recommandés. Version MT4 :   cli
Was: $249  Now: $99   Market Profile defines a number of day types that can help the trader to determine market behaviour. A key feature is the Value Area, representing the range of price action where 70% of trading took place. Understanding the Value Area can give traders valuable insight into market direction and establish the higher odds trade. It is an excellent addition to any system you may be using. Inspired by Jim Dalton’s book “Mind Over Markets”, this indicator is designed to suit the
Golden Spikes Detector
Batsirayi L Marango
5 (1)
Golden Spikes Detector Cet indicateur est basé sur une stratégie avancée principalement pour les pics de trading sur les indices Boom et Crash. Des algorithmes complexes ont été mis en œuvre pour détecter uniquement les entrées à forte probabilité. Il alerte sur les entrées potentielles d’achat et de vente. Pour échanger des pics sur le courtier Deriv ou Binary, prenez uniquement les alertes Buy Boom et Sell Cash. Il a été optimisé pour être chargé sur une période de 5 minutes, bien qu'une analy
Matrix Arrow Indicator MT5
Juvenille Emperor Limited
5 (14)
Matrix Arrow Indicator MT5   est une tendance unique 10 en 1 suivant un indicateur multi-période   100% non repeint   qui peut être utilisé sur tous les symboles/instruments:   forex ,   matières premières ,   crypto-monnaies ,   indices ,  actions .  Matrix Arrow Indicator MT5  déterminera la tendance actuelle à ses débuts, en rassemblant des informations et des données à partir d'un maximum de 10 indicateurs standard, qui sont: Indice de mouvement directionnel moyen (ADX) Indice de canal de m
Smart Peak Bottom
Xiaoyu Huang
5 (2)
Il s'agit d'un indicateur clair pour juger des hauts et des bas, et cela fonctionne bien pour le marché oscillant. Prix promotionnel 49$ → 59$ caractéristiques bon pour juger des hauts et des bas Pas de redessin, pas de dérive Calcul rapide, pas de décalage Mode de rappel riche Plusieurs paramètres et couleurs peuvent être ajustés paramètre "======== Principal ========" HighLowPeriod1 = 9 HighLowPeriod2 = 60 HighLowPeriod3 = 34 HighLowEMAPeriod = 4 MASignalPeriod = 5 "======== Notifier ==
Plus de l'auteur
VR Locker
Vladimir Pastushak
4.2 (5)
Le conseiller Forex VR Locker est une stratégie de trading automatique basée sur le trading de grille utilisant des verrous positifs. Un blocage positif est une situation dans un compte de trading où une position de vente est supérieure à une position d'achat et où les deux positions sont ouvertes avec le même lot. Pour un ensemble de fichiers, des instructions, un joli bonus écrivez-moi Le suivi du travail du robot peut être consulté dans le profil de l'auteur Le conseiller expert a été dével
VR Lollipop MT5
Vladimir Pastushak
2.33 (6)
Faire fructifier les bénéfices - c'est la stratégie de base du robot de trading VR Lollipop . Trader dans le sens de la tendance, ajouter des positions dans le sens de la tendance, transférer des positions vers des positions sans perte et réduire les pertes aussi rapidement que possible, tels sont les principes qui sous-tendent la stratégie de trading de VR Lollipop. Le trading en suivi de tendance, combiné à trailing stop dynamique , permet de capter tous les mouvements de tendance de la manièr
VR Smart Grid MT5
Vladimir Pastushak
4.32 (25)
VR Smart Grid est un robot de trading, capable de fermer partiellement un grand nombre de positions de marché avec un petit profit. La fermeture en petites parties permet de sortir rapidement et efficacement des positions perdantes. L'algorithme du robot contient plusieurs stratégies intelligentes de trading. La principale stratégie de trading est basée sur la construction d'un réseau de positions et la fermeture de positions en petites parties avec un profit déterminé. Le robot analyse les posi
VR Lollipop
Vladimir Pastushak
4.67 (12)
Faire fructifier les bénéfices - c'est la stratégie de base du robot de trading VR Lollipop . Trader dans le sens de la tendance, ajouter des positions dans le sens de la tendance, transférer des positions vers des positions sans perte et réduire les pertes aussi rapidement que possible, tels sont les principes qui sous-tendent la stratégie de trading de VR Lollipop. Le trading en suivi de tendance, combiné à trailing stop dynamique , permet de capter tous les mouvements de tendance de la manièr
VR Smart Grid
Vladimir Pastushak
4.35 (177)
VR Smart Grid est un robot de trading, capable de fermer partiellement un grand nombre de positions de marché avec un petit profit. La fermeture en petites parties permet de sortir rapidement et efficacement des positions perdantes. L'algorithme du robot contient plusieurs stratégies intelligentes de trading. La principale stratégie de trading est basée sur la construction d'un réseau de positions et la fermeture de positions en petites parties avec un profit déterminé. Le robot analyse les posi
VR Donchian
Vladimir Pastushak
4.82 (17)
L'indicateur VR Donchian est une version améliorée du canal Donchian. Les améliorations ont touché presque toutes les fonctions du canal, mais l'algorithme de fonctionnement principal et la construction du canal ont été préservés. Un changement de couleur des niveaux a été ajouté à l'indicateur de balle en fonction de la tendance actuelle - cela montre clairement au trader un changement de tendance ou un plat. La possibilité d'informer le trader de la cassure de l'un des deux niveaux de canal su
FREE
VR Donchian MT5
Vladimir Pastushak
4.81 (16)
L'indicateur VR Donchian est une version améliorée du canal Donchian. Les améliorations ont touché presque toutes les fonctions du canal, mais l'algorithme de fonctionnement principal et la construction du canal ont été préservés. Un changement de couleur des niveaux a été ajouté à l'indicateur de balle en fonction de la tendance actuelle - cela montre clairement au trader un changement de tendance ou un plat. La possibilité d'informer le trader de la cassure de l'un des deux niveaux de canal su
FREE
VR Watch list and Linker MT5
Vladimir Pastushak
4.89 (9)
Liste de surveillance VR et Linker - application de filtrage pour le terminal MétaTrader . Facilite la recherche des instruments financiers les plus intéressants et techniques. Ce filtre est utilisé par les traders pour négocier sur des bourses telles que bybit, la Bourse de Moscou, l'American Exchange, le marché des changes et des crypto-monnaies, le marché des métaux, et est utilisé pour le trading dans des sociétés accessoires. La sélection des instruments financiers est effectuée manuellemen
FREE
VR Atr Pro MT5
Vladimir Pastushak
4.75 (4)
VR ATR Pro is a powerful professional tool for determination of target levels on a financial instrument. The indicator's effectiveness has been proved by thousands tests on real and demo accounts. VR ATR Pro is the indicator that works on real data using live true statistics. Statistics is stubborn, the usage of real statistical data in mathematical calculations allows you to calculate the exact target levels for a financial instrument. Pour un ensemble de fichiers, des instructions, un joli bon
VR Watch list and Linker
Vladimir Pastushak
4.67 (9)
Liste de surveillance VR et Linker - application de filtrage pour le terminal MétaTrader . Facilite la recherche des instruments financiers les plus intéressants et techniques. Ce filtre est utilisé par les traders pour négocier sur des bourses telles que bybit, la Bourse de Moscou, l'American Exchange, le marché des changes et des crypto-monnaies, le marché des métaux, et est utilisé pour le trading dans des sociétés accessoires. La sélection des instruments financiers est effectuée manuellemen
FREE
VR Color Levels est un outil pratique pour ceux qui appliquent l'analyse technique à l'aide d'éléments tels que la ligne de tendance, le rectangle et le texte. Il est possible d'ajouter du texte directement au graphique et de prendre des captures d'écran. Les paramètres, les fichiers de configuration, les versions de démonstration, les instructions, la résolution de problèmes peuvent être obtenus auprès de [Blog] Vous pouvez lire ou écrire des critiques sur [lien] Version pour [MetaTrader 4]
FREE
VR Sync Charts MT5
Vladimir Pastushak
5 (4)
VR Sync Charts is a tool for synchronizing layout between windows. INDICATOR DOES NOT WORK IN STRATEGY TESTER!!! How to get a trial version with a test period, instructions, training, read the blog https://www.mql5.com/ru/blogs/post/726504 . VR Sync Charts allow you to synchronize trend levels, horizontal levels and Fibonacci layout with all charts. With this you can synchronize all standard graphic objects in the MetaTrader terminal. All your trends, Gann lines and other objects are exactly cop
VR Calculate Martingale
Vladimir Pastushak
5 (5)
The VR Calculate Martingale indicator is a powerful order and position calculator for calculating profit or loss. With the help of the order and position calculator, a trader can calculate the average price of any forex currency, stocks or crypto currency. Now you can connect the indicator and start superimposing virtual orders on your real orders and positions. By creating additional virtual positions, you can calculate any development of the situation. The indicator has a built-in lot calculat
VR Ticks MT5
Vladimir Pastushak
4.33 (3)
VR Ticks   est un indicateur spécial pour les stratégies basées sur le scalping. Grâce à cet indicateur, le trader peut voir le graphique des ticks directement sur le graphique principal de l'instrument financier. Un graphique à ticks vous permet d'entrer une position sur le marché ou de clôturer une position sur le marché aussi précisément que possible. VR Ticks trace les données des tiques sous la forme de lignes qui changent de couleur en fonction de la direction - cela vous permet de compren
FREE
VR Sync Charts
Vladimir Pastushak
5 (7)
VR Sync Charts is a tool for synchronizing layout between windows. INDICATOR DOES NOT WORK IN STRATEGY TESTER!!! How to get a trial version with a test period, instructions, training, read the blog https://www.mql5.com/ru/blogs/post/726504 . VR Sync Charts allow you to synchronize trend levels, horizontal levels and Fibonacci layout with all charts. With this you can synchronize all standard graphic objects in the MetaTrader terminal. All your trends, Gann lines and other objects are exactly cop
VR Alert
Vladimir Pastushak
5 (1)
The VR Alert indicator utility is designed to inform the trader when the price reaches the given level. The signal levels can be set not only horizontally but also inclined. Thus, the trader gets the opportunity to receive notifications from the inclined trend levels. Thanks to the VR Alert utility, you will no longer need to sit near the monitor for a long time. You can calmly do about your household chores, perform your work duties and spend time with your family. Your task is simply to set th
VR Alert MT5
Vladimir Pastushak
5 (2)
The VR Alert indicator utility is designed to monitor the price or other indicators and to inform the trader when the price or indicator reaches the given level. The signal levels can be set not only horizontally but also inclined. Thus, the trader gets the opportunity to receive notifications from the inclined trend levels. Thanks to the VR Alert utility, you will no longer need to sit near the monitor for a long time. You can calmly do about your household chores, perform your work duties and
VR Grid Mt5
Vladimir Pastushak
3.44 (9)
The indicator marks up charts in its own way. In contrast to the standard marking method, VR Grid marks chart with the specified step and links the grid to round price values. The VR Grid indicator keeps the mark up and scale, so that the grid cells always have a constant size. Advantages It builds a custom grid on the chart. The grid is linked to circular levels. It is possible to set any step for the grid. You can set the color, style, and thickness for the entire grid or for specific levels.
FREE
The VR Calculate Martingale indicator is a powerful order and position calculator for calculating profit or loss. With the help of the order and position calculator, a trader can calculate the average price of any forex currency, stocks or crypto currency. Now you can connect the indicator and start superimposing virtual orders on your real orders and positions. By creating additional virtual positions, you can calculate any development of the situation. The indicator has a built-in lot calculat
VR Color Levels est un outil pratique pour ceux qui appliquent l'analyse technique à l'aide d'éléments tels que la ligne de tendance, le rectangle et le texte. Il est possible d'ajouter du texte directement au graphique et de prendre des captures d'écran. Les paramètres, les fichiers de configuration, les versions de démonstration, les instructions, la résolution de problèmes peuvent être obtenus auprès de [Blog] Vous pouvez lire ou écrire des critiques sur [lien] Version pour [MetaTrader 5]
FREE
VR System
Vladimir Pastushak
VR System n'est pas seulement un indicateur, c'est un système commercial complet et bien équilibré pour négocier sur les marchés financiers. Le système est construit sur des règles de trading classiques et une combinaison d'indicateurs Moving Average et Donchian Channel . Le VR System prend en compte les règles d'entrée sur le marché, de maintien d'une position sur le marché et les règles de sortie d'une position. Des règles de trading simples, des risques minimes et des instructions claires fon
VR Ticks
Vladimir Pastushak
VR Ticks est un indicateur spécial pour les stratégies basées sur le scalping. Grâce à cet indicateur, le trader peut voir le graphique des ticks directement sur le graphique principal de l'instrument financier. Un graphique à ticks vous permet d'entrer une position sur le marché ou de clôturer une position sur le marché aussi précisément que possible. VR Ticks trace les données des tiques sous la forme de lignes qui changent de couleur en fonction de la direction - cela vous permet de comprendr
FREE
VR Close Orders MT5
Vladimir Pastushak
3 (2)
The VR Close orders script is designed to close positions in the terminal at a profit or loss mark set by the trader. The program is written as a script and can work together on the same chart with any other indicators and expert advisors. The program has a simple visual panel and is easy to configure with the mouse. With this program's help, the trader can automatically close positions and delete orders depending on the conditions set.  There is often a situation when you need to close position
FREE
VR Grid
Vladimir Pastushak
4.57 (7)
The indicator marks up charts in its own way. In contrast to the standard marking method, VR Grid marks chart with the specified step and links the grid to round price values. The VR Grid indicator keeps the mark up and scale, so that the grid cells always have a constant size. Advantages It builds a custom grid on the chart. The grid is linked to circular levels. It is possible to set any step for the grid. You can set the color, style, and thickness for the entire grid or for specific levels.
FREE
VR Object Delete All MT5
Vladimir Pastushak
5 (2)
The VR Object Delete All script solves the problem of garbage on the chart. it is often necessary to completely clear the chart of everything that is put on it, comments, lines, objects. The script completely deletes everything, even those objects that are not visible. When working, VR Object Delete All writes everything it does in the terminal log, as well as the names of objects to delete. Displays the number of deleted objects as a separate line. in case of any errors, it will display an erro
FREE
VR Orders History MT5
Vladimir Pastushak
3 (2)
The VR Orders History script is designed to upload a trade report to a csv file. This format is intended for additional analysis of trading history in programs such as EXCEL, Openoffice, and Libreoffice. Thanks to the script, it is now much easier for a trader to analyze their trading history. The program facilitates the analysis of the trading history for the MetaTrader 5 terminal. The trader sees structured trading. The entire report is based on the following principle: Position > Order on the
FREE
VR Close Orders
Vladimir Pastushak
3.5 (6)
The VR Close orders script is designed to close positions in the terminal at a profit or loss mark set by the trader. The program is written as a script and can work together on the same chart with any other indicators and expert advisors. The program has a simple visual panel and is easy to configure with the mouse. With this program's help, the trader can automatically close positions and delete orders depending on the conditions set.  There is often a situation when you need to close position
FREE
VR Orders History
Vladimir Pastushak
4.25 (8)
The VR Orders History script is designed to upload a trade report to a csv file. This format is intended for additional analysis of trading history in programs such as EXCEL, Openoffice, and Libreoffice. Thanks to the script, it is now much easier for a trader to analyze their trading history. The program facilitates the analysis of the trading history for the MetaTrader 5 terminal. The trader sees structured trading. The entire report is based on the following principle: Position > Order on the
FREE
VR Object Delete All
Vladimir Pastushak
5 (1)
The VR Object Delete All script solves the problem of garbage on the chart. it is often necessary to completely clear the chart of everything that is put on it, comments, lines, objects. The script completely deletes everything, even those objects that are not visible. When working, VR Object Delete All writes everything it does in the terminal log, as well as the names of objects to delete. Displays the number of deleted objects as a separate line. in case of any errors, it will display an erro
FREE
VR ATR Pro
Vladimir Pastushak
4.43 (7)
VR ATR Pro is a powerful professional tool for determination of target levels on a financial instrument. The indicator's effectiveness has been proved by thousands tests on real and demo accounts. VR ATR Pro is the indicator that works on real data using live true statistics. Statistics is stubborn, the usage of real statistical data in mathematical calculations allows you to calculate the exact target levels for a financial instrument. Pour un ensemble de fichiers, des instructions, un joli bon
Filtrer:
Oluseyi Elemosho
316
Oluseyi Elemosho 2021.08.18 19:53 
 

L'utilisateur n'a laissé aucun commentaire sur la note

Vladimir Pastushak
90025
Réponse du développeur Vladimir Pastushak 2021.08.19 09:51
Thank you!!
Andrey Ivanitsky
120
Andrey Ivanitsky 2021.04.27 21:09 
 

L'utilisateur n'a laissé aucun commentaire sur la note

Vladimir Pastushak
90025
Réponse du développeur Vladimir Pastushak 2021.04.28 07:25
Спасибо!
MAKARIOS YACOUBIAN
2891
MAKARIOS YACOUBIAN 2021.04.20 18:39 
 

L'utilisateur n'a laissé aucun commentaire sur la note

Vladimir Pastushak
90025
Réponse du développeur Vladimir Pastushak 2021.04.20 19:47
Thank you!!
varon
431
varon 2021.03.27 08:50 
 

L'utilisateur n'a laissé aucun commentaire sur la note

Vladimir Pastushak
90025
Réponse du développeur Vladimir Pastushak 2021.03.27 08:54
Thanks!
Vladimir Shumikhin
1963
Vladimir Shumikhin 2021.03.24 05:10 
 

L'utilisateur n'a laissé aucun commentaire sur la note

Vladimir Pastushak
90025
Réponse du développeur Vladimir Pastushak 2021.03.27 08:55
Спасибо!
Sergei Viakhirev
252
Sergei Viakhirev 2021.03.23 22:10 
 

L'utilisateur n'a laissé aucun commentaire sur la note

Vladimir Pastushak
90025
Réponse du développeur Vladimir Pastushak 2021.03.27 08:55
Спасибо!
Cleverson Santos
734
Cleverson Santos 2021.03.22 00:41 
 

L'utilisateur n'a laissé aucun commentaire sur la note

Vladimir Pastushak
90025
Réponse du développeur Vladimir Pastushak 2021.03.22 08:58
Thank!
Répondre à l'avis
Version 23.20 2023.02.13
Increased the speed of the indicator;
Added the ability to select the type of price display. It can be text, or an icon;
Version 21.80 2021.08.17
The program is compiled in the latest version of the MetaTrader terminal