DYJ Trend Analyst

5
Notre objectif est de fournir un service accessible et de qualité, de fournir aux participants du marché, aux traders et aux analystes, des outils indispensables pour des décisions de trading informées et opportunes.

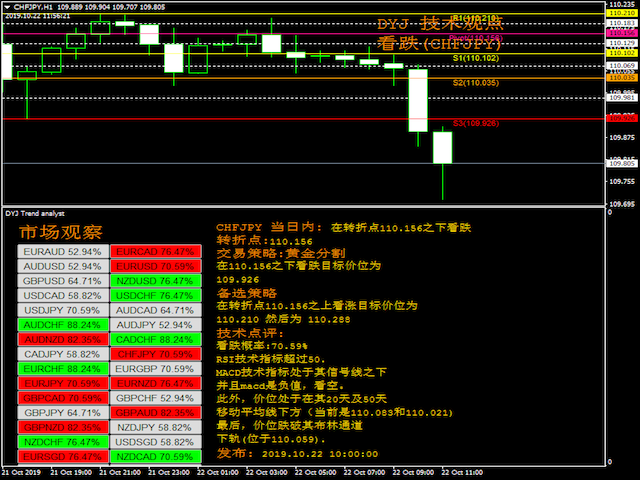
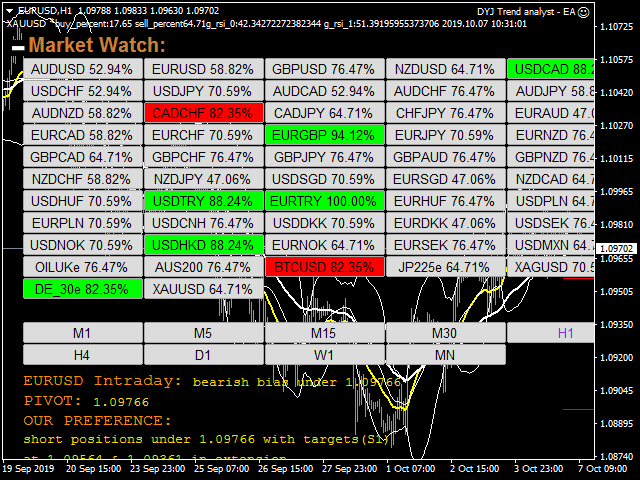
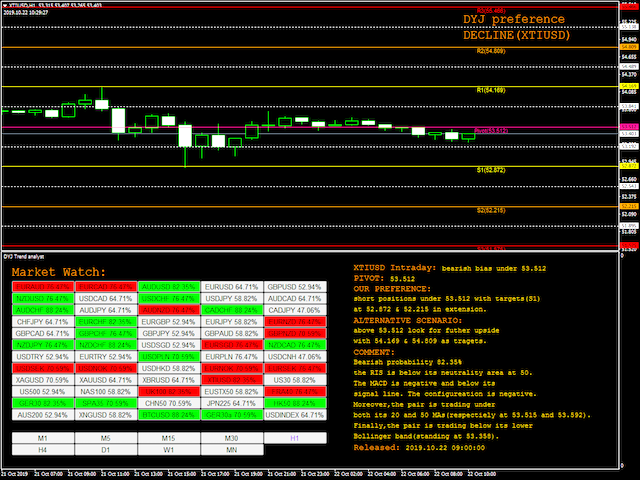
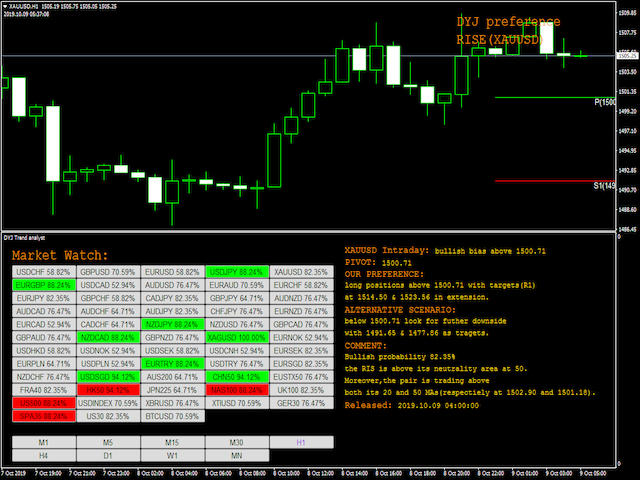
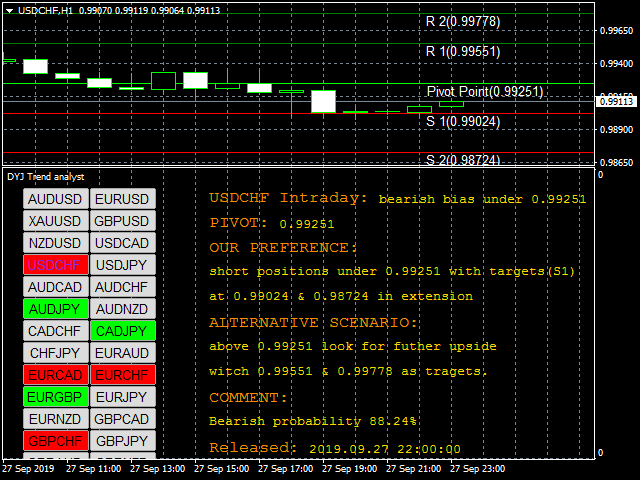
L'indicateur d'analyste DYJ Trend le plus optimisé, le plus robuste et le plus facile à utiliser.

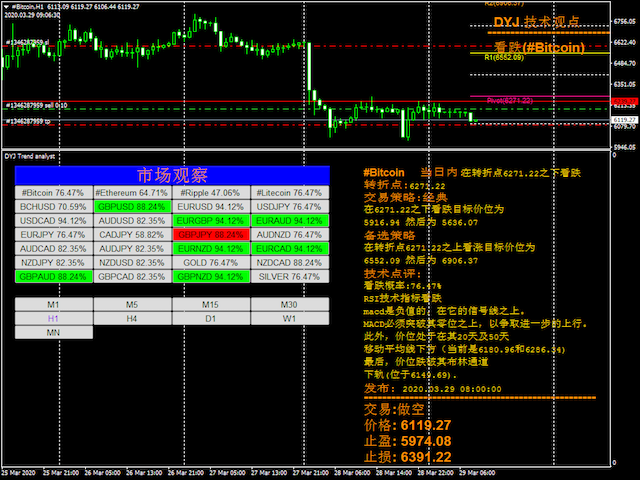
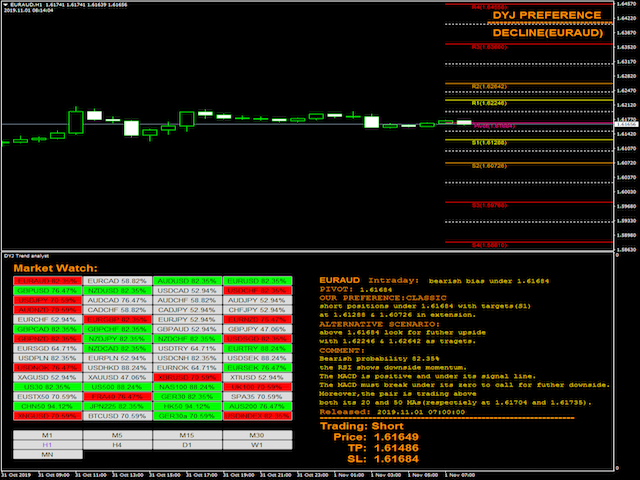
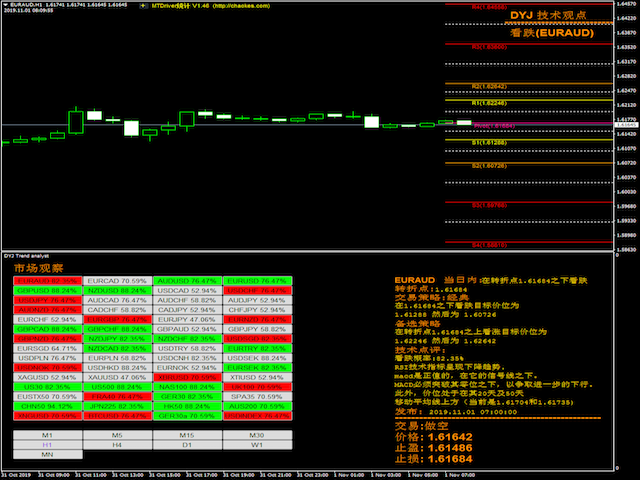
L'analyste de DYJ Trend tente d'évaluer les forces haussières et baissières du marché en utilisant deux mesures distinctes, une pour chaque type de pression directionnelle.

Le BearsIndex de l'indicateur tente de mesurer l'appétit du marché pour des prix plus bas.

Le BullsIndex de l'indicateur tente de mesurer l'appétit du marché pour des prix plus élevés.

Indicateur supplémentaire de point de pivot pour l'analyste de tendance DYJ.

Notre indicateur de point pivot est basé sur un algorithme avancé de calcul du point pivot et des niveaux de support et de résistance.

Prédiction incroyablement précise des futurs niveaux de prix importants et des renversements possibles du marché.

Utile pour tous les marchés (forex, matières premières, actions, indices et autres) et toutes les périodes .

Caractéristiques

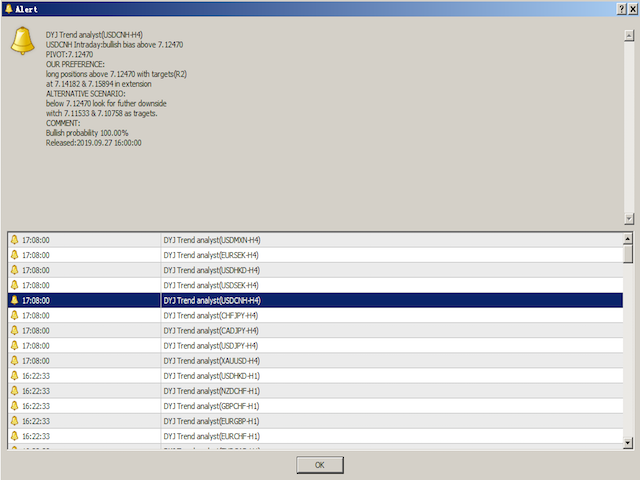
Surveille toutes les paires en même temps.
L'indicateur surveille les paires MaekingWatch par défaut.

Il s'exécute uniquement à partir d'un graphe (M1 à MN).

Parameter:

  • InpLanguage = English  --  English or Chinese
  • InpCalculationMode = CALC_MODE_CLASSIC   --  Classic,Camarilla,Woodie,Fibonacci,Floor,Fibonacci retraction
  • InpPivotLineType = PIVOT_TREND --  PIVOT_TREND or PIVOT_HLINE
  • InpEntryPercent = Min_70  -- Trend percentage requirements 70% or more.
  • InpSelecttrend = WeakTrend  -- Select trend. DoNotUseThis to ExtremelyStrongTrend.
  • Wait_Mins_For_Next_Signal     = 30  -- The next signal occurs 30 minutes later
  • ISALARM        = false -- Snow_Alert
  • Send_Email   = false -- SendEmail
  • Mobile_Alert = false -- MobileAlert
  • ButtonsInARow = 5 --  Buttons in a horizontal row


Avis 1
cam028
6487
cam028 2021.12.23 06:48 
 

good product great support

Produits recommandés
PZ 123 Pattern
PZ TRADING SLU
1 (1)
Unlock powerful breakout opportunities The 123 Pattern is one of the most popular, powerful and flexible chart patterns. The pattern is made up of three price points: a bottom, a peak or valley, and a Fibonacci retracement between 38.2% and 71.8%. A pattern is considered valid when the price breaks beyond the last peak or valley, moment at which the indicator plots an arrow, rises an alert, and the trade can be placed. [ Installation Guide | Update Guide | Troubleshooting | FAQ | All Products  ]
Blahtech Market Profile
Blahtech Limited
4.53 (15)
Was: $249  Now: $99   Market Profile defines a number of day types that can help the trader to determine market behaviour. A key feature is the Value Area, representing the range of price action where 70% of trading took place. Understanding the Value Area can give traders valuable insight into market direction and establish the higher odds trade. It is an excellent addition to any system you may be using. Blahtech Limited presents their Market Profile indicator for the MetaTrader community. Ins
AW Candle Patterns MT4
AW Trading Software Limited
L'indicateur AW Candle Patterns est une combinaison d'un indicateur de tendance avancé combiné à un puissant scanner de modèles de bougies. C'est un outil utile pour reconnaître et mettre en évidence les trente modèles de chandeliers les plus fiables. De plus, c'est un analyseur de tendance actuel basé sur des barres colorées avec un       panneau de tendance multi-période plug-in qui peut être redimensionné et positionné. Une possibilité unique d'ajuster l'affichage des motifs en fonction du fi
Cosmic Diviner X Planet
Olena Kondratenko
4 (2)
This unique multi-currency strategy simultaneously determines the strength of trends and market entry points, visualizing this using histograms on the chart. The indicator is optimally adapted for trading on the timeframes М5, М15, М30, Н1. For the convenience of users, the indicator renders the entry point (in the form of an arrow), recommended take profit levels (TP1, TP2 with text labels) and the recommended Stop Loss level. The take profit levels (TP1, TP2) are automatically calculated for
Alpha Trend sign est notre outil de Trading très populaire depuis longtemps, il valide notre système de Trading et invite clairement les signaux de Trading sans dérive. Fonctions principales: • En fonction de la zone active du marché, selon les indicateurs, il est intuitif de déterminer si le cours actuel appartient à la tendance ou à la tendance. Et coupez le marché selon les flèches d'indication de l'indicateur, les flèches vertes suggèrent d'acheter et les flèches rouges suggèrent de vend
Fibonacci retracement and extension line drawing tool Fibonacci retracement and extended line drawing tool for MT4 platform is suitable for traders who use  golden section trading Advantages: There is no extra line, no too long line, and it is easy to observe and find trading opportunities Trial version: https://www.mql5.com/zh/market/product/35884 Main functions: 1. Multiple groups of Fibonacci turns can be drawn directly, and the relationship between important turning points can be seen
Daily Candle Predictor est un indicateur qui prédit le cours de clôture d'une bougie. L'indicateur est principalement destiné à être utilisé sur les graphiques D1. Cet indicateur convient à la fois au trading forex traditionnel et au trading d'options binaires. L'indicateur peut être utilisé comme un système de trading autonome, ou il peut servir de complément à votre système de trading existant. Cet indicateur analyse la bougie actuelle, calcule certains facteurs de force à l'intérieur du corps
Overview Base Box Indicator automatically detects and draws institutional supply and demand base zones using the Rally-Base-Rally (RBR) and Drop-Base-Drop (DBD) price action methodology — one of the most reliable frameworks for identifying high-probability reversal and continuation areas. Unlike basic support/resistance tools, this indicator isolates the precise consolidation phase (the "Base") between two impulse moves and renders it as a structured 3-layer box that separates candle bodies from
Gold Phoenix
Yaroslav Varankin
The perfect tool for Scalng in the Forex markets You can trade both from signal to signal and using take profit  The algorithm does not use Zigzag!  No redrawing!  This is a channel instrument that uses a moving average as a filter. Moving Average  There are 2 parameters for the settings Ma Period = 5 period Moving Average  Channel 1.0 distance of channel lines from the chart Price Signal Filter - calculation of signal opening and filter There is a complete set of Alert There is a multi-timefram
Binary Options Support Resistance Indicator This indicator is designed for binary options trading and effectively shows retracements from support and resistance levels. Signals appear on the current candle. A red arrow pointing downwards indicates a potential selling opportunity, while a blue arrow pointing upwards suggests buying opportunities. All that needs adjustment is the color of the signal arrows. It is recommended to use it on the M1-M5 timeframes as signals are frequent on these timef
Indicateur de gestion du risque et de suivi des limites pour traders professionnels et comptes d’évaluation (Prop) Cet outil affiche uniquement sur le graphique des informations précises de gestion du risque et de limites afin de vous aider à décider avec plus de concentration. L’indicateur n’ouvre/ferme/modifie aucune position et n’interfère pas avec les Expert Advisors. Fonctionnalités Suivi du drawdown quotidien et total Calcule et affiche le drawdown quotidien et total sur la base du solde
Market Overview MT4
Mehran Sepah Mansoor
5 (1)
Optimisez vos décisions de trading avec notre indicateur de force et de sentiment du marché et ne tradez plus à contre-courant! Méticuleusement conçu pour les traders sérieux qui apprécient les informations précises et opportunes, notre indicateur fournit une vue d'ensemble des 28 paires principales d'une manière très simple. Cet outil est capable de classer les paires de devises en fonction de leur popularité, de la force de la tendance haussière ou baissière et du pourcentage d'acheteurs et
The indicator determines the state of the market: trend or flat. The state of the market is determined by taking into account volatility. The flat (trading corridor)is displayed in yellow. The green color shows the upward trend. The red color shows the downward trend. The height of the label corresponds to the volatility in the market. The indicator does not redraw . Settings History_Size   - the amount of history for calculation. Period_Candles  - the number of candles to calculate the indicat
This is the FXTraderariel-TakeProfit - Stop Loss Indicator . It provides you 3 potential Take Profits and 1 Stop Loss. These potential targets are computed based on several methods . The indicator can be used on every time frame, but we advise to use it on H1, H4 and D1. Especially if you are a novice trader. Pro Traders can also you use it for scalping in smaller time frames (M1, M5 and M15). This indicator is not a complete trading system. It doesn't provide you a Signal nor can predict the m
L'indicateur construit les cotations actuelles, qui peuvent être comparées aux cotations historiques et, sur cette base, faire une prévision de l'évolution des prix. L'indicateur dispose d'un champ de texte pour une navigation rapide jusqu'à la date souhaitée. Option : Symbole - sélection du symbole que l'indicateur affichera ; SymbolPeriod - sélection de la période à partir de laquelle l'indicateur prendra des données ; IndicatorColor - couleur de l'indicateur ; HorisontalShift - décalage
1. Going offline means that the market is in a wait-and-see state. In this situation, it is common to choose to wait and see rather than taking immediate action to wait for more market information or trend confirmation in order to make wiser decisions. 2.When there is a trend of going up and down, the market shows a bullish signal. At this point, investors may consider entering the market in hopes of future price increases and profits. 3.When the market situation is online, it will once again t
RSI Speed mp
DMITRII GRIDASOV
Indicateur Crypto_Forex « RSI SPEED » pour MT4 : excellent outil prédictif, sans retouche. - Le calcul de cet indicateur est basé sur des équations physiques. Le RSI SPEED est la dérivée première du RSI lui-même. - Le RSI SPEED est idéal pour scalper les entrées dans la direction de la tendance principale. - Utilisez-le en combinaison avec un indicateur de tendance approprié, par exemple HTF MA (comme sur les images). - L'indicateur RSI SPEED indique la vitesse à laquelle le RSI change de dire
The Arrows Forecasters indicator is simple, visual and effective trend detection. The intelligent algorithm of the indicator determines the trend with a good probability. Uses just one parameter for settings. The indicator shows the points of potential market reversal. Ready-made trading system. The indicator does not redraw and does not lag. Works on all currency pairs and on all timeframes. You should remember that using a combination of forecasting tools, it is advisable to choose 2-3 indic
FiboZag
Andriy Sydoruk
Indicator FiboZag - transfer the indicator to the chart and the Fibonacci levels will be built automatically on the last ZigZag turn. The main advantage lies in the correct construction of Fibonacci levels and markup of price levels. Simple, visual and effective use. The indicator is not redrawn and does not lag. Works on all currency pairs and on all timeframes.
TrendCand
Andriy Sydoruk
This trend indicator shows successful signals. It can be used with an optimal risk/reward ratio. The efficiency rate of the trend is 80%. The product shows the best opportunity to enter the market using the arrows. The indicator can be used for pipsing on small periods, as well as for the long-term trade. The indicator uses two parameters for the settings. The indicator does not redraw and lag. Take profit exceeds stop loss by 6-8 times on average! The product works on all currency pairs and all
Volume Profile Sniper v11. 1-un outil Complet pour l'analyse du marché Approche professionnelle du commerce Volume Profile Sniper V11.1 combine plus de 15 filtres clés dans un seul indicateur, fournissant des signaux clairs basés sur une évaluation complète de la situation du marché. Principales caractéristiques Analyse du déséquilibre volumétrique-l'algorithme calcule la proportion d'acheteurs et de vendeurs dans chaque bougie, signalant la prédominance de l'une des parties (seuil configurabl
VR Cub
Vladimir Pastushak
VR Cub est un indicateur permettant d'obtenir des points d'entrée de haute qualité. L'indicateur a été développé pour faciliter les calculs mathématiques et simplifier la recherche de points d'entrée dans un poste. La stratégie de trading pour laquelle l'indicateur a été rédigé prouve son efficacité depuis de nombreuses années. La simplicité de la stratégie de trading est son grand avantage, qui permet même aux traders débutants de négocier avec succès avec elle. VR Cub calcule les points d'ouve
The CCI Divergence is a reasonably useful indicator in itself, but it is even more effective when used with divergence pattern trading. The CCI Divergence indicator signal is one of the most potent signals among the indicators that exist in the market. Here is new version for Divergence Indicator using CCI method, with more improvements. Divergences indicate a potential investment point because the directional moment does not confirm the price. A bullish divergence occurs when the underlying va
Volume Compair
Thiago Pereira Pinho
5 (1)
Professional Cumulative Delta & Volume Median Indicator Track   real buying/selling pressure   with this powerful volume analysis tool. The   Volume Compare Indicator   combines   Cumulative Delta   and   Volume Medians   to help you identify institutional activity, imbalances, and potential reversals. Key Features: Cumulative Delta Histogram   – Visualizes net buying vs. selling volume in real-time. Buy/Sell Volume Medians   – Horizontal lines showing average buy & sell volume levels. Smart Vo
Support and Resistance is a very important reference for trading.  This indicator provides customized support and resistance levels, automatic draw line and play music functions.  In addition to the custom RS, the default RS includes Pivot Point, Fibonacci, integer Price, MA, Bollinger Bands. Pivot Point is a resistance and support system. It has been widely used at froex,stocks, futures, treasury bonds and indexes. It is an effective support resistance analysis system. Fibonacci also known as t
BoxChart MT4
Evgeny Shevtsov
4.4 (5)
The market is unfair if only because 10% of participants manage 90% of funds. An ordinary trader has slim changes to stand against these "vultures". This problem can be solved. You just need to be among these 10%, learn to predict their intentions and move with them. Volume is the only preemptive factor that faultlessly works on any timeframe and symbol. First, the volume appears and is accumulated, and only then the price moves. The price moves from one volume to another. Areas of volume accumu
EZZ Zig Zag MT4
Paulo Rocha
5 (1)
EZZ Elite Zig Zag is an indicator for the MetaTrader 4 terminal. This indicator traces the peak of the trend based on the market reversal, thus showing various opportunities in the financial market. EZZ Elite Zig Zag is a visual tool, intuitive, and easy to understand and use.  Test it Yourself by Downloading it for Free. Author Paulo Rocha all rights reserved
The Sensitive Volume indicator is an indicator designed to generate trading signals. The purpose of this indicator is to generate signals from the highest probability of trading. Using a number of price movements and a set of indicator properties to generate these signals.  Easy to use, simple and understandable to the user. With alert features, user signals can be reached quickly.  Visually the user can easily recognize the signals. This indicator will not repaint. Parameters Trend_Period - pe
Rira Renko
Vitor Palmeira Abbehusen
RENKO on Time Chart This indicator is an enhanced Renko, so you can watch the Renko bricks on the chart to understand price movement more clearly the other improvement is automated box size according to ATR (Average True Range) period you can set the ATR number as you want and the box size of Renko changes automatically based on price movement Inputs Mode: Box size is the input to specify the size of the Renko box you want to print on the chart. This input lets you choose the fixed box siz
Golden Signal
Yaroslav Varankin
This is a tool for trading binary options and Forex. Benefits No redrawing  Accurate good signals Can be used with support and escort levels the result is a good strategy It can supplement any strategy as it perfectly determines the market reversal With cons  There are unprofitable trades Parameters The best settings are set by default There are all the alerts you need to work comfortably with the instrument ...
Les acheteurs de ce produit ont également acheté
Gann Made Easy
Oleg Rodin
4.83 (162)
Gann Made Easy est un système de trading Forex professionnel et facile à utiliser qui est basé sur les meilleurs principes de trading en utilisant la théorie de mr. WD Gann. L'indicateur fournit des signaux d'ACHAT et de VENTE précis, y compris les niveaux Stop Loss et Take Profit. Vous pouvez échanger même en déplacement en utilisant les notifications PUSH. VEUILLEZ ME CONTACTER APRÈS L'ACHAT POUR RECEVOIR GRATUITEMENT DES INSTRUCTIONS DE TRADING ET D'EXCELLENTS INDICATEURS SUPPLÉMENTAIRES! Vou
The Propfolio Master Suite is the ultimate all-in-one analytical workstation for professional traders. Combining the power of the Beat The Market Maker (BTMM) methodology, Smart Money Concepts (SND/Liquidity), and Advanced Volume Profile, this suite replaces multiple different indicators with one optimized engine. Monitor up to 14 pairs simultaneously from a single chart, instantly identify market cycles, and seamlessly map institutional footprints with the click of a button. The Command Center
Scalper Inside PRO
Alexey Minkov
4.74 (69)
Scalper Inside PRO Scalper Inside PRO is an intraday trend and scalping indicator for MetaTrader 4 that uses an exclusive algorithm to quickly detect market direction and key target levels. It automatically calculates entry, exit and multiple profit targets, and shows detailed performance statistics so you can see how different instruments and strategies performed. This helps you choose the most suitable trading instruments for the current market conditions. Additionally, you can easily integrat
PZ Harmonacci Patterns
PZ TRADING SLU
3.17 (6)
Trade smarter, not harder: Empower your trading with Harmonacci Patterns This is arguably the most complete harmonic price formation auto-recognition indicator you can find for the MetaTrader Platform. It detects 19 different patterns, takes fibonacci projections as seriously as you do, displays the Potential Reversal Zone (PRZ) and finds suitable stop-loss and take-profit levels. [ Installation Guide | Update Guide | Troubleshooting | FAQ | All Products  ] It detects 19 different harmonic pric
M1 Sniper
Oleg Rodin
5 (23)
M1 SNIPER est un système d'indicateurs de trading facile à utiliser. Il s'agit d'un indicateur à flèche conçu pour l'unité de temps M1. Cet indicateur peut être utilisé seul pour le scalping sur l'unité de temps M1 ou intégré à votre système de trading existant. Bien que conçu spécifiquement pour le trading sur l'unité de temps M1, ce système peut également être utilisé avec d'autres unités de temps. Initialement, j'avais conçu cette méthode pour le trading du XAUUSD et du BTCUSD. Cependant, je
Auto Optimized Parabolic RSI : Moteur de Momentum 3D Avancé La plupart des indicateurs pour les particuliers échouent car ils s'appuient sur des paramètres statiques qui se brisent dès que la volatilité du marché change. L'Auto Optimized Parabolic RSI résout le problème de l'« obsolescence des indicateurs » en recalculant continuellement son propre avantage mathématique, apportant une adaptation quantitative de niveau institutionnel directement sur votre terminal MT5. L'Avantage Principal : Opti
NAM Order Blocks
NAM TECH GROUP, CORP.
3.67 (3)
MT4 Multi-timeframe Order Blocks detection indicator. Features - Fully customizable on chart control panel, provides complete interaction. - Hide and show control panel wherever you want. - Detect OBs on multiple timeframes. - Select OBs quantity to display. - Different OBs user interface. - Different filters on OBs. - OB proximity alert. - ADR High and Low lines. - Notification service (Screen alerts | Push notifications). Summary Order block is a market behavior that indicates order collection
Quants HL Break
Ferhat Mutlu
5 (2)
Calcul avancé effectué par l'action pure des prix pour trouver les cassures LH et HL. Cela vous donnera d'excellents points d'inversion sur le marché.Les signaux LH et HL peuvent également être utilisés pour les évasions de traingle. Une fois que la cassure se produit, cela indique un fort renversement.Beau filtre pour les moyennes mobiles.Je suggère fortement de l'utiliser avec des indicateurs de tendance. Peut être utilisé comme une confirmation supplémentaire pour le support et la résistanc
Dynamic Forex28 Navigator
Bernhard Schweigert
4.43 (7)
Dynamic Forex28 Navigator - L'outil de trading Forex de nouvelle génération. ACTUELLEMENT 49 % DE RÉDUCTION. Dynamic Forex28 Navigator est l'évolution de nos indicateurs populaires de longue date, combinant la puissance de trois en un : Advanced Currency Strength28 Indicator (695 avis) + Advanced Currency IMPULSE avec ALERT (520 avis) + CS28 Combo Signals (Bonus). Détails sur l'indicateur https://www.mql5.com/en/blogs/post/758844 Qu'offre l'indicateur de force de nouvelle génération ? Tout
Le système PRO Renko est un système de trading très précis spécialement conçu pour le trading de graphiques RENKO. Il s'agit d'un système universel qui peut être appliqué à divers instruments de négociation. Le système neutralise efficacement ce qu'on appelle le bruit du marché en vous donnant accès à des signaux d'inversion précis. L'indicateur est très facile à utiliser et n'a qu'un seul paramètre responsable de la génération du signal. Vous pouvez facilement adapter l'outil à n'importe que
RFI levels PRO
Roman Podpora
5 (1)
L'indicateur montre avec précision les points de retournement et les zones de retour des prix où le       Acteurs majeurs   . Vous repérez les nouvelles tendances et prenez des décisions avec une précision maximale, en gardant le contrôle de chaque transaction. VERSION MT5     -     Révèle son potentiel maximal lorsqu'il est combiné à l'indicateur   TREND LINES PRO Ce que l'indicateur montre : Structures et niveaux d'inversion avec activation au début d'une nouvelle tendance. Affichage des nive
Apollo SR Master est un indicateur de support/résistance doté de fonctionnalités spéciales qui simplifient et fiabilisent le trading basé sur les zones de support/résistance. Cet indicateur calcule ces zones en temps réel, sans aucun décalage, en détectant les sommets et les creux locaux des prix. Pour confirmer la nouvelle zone de support/résistance, il affiche un signal spécifique indiquant que cette zone peut être prise en compte et utilisée comme un véritable signal d'achat ou de vente. Dans
Si vous achetez cet indicateur, vous recevrez mon Gestionnaire de Trading Professionnel   + EA  GRATUITEMENT. Tout d'abord, il convient de souligner que ce système de trading est un indicateur non repeint, non redessiné et non retardé, ce qui le rend idéal pour le trading manuel et automatisé. Cours en ligne, manuel et téléchargement de préréglages. Le "Système de Trading Smart Trend MT5" est une solution de trading complète conçue pour les traders débutants et expérimentés. Il combine plus de
Signal GoldRush Trend Arrow L'indicateur GoldRush Trend Arrow Signal fournit une analyse précise et en temps réel des tendances, spécialement conçue pour les scalpers à haute vitesse et à court terme sur la paire XAU/USD. Conçu spécialement pour les intervalles de temps d'une minute, cet outil affiche des flèches directionnelles indiquant clairement les points d'entrée, ce qui permet aux scalpers de naviguer en toute confiance dans des conditions de marché volatiles. L'indicateur se compose
ACTUELLEMENT 40% DE RÉDUCTION La meilleure solution pour tout débutant ou trader expert ! Cet indicateur est un outil de trading unique, de haute qualité et abordable car nous avons incorporé un certain nombre de caractéristiques exclusives et une nouvelle formule. Avec seulement UN graphique, vous pouvez lire la force de la devise pour 28 paires Forex ! Imaginez comment votre trading va s'améliorer parce que vous êtes capable de repérer le point de déclenchement exact d'une nouvelle tendance
CRT Candle Range Theory HTF MT4.   Ultimate CRT Indicator: Advanced ICT Concepts and Malaysian SnR Trading System Discounted   Price   $50  !!     Secure your lifetime access   now   before it switches to   subscription-only ! Master the Market Maker's Footprints with the Most Advanced Candle Range Theory Indicator Unlock the true power of   Smart Money Concepts (SMC)   and trade precisely like the institutions with the   Ultimate CRT Indicator . Built exclusively for serious traders, this indic
Market Structure Patterns MT4
Samuel Manoel De Souza
5 (18)
Market Structure Patterns   est un indicateur basé sur les   Smart Money Concepts   qui affiche les   éléments SMC/ICT   pouvant améliorer vos décisions de trading. Profitez des   alertes ,   notifications push   et   emails   pour être informé lorsqu’un élément se forme sur le graphique, que le prix franchit un niveau et/ou entre dans une zone. Les développeurs peuvent accéder aux valeurs des éléments de l’indicateur via les   variables globales , permettant l’automatisation des décisions de tr
Advanced Supply Demand
Bernhard Schweigert
4.91 (300)
Offre spéciale : 40 % de réduction La solution idéale pour les traders débutants comme experts ! Cet indicateur est un outil de trading unique, performant et abordable grâce à l’intégration de nombreuses fonctionnalités exclusives et d’une nouvelle formule. Cette mise à jour vous permet d’afficher des zones sur deux unités de temps. Vous pourrez ainsi visualiser non seulement une unité de temps supérieure, mais aussi l’unité de temps du graphique, ainsi que l’unité de temps supérieure : des z
Identify key turning points with reliable fractal analysis This indicator examines the price structure of fractals of different periods to determine possible reversal points in the market, providing timing to positional traders that already have a fundamental or technical valuation model. Unlike its younger brother, Reversal Fractals , this indicator won't miss reversals because of the period selected, and will find reversal fractals on a zig-zag fashion, ignoring those reversals which do not
Si vous tradez sur le marché du Forex, disposer d'informations détaillées sur la force des devises et la corrélation entre les paires de devises peut élever votre trading à un niveau supérieur. La corrélation vous aidera à réduire votre risque de moitié, tandis que l'analyse de la force maximisera vos profits. Cet indicateur propose une approche hybride pour sélectionner les paires de devises les plus appropriées en combinant l'analyse de la force des devises et la corrélation des paires. Comme
Trend Catcher ind
Ramil Minniakhmetov
INDICATEUR DE DÉTECTEUR DE TENDANCE L'indicateur de détecteur de tendance analyse les mouvements de prix du marché grâce à une combinaison d'indicateurs d'analyse de tendance adaptatifs, propriétaires et personnalisés. Il identifie la véritable direction du marché en filtrant les fluctuations à court terme et en se concentrant sur la force de la dynamique sous-jacente, l'expansion de la volatilité et la structure des prix. Il utilise également une combinaison d'indicateurs personnalisés de lis
Day Trader Master est un système de trading complet pour les day traders. Le système se compose de deux indicateurs. Un indicateur est un signal fléché pour acheter et vendre. C'est l'indicateur de flèche que vous obtenez. Je vous fournirai le deuxième indicateur gratuitement. Le deuxième indicateur est un indicateur de tendance spécialement conçu pour être utilisé conjointement avec ces flèches. LES INDICATEURS NE RÉPÉTENT PAS ET NE TARDENT PAS! L'utilisation de ce système est très simple. Il v
KURAMA GOLD SIGNAL PRO (MT4) — Système de Trading XAUUSD Complet avec Filtre à 7 Couches, TP/SL Automatique et Notation de Qualité PAS DE REPAINT. PAS DE REDESSIN. PAS DE RETARD. Chaque signal est permanent. Ce que vous voyez est ce que vous obtenez. BONUS : Achetez la licence à vie et recevez AI Zone Radar (valeur $59) + manuel PDF complet GRATUIT. Envoyez-moi un message après l'achat. AI Zone Radar : https://www.mql5.com/en/market/product/175834 CONFIANCE DES TRADERS : Déjà utilisé par une
L'indicateur « Dynamic Scalper System » est conçu pour la méthode de scalping, permettant de trader au sein des vagues de tendance. Testé sur les principales paires de devises et l'or, il est compatible avec d'autres instruments de trading. Fournit des signaux pour l'ouverture de positions à court terme le long de la tendance, avec un support supplémentaire pour les fluctuations de prix. Principe de l'indicateur : De grandes flèches déterminent la direction de la tendance. Un algorithme de gén
Master head and shoulders patterns for better trading decisions A head and shoulders pattern is a chart formation that resembles a baseline with three peaks, the outside two are close in height and the middle is highest. It predicts a bullish-to-bearish trend reversal and is believed to be one of the most reliable trend reversal patterns. It is one of several top patterns that signal, with varying degrees of accuracy, that a trend is nearing its end. [ Installation Guide | Update Guide | Trouble
PZ Double Top Bottom
PZ TRADING SLU
5 (1)
Trade double tops and bottoms effectively The PZ Double Top/Bottom Indicator is a technical analysis tool that helps traders identify potential price reversal patterns in the market. These patterns, known as double tops and bottoms, are characterized by two consecutive peaks or valleys in the price of an asset. Double tops and bottoms are often seen as potential reversal patterns because they can signal a change in the direction of the current trend. [ Installation Guide | Update Guide | Troubl
Special offer : ALL TOOLS , just $35 each! New tools   will be   $30   for the   first week   or the   first 3 purchases !  Trading Tools Channel on MQL5 : Join my MQL5 channel to update the latest news from me L'Indicateur de Modèle de Renversement en Trois Barres offre un outil puissant pour les traders, identifiant et mettant en évidence automatiquement les modèles de renversement en trois barres directement sur le graphique des prix. Cet indicateur est une ressource précieuse pour détecter
Gold Scalper Super
Aleksandr Makarov
5 (2)
Gold Scalper Super is an easy-to-use trading system. The indicator can be used as a standalone scalping system on the M1 time frame, as well as part of your existing trading system. Bonus: when purchasing an indicator, Trend Arrow Super is provided free of charge, write to us after purchase. The indicator 100% does not repaint!!! If a signal appears, it does not disappear! Unlike indicators with redrawing, which lead to the loss of a deposit, because they can show a signal and then remove it.
Un indicateur technique qui structure les graphiques et identifie les mouvements de prix cycliques. Peut fonctionner sur n'importe quel graphique. Plusieurs types de notifications. Il y a des flèches supplémentaires sur le graphique lui-même. Sans revenir sur l'histoire, fonctionne sur la fermeture de la bougie. TF recommandé à partir de M5 et plus. Facile à utiliser et à configurer les paramètres. Lorsque vous utilisez 2 indicateurs avec des paramètres différents, vous pouvez les utiliser sans
KuKl
IGOR KIRIANEN
The indicator is built on a non-standard Zig Zag, it draws accumulations after which if the price leaves this zone and a test of this zone occurs, then a sound signal is given and an arrow appears - after the test candle closes.The indicator does not redraw its signals, it is very easy to use, there are only three settings 1- this is the zig zag parameter 2- this is the minimum price exit from the zone 3- this is the maximum price exit from the zone. The lower the parameter for Zig Zag, the more
Plus de l'auteur
DYJ CashGaming
Daying Cao
1 (1)
Dyj cashgamingea travaille sur les indicateurs techniques de dyj. Lorsque les marchés sont forts, il s'agit de rechercher des opportunités et des transactions sur des marchés sûrs. Les avantages sont compatibles avec les heures de négociation sécuritaires. L'EE utilise le modèle de commande unique pour minimiser le volume des transactions et maximiser la stratégie de l'algorithme de règlement des bénéfices. L'EE utilise une stratégie de jeu: Utilisez le bénéfice cible ou TP pour fermer lorsque l
QuickClose: Instant Order Management Made Simple QuickClose   allows you to instantly close all orders with a single click. It operates at high speed, giving you the flexibility to close orders for a specific symbol or all symbols at once. This makes trade management significantly faster and more efficient. This   Expert Advisor can swiftly close all buy and sell orders either for a selected symbol or across all trades. The   SymbolButton is specifically designed for order closure, featuring bo
Professional traders know that a reversal in market price is the best entry points to trade. The trend changes K line state changes the most obvious. The SoarSignal is good to identify these changes, because we have incorporated the KDJ indicators. It is the closest to the K line state of the indicators. The two lines of KDJ Winner move within a range of 0 and 100. Values above 80 are considered to be in overbought territory and indicate that a reversal in price is possible. Values below 20 are
StrongCurrency
Daying Cao
5 (1)
This StrongCurrency is a complete trading system based on a variety of technical indicators, moving averages and pivots. Each of those elements can be assessed in defined rules and coefficients (depending on the indicator) providing limitless optimization scenarios for the StrongCurrency. In order to work the StrongCurrency creates a trend strength and entry point signal list display by evaluating these data, that takes data from all symbols. It extrapolates all the information in order to get t
PowerSignal
Daying Cao
5 (1)
Ce PowerSignal est un système de trading complet basé sur l'ATR d'indicateurs techniques. Ces indicateurs enregistreront l'état actuel de chaque POWERTREND dans chaque période et paire de devises analysées. Le PowerSignal crée un affichage de la force de tendance et de la liste des points d'entrée en évaluant ces données. S'il y a une coïncidence totale sur une paire, une alerte apparaîtra indiquant un tel cas. Les données de liste incluent Symbol, M5-MN1, BuyPercent, SellPercent, LastEntry. Le
This indicator shows the crossing between two moving averages, a slower and faster moving average. Signal show alert pop-up, when MA1 crosses above the MA2. Signal show alert pop-up, when MA1 crosses below the MA2. Inputs Value Fast MA Setup Period = 5 - period of Faster Moving Average (value 5). Mode = SMA - type of Moving Average (SMA, EMA, SMMA, LWMA). Price = Close - type of price (Close, Open, Low, High, Median, Typical, Weighted). Slow MA Setup Period = 10 - period of Slower MA (value 10)
This EA is based on the classical trend-following system of opening the positions. The EA is based on DYJ TwoMACrossAlarm and ATR and CCI indicator. It uses two moving averages. The EA uses dynamic allocation MA period. The MA1 and MA2 period is the Fibonacci sequence, such as 5.8 or 13.21 or 21.34 or...; EA Entry Rules: Go long when fast MA1 crosses above the slow MA2 and CCI crosses above the zero line; Go short when fast MA1 crosses below the slow MA2 and CCI crosses below the zero line; the
DYJ news foreign exchange factory est l'indicateur de base de l'analyse du marché pour les outils de transaction de calendrier et les événements macroéconomiques. Ici, vous pouvez trouver les nouvelles financières et les indicateurs des plus grandes économies du monde - des États-Unis et de l'union européenne à l'Australie et au Japon, il y a neuf économies impliquant plus de 60 paires de devises. Plus de 800 indicateurs et événements macroéconomiques ont été recueillis en temps réel auprès de
This indicator shows the crossing between three moving averages (slower, middle and faster ones). When fast MA crosses up middle MA and middle MA crosses up slow MA, the bullish alert is issued. When fast MA crosses down middle MA and middle MA crosses down slow MA, the bearish alert is issued. Signals to close buy positions are generated if fast MA crosses middle MA downwards, signals to close sell positions are generated if fast MA crosses middle MA upwards. Inputs Fast MA Setup MAPeriod1 = 5
The Expert Advisor is based on three Moving Average indicators. ThreeMACross is based on the following idea: crossing of three Moving Average lines (Fast, Middle and slow ones) is used as a signal for opening and closing a position together. Go Long when Fast MA (MA1) crosses above Middle MA (MA2), and Middle MA (MA2) crosses above Slow MA (MA3). Go Short when Fast MA (MA1) crosses below Middle MA (MA2), and Middle MA (MA2) crosses below Slow MA (MA3). Signals to close buy positions are generate
The RiseTrading is a unique High quality and easy to use and affordable trading tool because we have incorporated a number of proprietary features and PowerSignal and MACD and Stochastic indicators. The main advantages of the trend trading strategy used by the Expert Advisor are opening positions only in the direction of a trend, ability for the long-term retention of profitable positions allowing users to achieve good combinations of profit/loss distributions. That can work on a real account at
DYJ stock controller est un système de bourse en monnaie unique Il peut afficher des valeurs aléatoires pour chaque paire de devises de M1 à MN Lorsque la valeur Stoch d'une période atteint la zone de dépassement et la zone de dépassement, il y a une invite de couleur. Vous pouvez faire la bonne transaction en fonction de ces informations. Créez un modèle d'indicateur de stock appelé « DYJ inventory control » et enregistrez-le. Lorsque vous cliquez à l'aide de la souris sur une zone d'achat ex
The DYJ SoarTrading is based on SoarSignal indicator. It can be used for any currency pair and timeframe. Signals to buy are generated when SoarSignal has crossed oversold downwards, reached oversold and then crossed back up through oversold. Signals to sell are generated when SoarSignal has crossed overbought upwards, reached overbought, and then crossed back down through overbought. Close a trade when SoarSignal reaches the opposite side ( overbought for long order, oversold for short order).
The  DYJ WPR - SignalSource is based on  WPR  indicator. It can be used for any currency pair and timeframe. The  WPR  recommends  Indicator values ranging between 80 and 100% indicate that the market is oversold. Indicator values ranging between 0 and 20% indicate that the market is overbought. The entry signal of this indicator is a turning point in the trend. The indicator uses analog trading technology, Provide you with indicators to evaluate the overall profit of the opening signal and clo
DYJ Sharp advanced algorithm that detects new trends and current trend continuations for use as an entry and exit strategy. The strategy display the SHARP trend demarcation area. This SHARP area has high HighLine and low LowLine. Falling of high below HighLine of SHARP and then falling of close below LowLine of SHARP can be interpreted as a signal to sell. Rising of close above HighLine of SHARP and then rising of low above LowLine of SHARP can be interpreted as a signal to buy. The signal for e
DYJ TRENDWAVE features an advanced algorithm that detects new trends and current trend continuations for use as an entry strategy. DYJ TRENDWAVE's volatility is based on the power of buyers and sellers, it grabs total body size of candles and identifies the battle between buyers and sellers as a percentage of the total volume, like Sellers: (-)100% and Buyers: (+)100%. This information can be used for any entry and exit strategy. For bullish/Long Pin bar it is below the price line, for bearish/S
DYJTRENDWAVE features an advanced algorithm that detects new trends and current trend continuations for use as an entry strategy. DYJTRENDWAVE's volatility is based on the power of buyers and sellers, it grabs total body size of candles and identifies the battle between buyers and sellers as a percentage of the total volume, like Sellers: (-)100% and Buyers: (+)100%. This information can be used for any entry and exit strategy. For bullish/Long Pin bar it is below the price line, for bearish/Sho
Dyj Reversal est un consultant expert entièrement automatisé. Un filtre métrique aléatoire est utilisé pour les entrées. Les conseillers ont besoin de types de comptes de couverture et de rec. La perte de commande sera libérée sous caution par le jeu et deviendra un profit. Si la commande est dans la mauvaise direction. Vous pouvez désactiver la stratégie de jeu à tout moment. Recommandations générales Comptes ECN recommandés, écart xauusd entre 8 et 11 points ou moins, écart EUR / USD 1 Le dép
DYJ T3ModeMA
Daying Cao
2 (1)
DYJ T3ModeMA est basé sur l'algorithme T3. L’algorithme T3 a été introduit dans le domaine de l’analyse technique dans un article intitulé « Better Moving Averages » publié par le magazine américain TASC. T3 peut lisser les séries de prix tout en réduisant le retard du système de suivi des tendances. La taille de la colonne de l'indicateur détermine le signal d'entrée et lorsque la taille de la colonne est proche de 0, c'est le point de basculement de la tendance. L'indicateur utilise des techni
Dyj Long Term Strategy ea is a long - line Trading System Nous commençons par chercher le prix le plus bas dans la bougie comme tendance à long terme, et nous commençons à chercher le prix le plus élevé comme tendance à court terme, et nous garderons la position la plus longue possible et ferons le plus grand profit. Lorsqu'une commande est mal dirigée, la stratégie peut la transformer en gain. EA s'exécute sur n'importe quelle période d'un graphique à une seule devise Signal URL INPUT InpMagi
The DYJBands opens and closes positions using Bollinger Bands signals: It performs trades after a price rebound from the borderlines of the indicator. It has the option to close positions by an opposite signal, by take profit and stop loss, move a trade to breakeven upon reaching the central Bollinger band or after a certain price movement. By default, the EA is configured for trading the GBPUSD currency pair on the H1 timeframe. Also, settings for the EURUSD, USDJPY, USDCAD and XAUUSD currency
The DYJ MacdSto is a unique High quality and easy to use and affordable trading tool because we have incorporated a number of proprietary features and MACD and Stochastic and RSI and ADX indicators. The main advantages of the trend trading strategy used by the Expert Advisor are opening positions only in the direction of a trend, ability for the long-term retention of profitable positions allowing users to achieve good combinations of profit/loss distributions. DYJ MacdSto EA uses MACD and Stoch
This StrongCurrency is a complete trading system based on a variety of technical indicators, moving averages and pivots. Each of those elements can be assessed in defined rules and coefficients (depending on the indicator) providing limitless optimization scenarios for the StrongCurrency. In order to work the StrongCurrency creates a trend strength and entry point signal list display by evaluating these data, that takes data from all symbols. It extrapolates all the information in order to get t
The DYJ TrendPending EA tracks the new change of price of the currency pair and opens trades in case of a price low and high from the main movement in the direction of the trend. So EA uses the least risky grid and Add lots. And can attach a positive and reverse pending order. The PositivePending orders can reduce the number of grids and Add lots,  while ReversePending orders reduce the loss of orders . For more convenient search, the working timeframe has been added to inputs (Work timeframe).
This is a multi-currency and multi-strategy EA. This EA is to create one or more polling trading strategies in a transaction. In the polling mode, the strategies filter a trend-free range market environment and trades are placed in the opposite direction at the edges of the range. With an additional main trend filter in the trend-following mode, the DYJ's ArtOfForexWar can also trade pull-backs during trends in the trend of loss. The winning rate is more than 95% within three orders or three cl
Dyj scappingburg ea est un expert - Conseil entièrement automatisé. Le filtre de l'algorithme de bureau est utilisé pour les entrées. Les conseillers ont besoin de types de comptes de couverture et de rec. La perte de commande sera libérée sous caution par le jeu et deviendra un profit. Si la commande est dans la mauvaise direction. Vous pouvez désactiver la stratégie de jeu à tout moment. Recommandations générales Comptes ECN recommandés, écart xauusd entre 8 et 11 points ou moins, écart EUR /
DYJ ArtOfMakingMoney attempts to gauge bullish and bearish forces in the market by using two separate measures, one for each type of directional pressure. The  EA's BearsIndex  attempts to measure the market's appetite for lower prices The EA's BullsIndex attempts to measure the market's appetite for higher prices Features Monitors all pairs at the same time. The EA monitors the top 35 pairs by default, but you can select less pairs if you wish. It is a multi-currency EA that can be run from a s
The DYJ Trend Analyser EA is based on  DYJ Trend Analyst  indicator. The most optimized, highly robust and easy to use DYJ Trend Analyser EA. DYJ Trend Analyser EA attempts to gauge bullish and bearish forces in the market by using two separate measures, one for each type of directional pressure. The  EA's BearsIndex  attempts to measure the market's appetite for lower prices. The EA's BullsIndex attempts to measure the market's appetite for higher prices. Pivot Point Extra Indicator for DYJ Tre
This is an expert adviser that is intended to trade where sudden sharp movements occur on charts.  This EA is the trend breakout trading. However it makes only one trade per bar. Low risk EA with no too many positions, and there are predefined TP, SL and TS for each position. Features Monitors all pairs at the same time. The EA monitors the top 15 pairs by default, but you can select less pairs if you wish. It is a multi-currency EA that can be run from a single chart (M5 to D1,recommended timef
The  DYJ Hedging  is based on the following idea:crossing of two Moving Average lines (Fast and slow ) is used as a signal for opening positions. We will now apply game theory strategy on the future of per currency instead of a price chart of history. This is one level higher. Dynamic Market game theory is a special feature of Advanced Currency Health Bars indicator and you cannot find in any other Currency Meter! This is a very unique function. Dynamic Market game theory strategy Health Bars ar
Filtrer:
cam028
6487
cam028 2021.12.23 06:48 
 

good product great support

Répondre à l'avis