Yoshi MTF Candlestick Patterns
- Indicateurs
-
Le Quang Thanh
 Professional Trading Tools for MetaTrader 5
I specialize in developing high-quality indicators and Expert Advisors for MetaTrader 5, inspired by well-known trading methodologies used by professional traders and market researchers around the world. - Version: 1.8
- Activations: 10
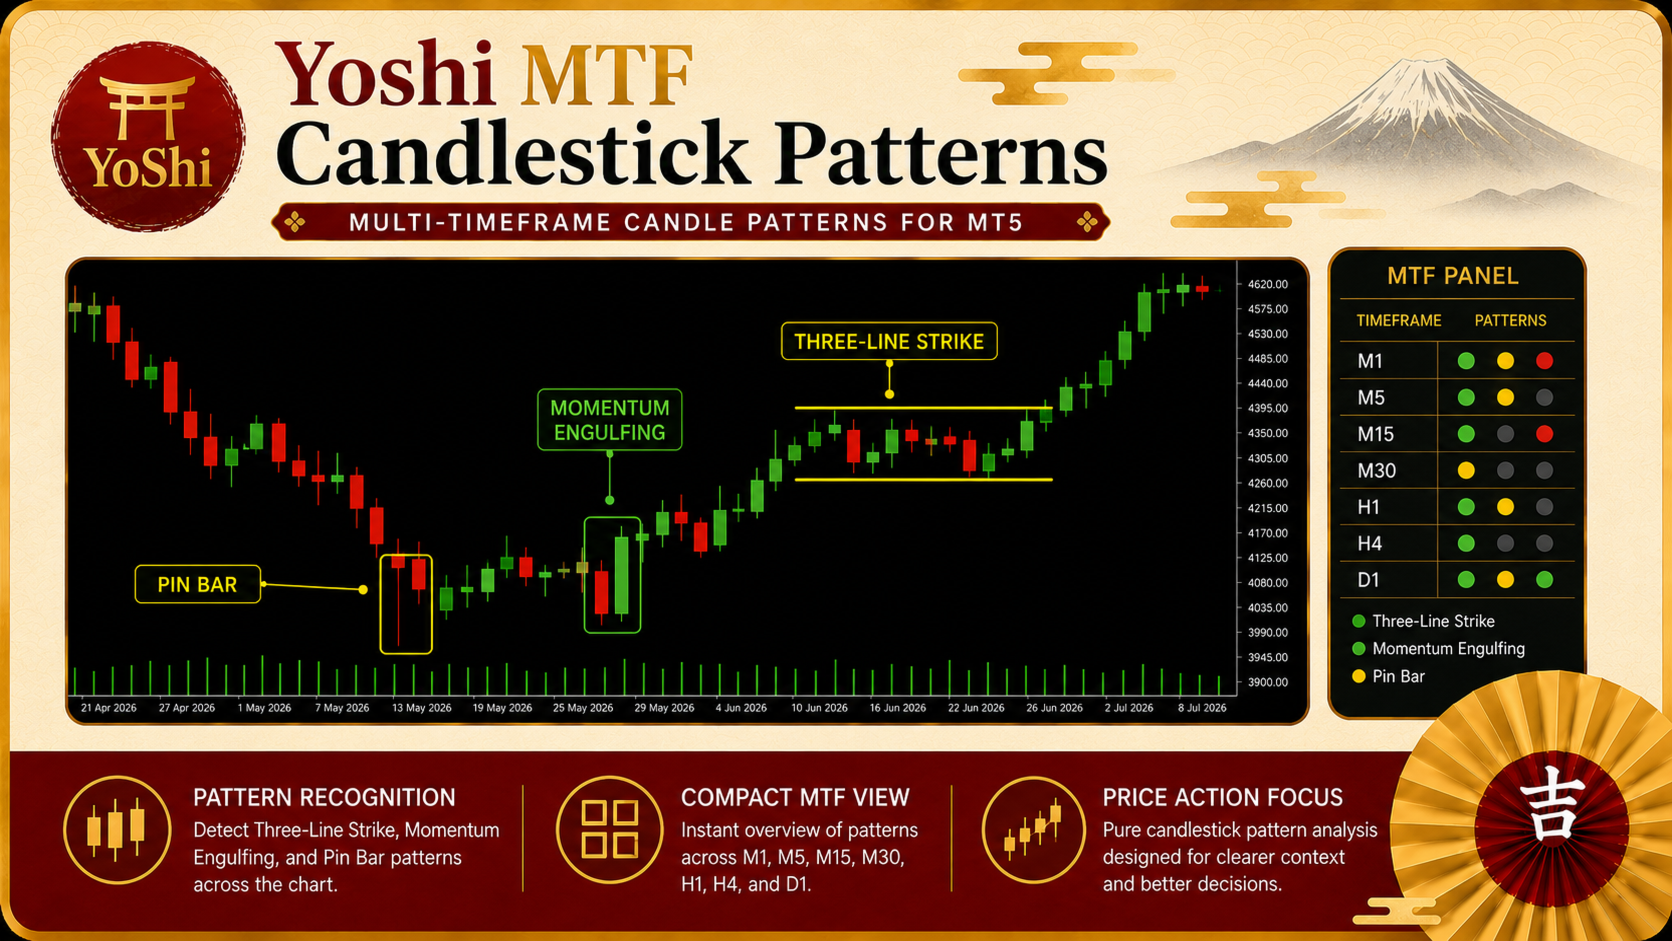
Yoshi MTF Candlestick Patterns is a visual Price Action indicator for MetaTrader 5 that combines Three-Line Strike, Momentum Engulfing and closed-bar Pin Bar recognition in one clean chart workspace. A compact multi-timeframe panel reviews the latest closed candle on M1, M5, M15, M30, H1, H4 and D1, helping traders check candle-pattern context without repeatedly switching charts.
Yoshi MTF Candlestick Patterns is a visual Price Action indicator for MetaTrader 5. It brings Three-Line Strike, Momentum Engulfing and Pin Bar recognition into one organized chart workspace, combining direct chart signals with a compact multi-timeframe panel.
The indicator is designed for traders who use candlestick behavior as part of a broader decision-making process. Instead of treating every candle pattern as an automatic trade, it helps you identify relevant price-action events, compare recent closed-candle context across several timeframes and decide which areas deserve closer attention.
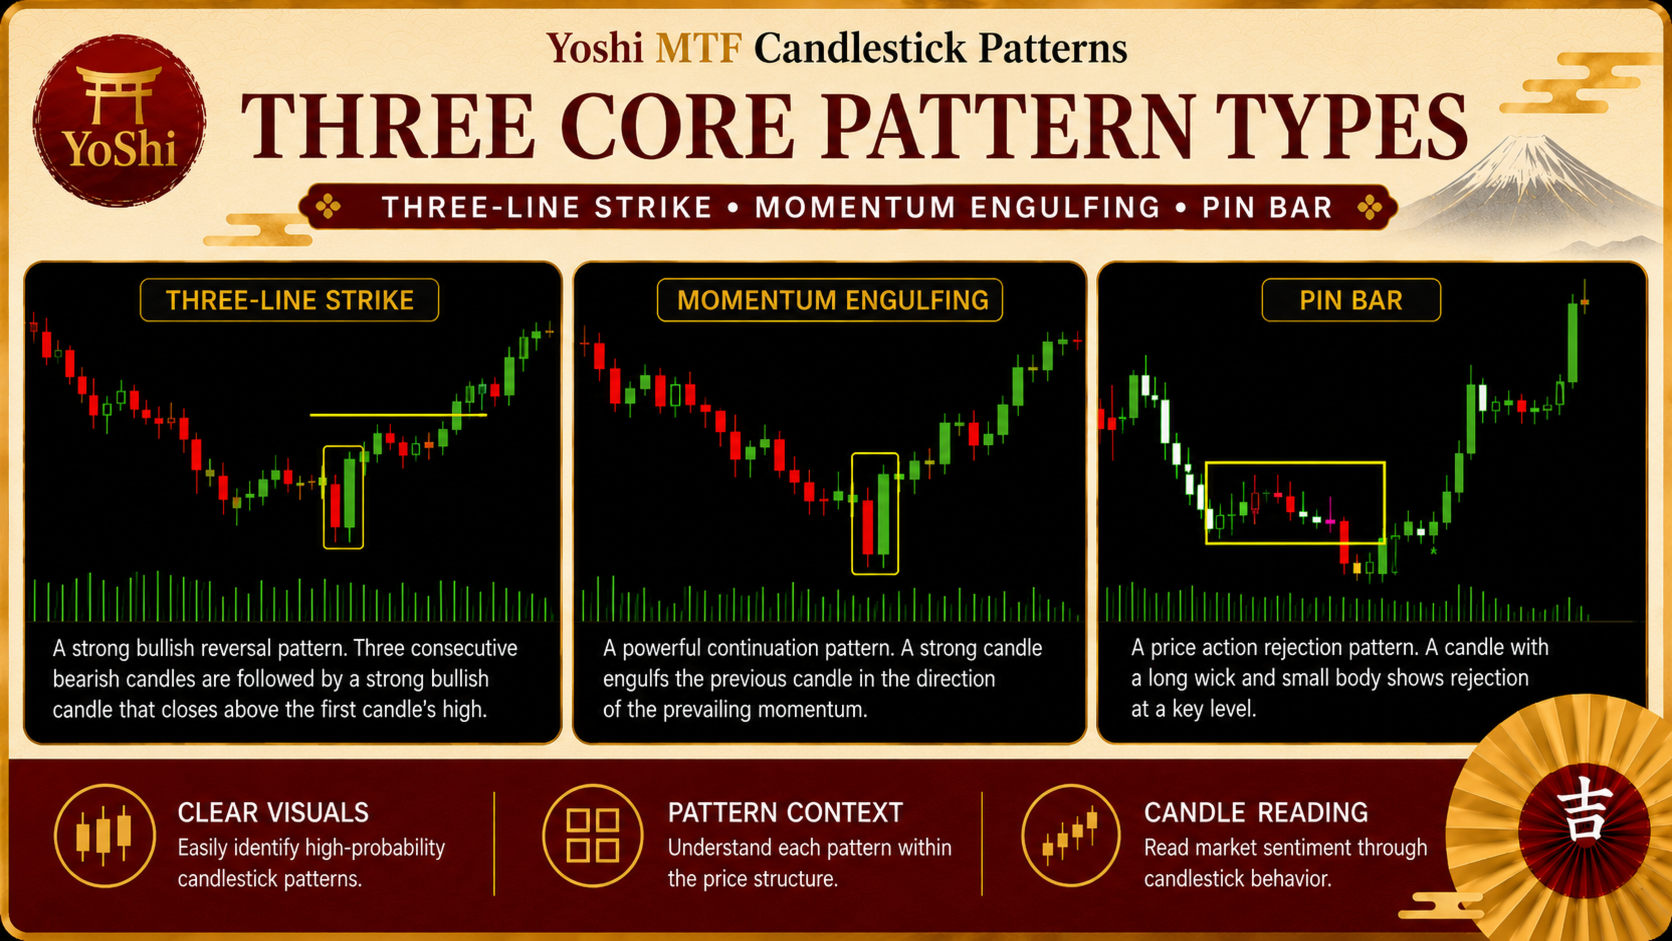
Three Pattern Families In One Indicator
Three-Line Strike
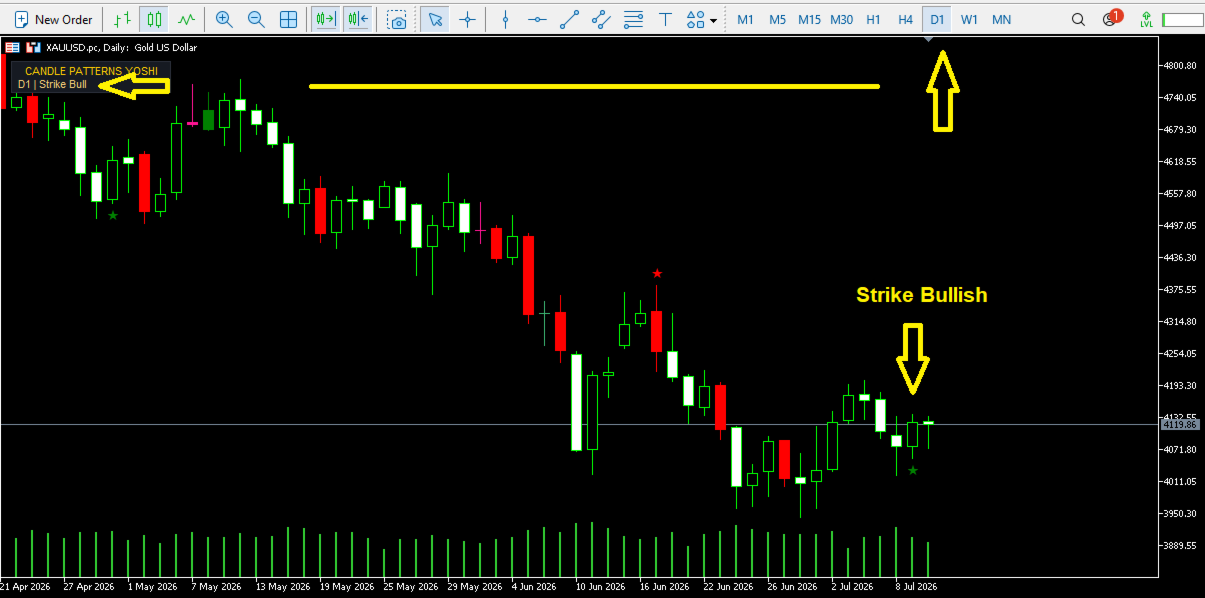
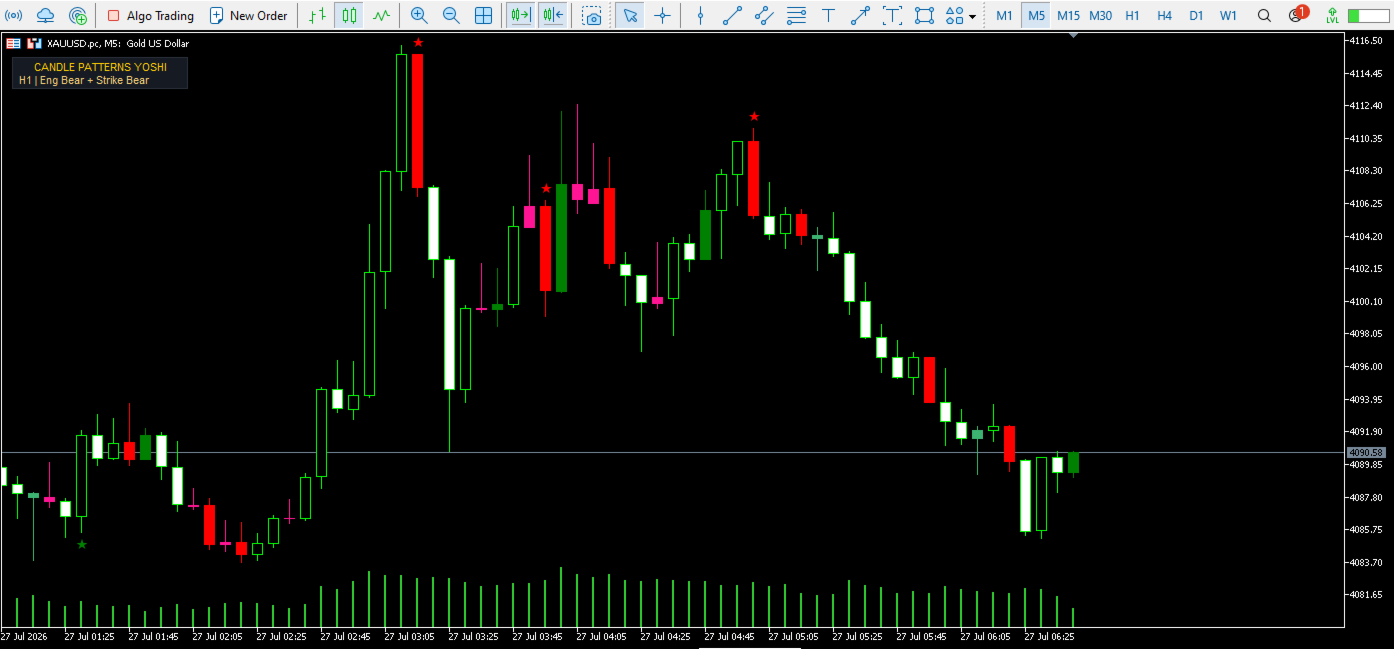
Bullish and bearish Three-Line Strike conditions are marked with green and red stars. These markers help draw attention to a potential directional shift after a sequence of candles. The indicator applies its own built-in detection rules, so the signal should be read together with trend, location and surrounding market structure.
Momentum Engulfing
Momentum Engulfing conditions are displayed by recoloring the complete signal candle. Green represents bullish momentum and red represents bearish momentum. This visual layer is intended to make strong changes in the relationship between the current candle and the previous candle easier to notice.
Pin Bar
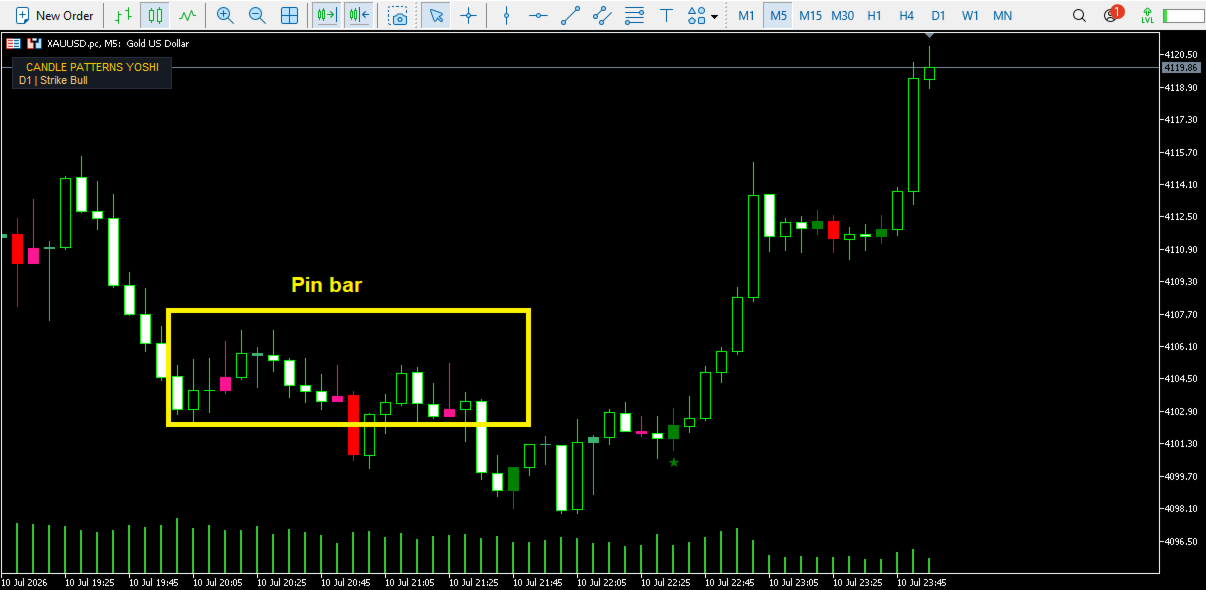
Closed Pin Bar candles are highlighted by color after the candle has completed. A bullish Pin Bar is identified through a dominant lower shadow, while a bearish Pin Bar is identified through a dominant upper shadow. The long-shadow threshold is adjustable, allowing the user to make Pin Bar recognition stricter or more permissive.
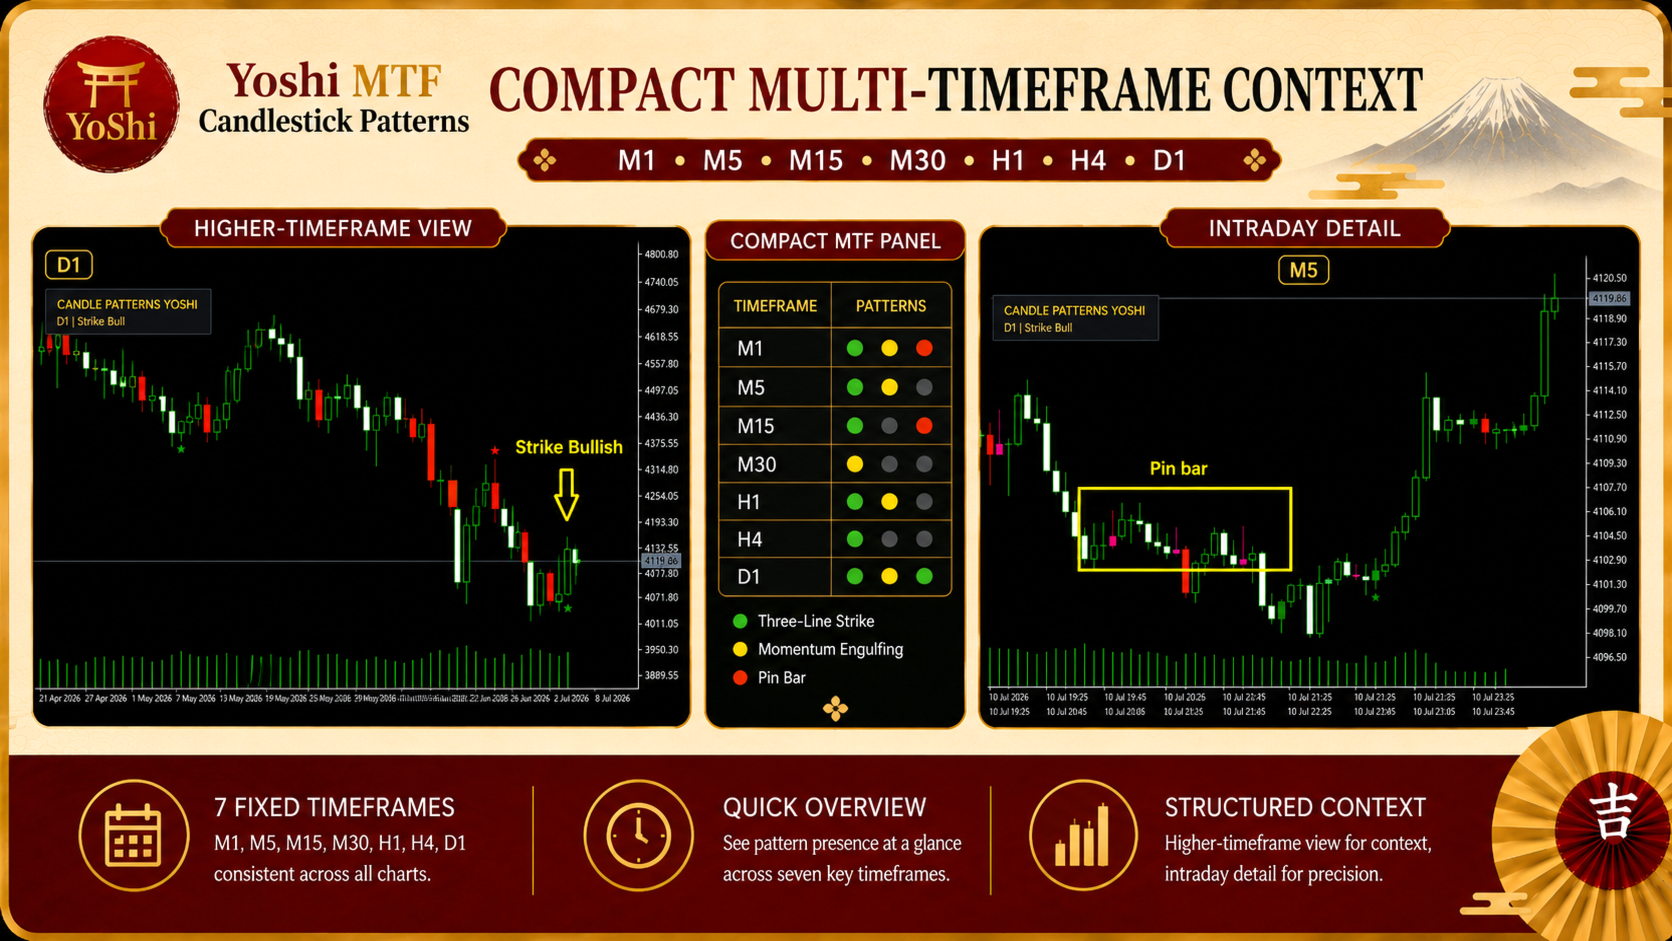
Compact Multi-Timeframe Context
The built-in panel reviews the latest closed candle of the current symbol on seven fixed timeframes:
M1, M5, M15, M30, H1, H4 and D1.
Only timeframes with an active recognized pattern are displayed. This gives the trader a compact view of where recent candle-pattern activity is present, without opening several charts or repeatedly changing the active timeframe.
The panel can display Pin Bar, Momentum Engulfing and Three-Line Strike states independently. It remains a context tool rather than a buy-or-sell command.
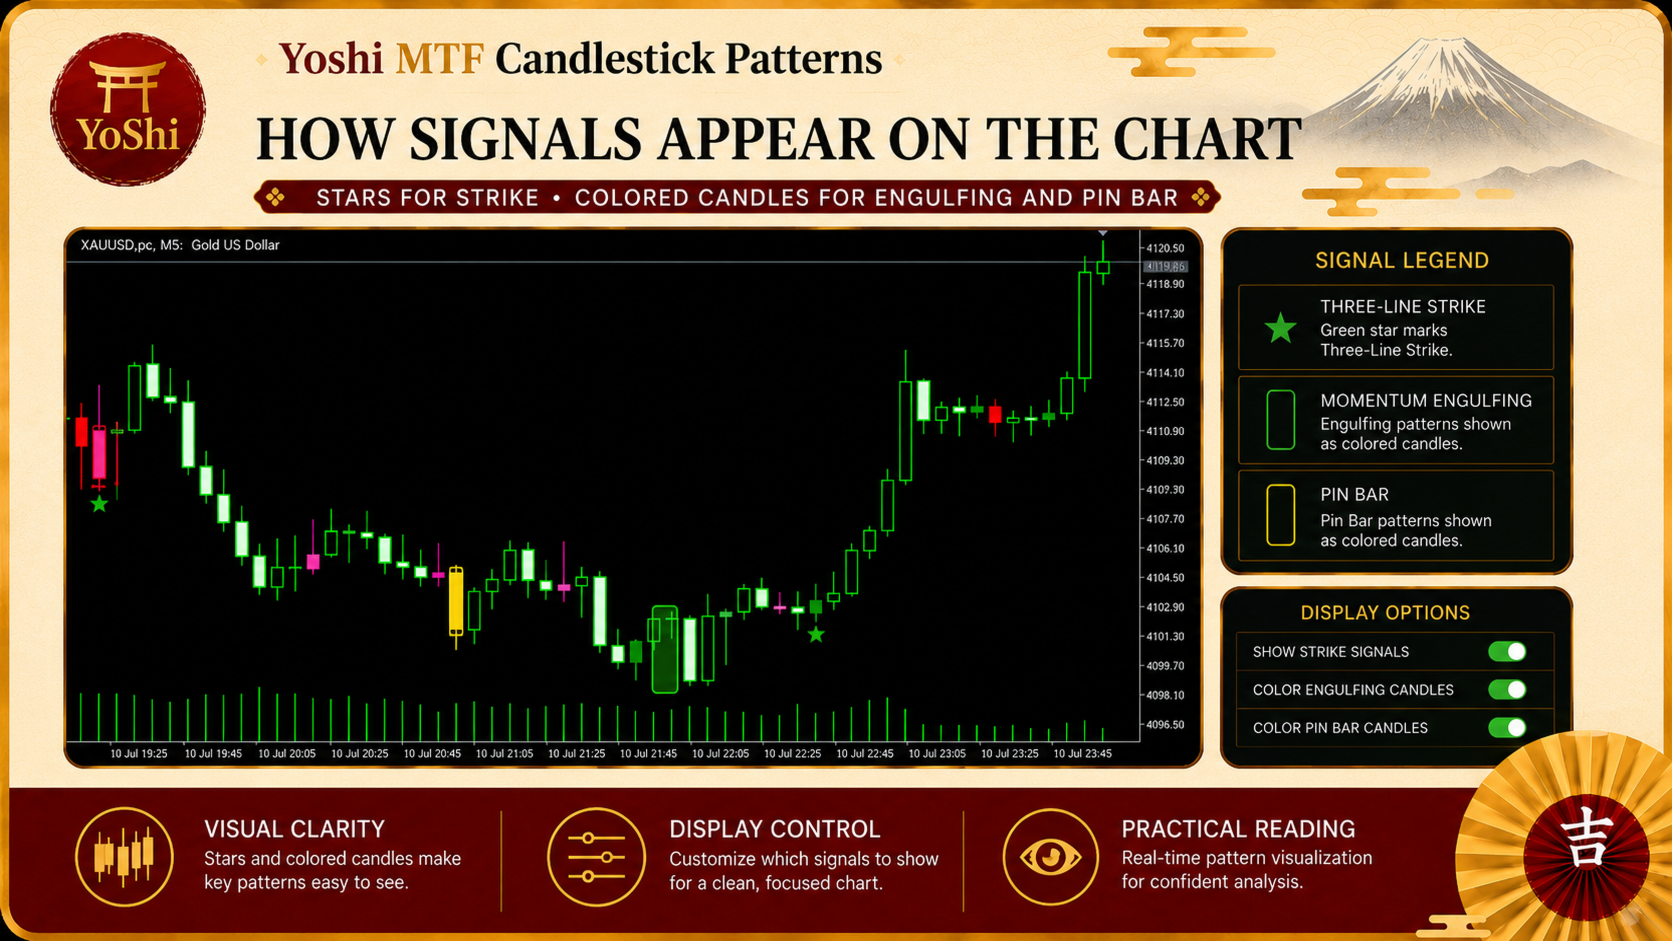
Clean Chart Display
· Green star: bullish Three-Line Strike
· Red star: bearish Three-Line Strike
· Green candle: bullish Momentum Engulfing
· Red candle: bearish Momentum Engulfing
· Medium sea green candle: bullish closed Pin Bar
· Deep pink candle: bearish closed Pin Bar
Non-signal candles retain the chart's normal candle colors. If a candle meets both Momentum Engulfing and Pin Bar conditions, the Momentum Engulfing color has visual priority on the chart, while the Pin Bar condition can still be recognized internally and shown in the MTF panel.
Key Features
· Three candlestick-pattern families in one MT5 indicator
· Bullish and bearish Three-Line Strike star markers
· Full-candle coloring for Momentum Engulfing conditions
· Closed-bar Pin Bar recognition
· Adjustable Pin Bar long-shadow threshold
· Compact seven-timeframe panel for the current symbol
· Individual display controls for each visual layer
· Adjustable panel position
· Adjustable calculation-history limit
· Clean chart behavior that leaves non-signal candles unchanged
Practical Use
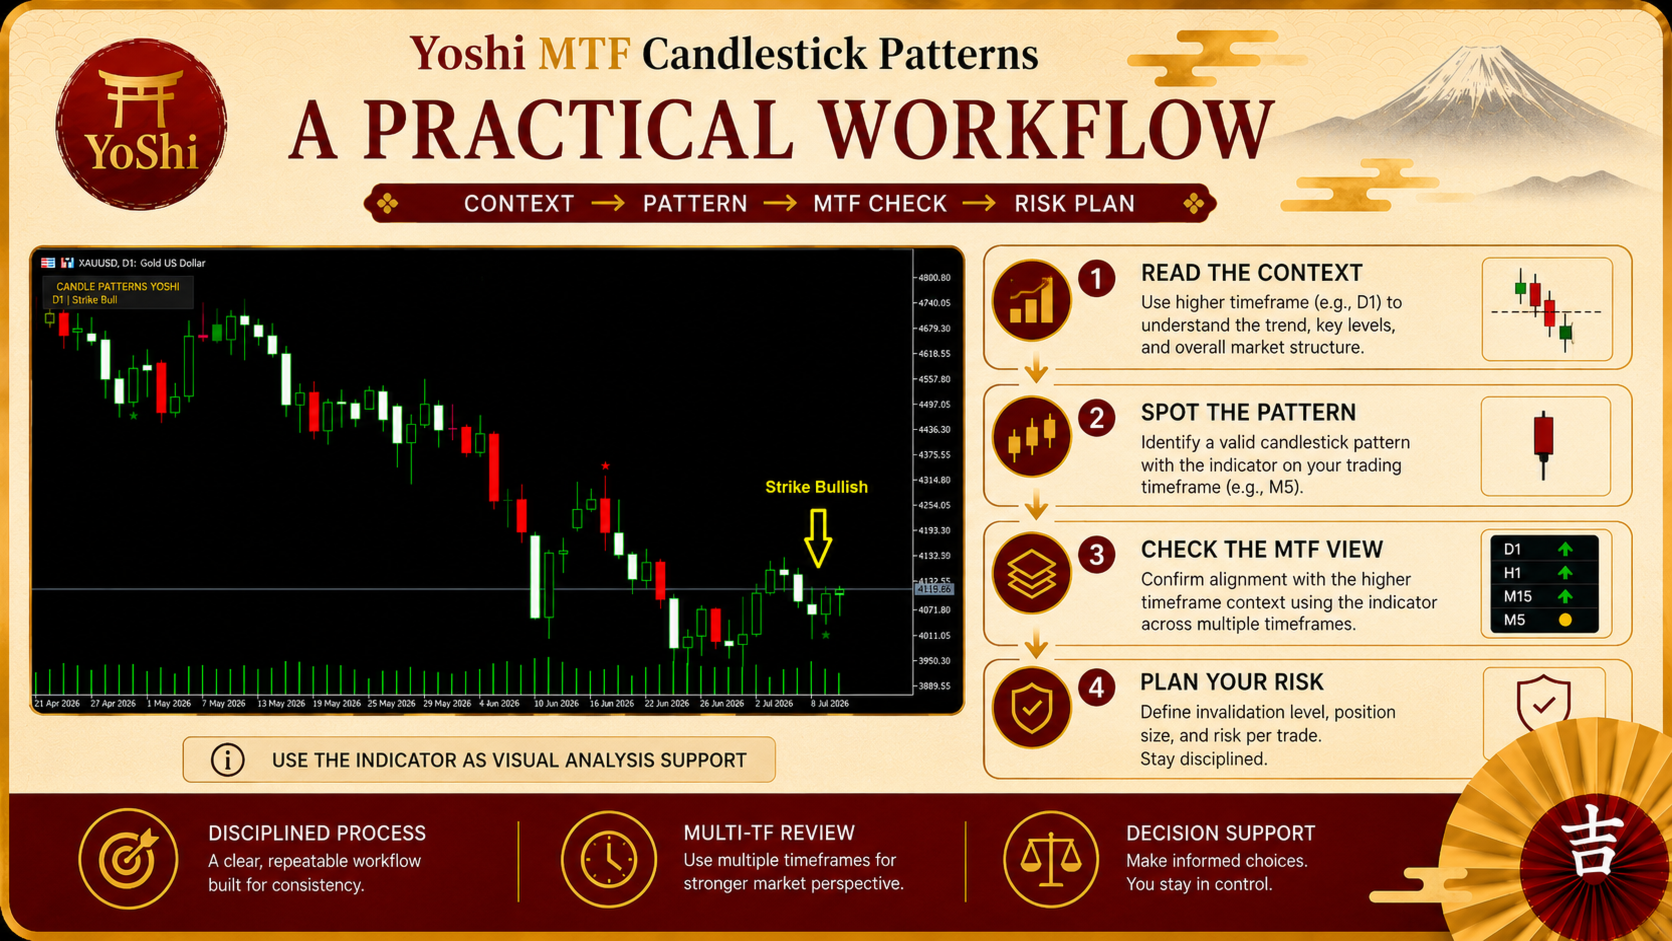
A disciplined workflow can be kept simple:
1. Start with market context and directional bias.
2. Identify a relevant price area, such as support, resistance, a recent swing or a session level.
3. Use Yoshi MTF Candlestick Patterns to identify a candle-pattern event on the chart.
4. Review the panel for supporting or conflicting closed-candle context on other timeframes.
5. Apply your own confirmation, Stop Loss placement, position sizing and risk rules.
The indicator can be applied to Forex, metals, indices and other symbols available in MetaTrader 5. Because candle behavior varies by market and timeframe, begin with the default settings and test any adjustments on a demo account before using them in live trading.
Important Signal-Timing Note
Pin Bar chart signals and all multi-timeframe panel states are based on closed candles. Three-Line Strike and Momentum Engulfing conditions on the current chart candle can update while that candle is still forming and become stable after it closes.
This product is a visual technical-analysis tool. It does not open, manage or close trades, and it does not calculate Entry, Stop Loss or Take Profit levels.
Risk Note
Trading Forex, CFDs and other leveraged markets involves risk. Candlestick patterns do not guarantee a reversal, continuation or profitable trade. Use the indicator as decision support, combine it with market context and disciplined risk management, and test your workflow before trading with real funds.