DoubleBB Marsi

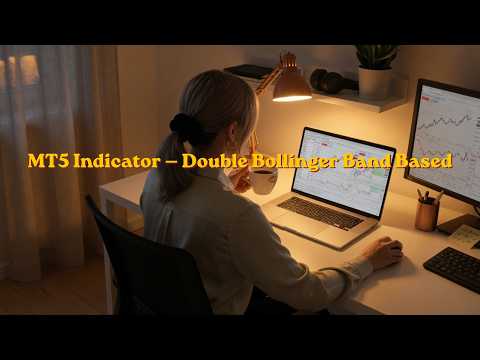
DoubleBB MARSI — All-in-One Chart Tool Optimized for Day Trading

Your price position · Market sentiment · Entry signals — all on one screen


🎯 In One Line

DoubleBB MARSI integrates the three essentials of day trading — daily reference levels · RSI sentiment · Double Bollinger Band signals — into a single chart, helping traders make faster and more confident decisions.


💎 Three Benefits You Get

DoubleBB MARSI is more than a basic indicator — it gives you everything you need across the entire daily trading cycle, all in one view.


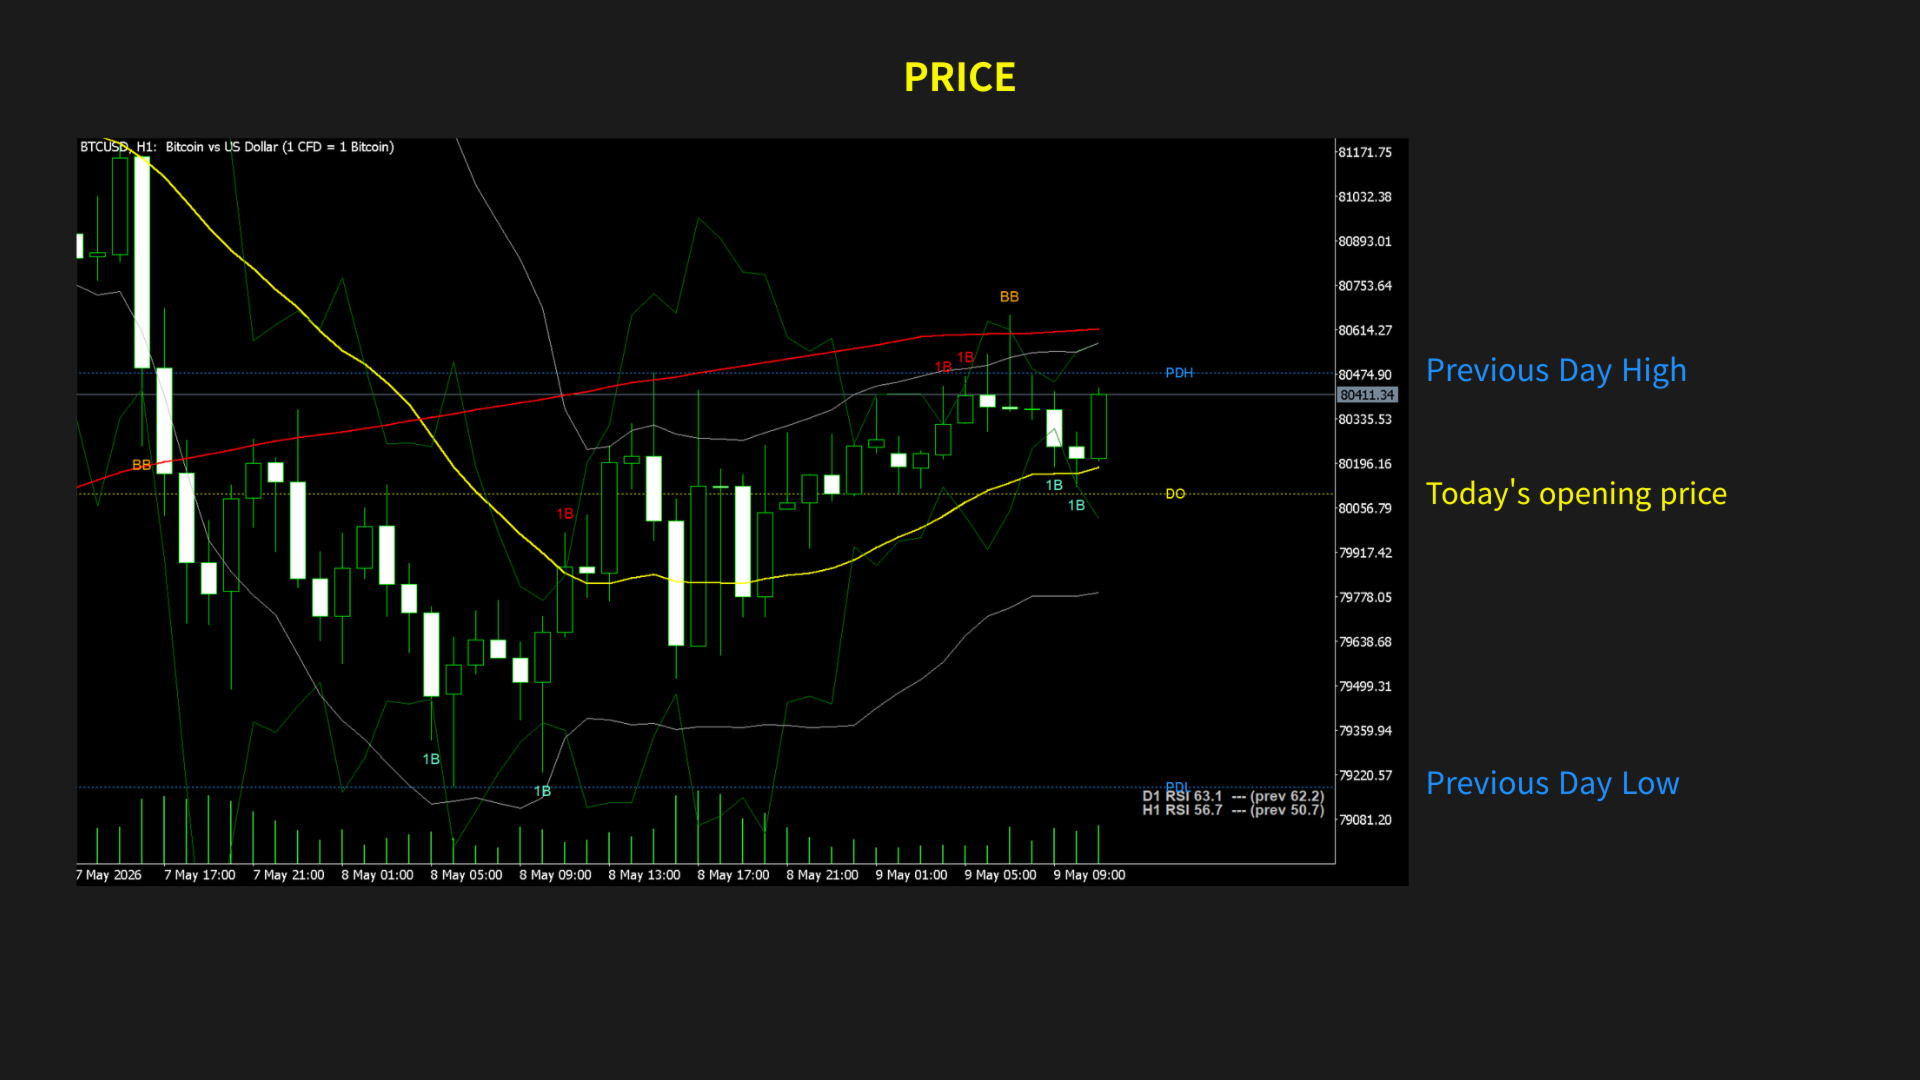
📍 1. "Where is price right now?" — Automatic Daily Reference Levels

Three key lines are drawn on your chart automatically.

· DO (Day Open · today's opening price)
· PDH (Previous Day High)
· PDL (Previous Day Low)

You can instantly see whether price is in a buy-favorable or sell-favorable zone.

"Are we trading above today's open, or below?"
"Have we broken yesterday's high, or cracked the low?"

→ A single glance at the chart answers these in under a second.

What you gain:
· Faster directional bias decisions
· Clear reference points for stop-loss / take-profit placement
· Immediate distinction between range and trend conditions


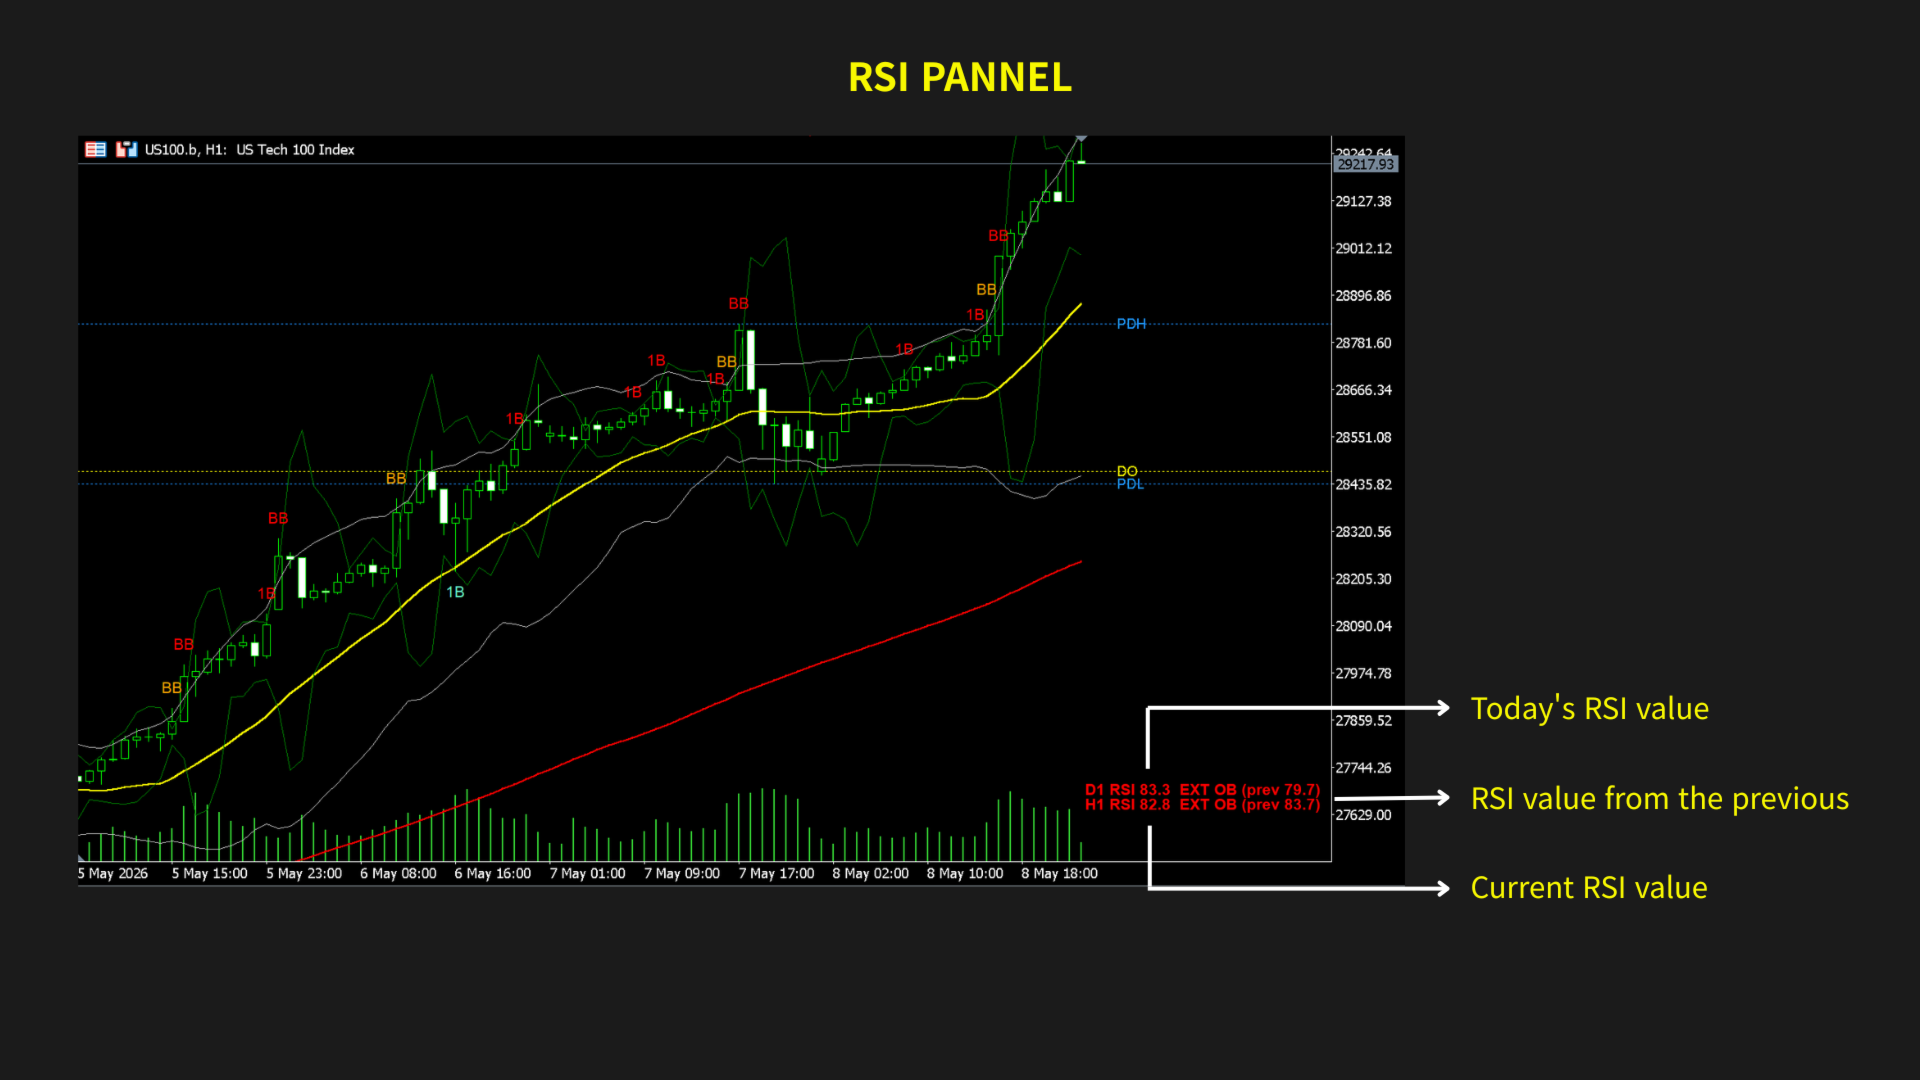
📊 2. "What's the market mood?" — Integrated RSI Panel (Bottom-Right)

The bottom-right corner displays D1 (daily) and H1 (hourly) RSI side by side.

· Current RSI value + previous value (direction at a glance)
· Auto-tagged states: OB, OS, EXT OB, EXT OS

See higher-TF context and short-term momentum together, without switching charts.

What you gain:
· Early warning of trend acceleration, exhaustion, or reversal
· Avoid chasing moves at extreme levels
· Better entry timing — RSI extremes become either reversal opportunities or zones to skip


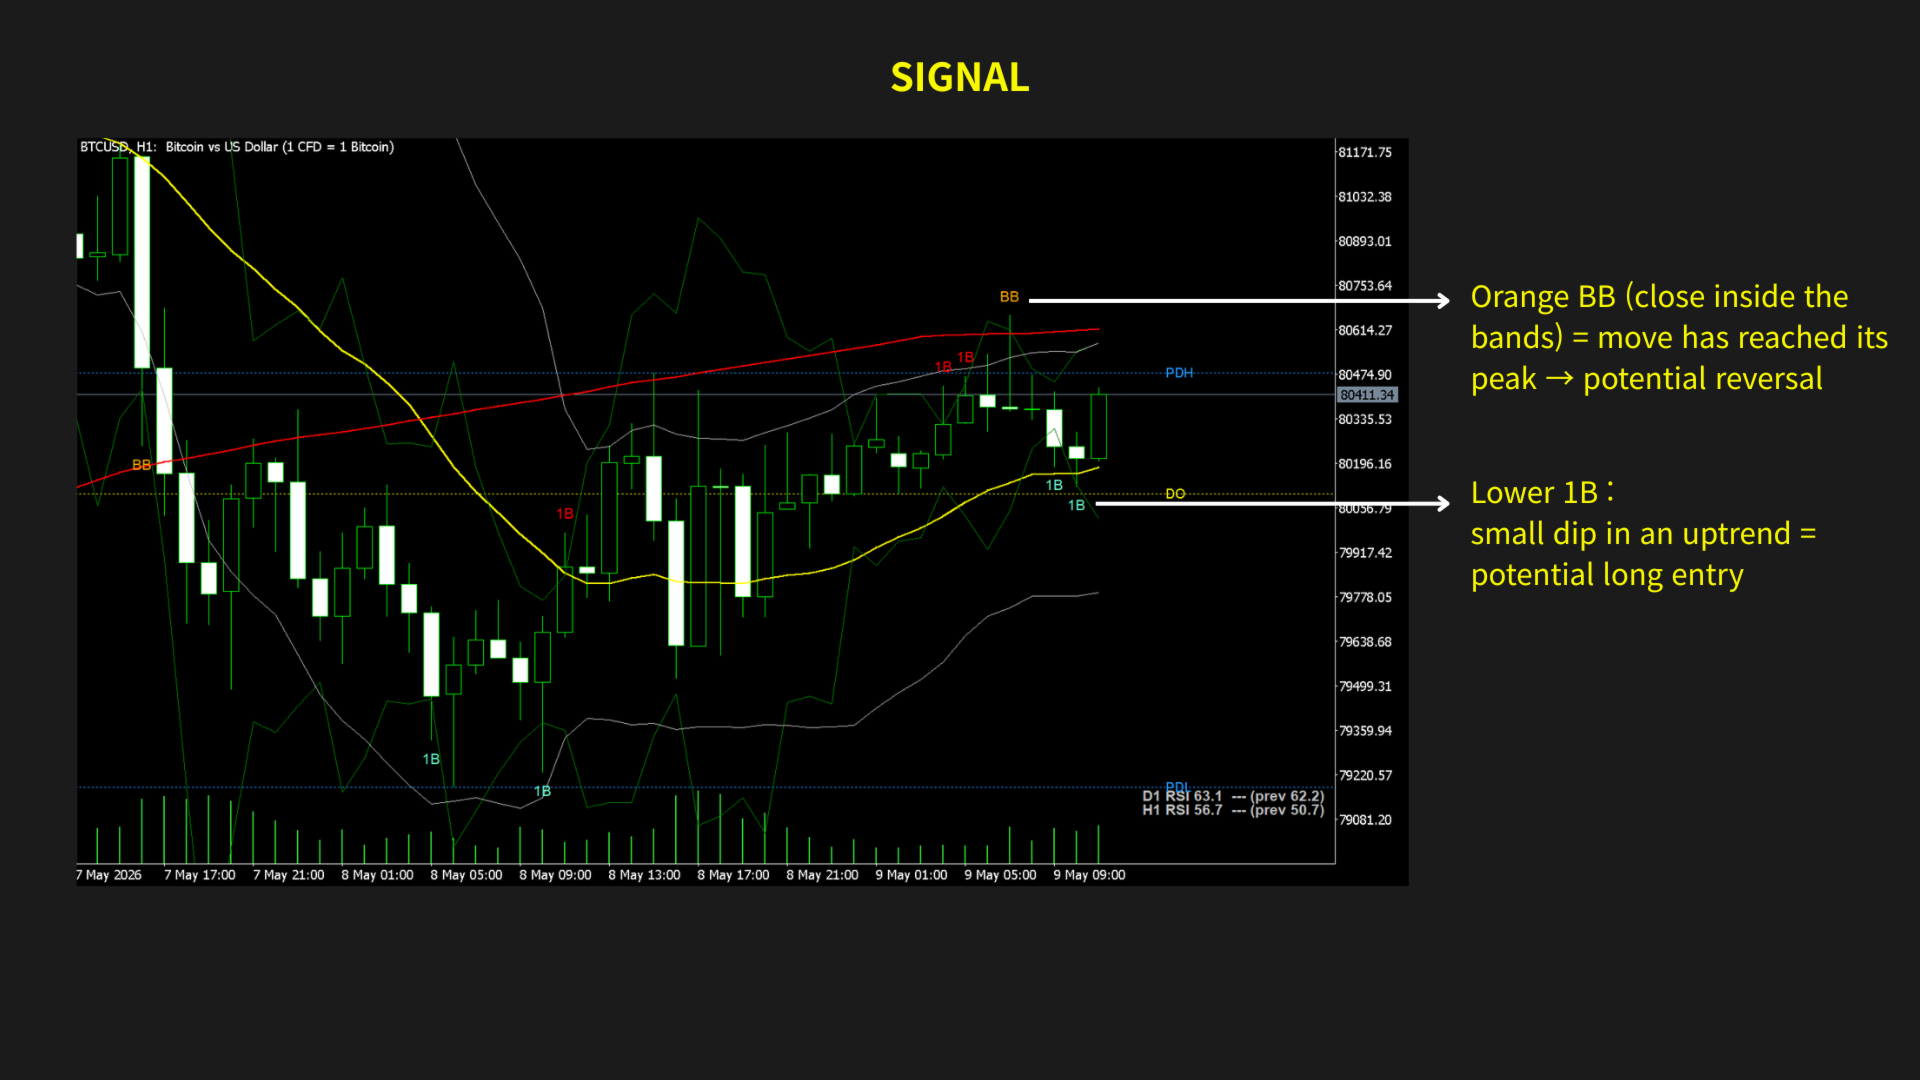
🎯 3. "Where do I enter?" — Double Bollinger Bands + Two Clear Signals

44 BB (short-term volatility envelope) + 202 BB (mid-term trend envelope) work together to produce two distinct, easy-to-read signals.

🔵 1B Signal — Pullback Entry Within a Trend
· Brief pullback inside an uptrend → lower 1B appears = Long candidate
· Brief retracement inside a downtrend → upper 1B appears = Short candidate

Trend-following traders get clear pullback / retracement entry timing.

🟠🔴 BB Signal — Inflection or Strong Breakout
· Orange BB (close inside the bands) = Move has reached a peak — reversal candidate
· Red BB (close outside the bands) = Strong breakout in progress — continuation candidate

Color tells you instantly whether it's a reversal or a breakout.

What you gain:
· Objective criteria when trend vs. reversal is unclear
· Consistent trading rules through visually distinct signals
· Confirmed at candle close (No-Repaint) — once a signal is drawn, it never changes or disappears


🔥 The Power of Combining the Information

The real value of DoubleBB MARSI shows when you combine all three layers.

🟢 Scenario A — Strong Long Setup
Price > DO (bullish bias for the day) + D1 RSI recovering from OS (exiting oversold) + lower 1B signal prints
→ All three align = high-conviction long candidate

🟡 Scenario B — Reversal Warning
Price near PDH + H1 RSI in OB + upper Orange BB appears
→ Buying pressure peaking = stop chasing longs, consider short reversal

🔴 Scenario C — Breakout Continuation
Price > PDH (yesterday's high broken) + H1 RSI rising + upper Red BB
→ Strong breakout in motion = ride the move, with stop just below PDH

Combining the layers leads to far more precise decisions than any single signal alone.


📲 Real-Time Alerts

· Alerts fire only on the chart timeframe you select (default: H1)
· After candle close → confirmed signal → mobile push notification
· Stay informed even when you're away from the screen

Get the alert → open the chart → DO/PDH/PDL · RSI · signal location at a glance → decide.


🛠️ Key Options

Adjust the indicator to fit your trading style:

· Bollinger Bands: period / deviation / applied price (open or close) — for both bands
· Moving Averages: fast / slow MA periods
· Colors: 14 color presets — separate for lines, signals, and daily levels
· RSI Panel: enable / period / OB·OS thresholds
· Alerts: trigger TF / push / MT5 alert
· Display Range: signal-label history depth / font size

Color selection uses dropdown menus so Mac (Wine) users can change colors freely.


📋 Recommended Use

· Timeframes: works on any TF — H1 recommended (best balance for day trading + alerts)
· Symbols: XAUUSD (Gold) · US100 (NAS) · BTCUSD · major FX pairs — particularly effective on volatile assets
· Platform: Windows MT5 + macOS (Wine) supported


⚠️ Disclaimer

This indicator is a technical analysis tool. It does not guarantee profits. Always test thoroughly on a demo account before going live.

All trading decisions and their outcomes are the user's responsibility. Use proper risk management (stop-loss, take-profit, position sizing) at all times.


Produits recommandés
Bid Price Timer Indicator — Précision et suivi intelligent des prix ! Améliorez votre précision de trading avec le Bid Price Timer Indicator , un outil puissant conçu pour les traders qui apprécient le timing, la précision et la clarté à chaque mouvement du marché. Fonctionnalités principales : Affichage fixe du minuteur – Toujours visible sur le côté droit du graphique (ajustable via X_Offset). Suivi dynamique du prix – Le minuteur se déplace verticalement en suivant le prix B
Impulse fractals indicator - is counter-trend oriented complex market fractal pattern.  Market creates bull/bear impulse, trend starts, fractals on impulsed wave are an agressive pullback signals. Buy arrow is plotted when market is bearish and it's impulse showed up-side fractal, and sell arrow is plotted when market is bullish and it's impulse showed dn-side fractal. Main indicator's adjustable inputs : impulsePeriod - main period of impulse histogram  filterPeriod  - smoothes impulse accordi
Cet indicateur est un indicateur d'analyse automatique des vagues, parfait pour le trading pratique ! Cas... Remarque :   je n'ai pas l'habitude d'utiliser des noms occidentaux pour l'évaluation des vagues. En raison de l'influence de la convention de dénomination de Tang Lun (Tang Zhong Shuo Zen), j'ai nommé la vague de base comme   un stylo   et la bande d'onde secondaire comme   un segment   . en même temps, le segment a la direction de la tendance.Le   segment de tendance principal   est no
DYNAMIC SR TREND CHANNEL Dynamic SR Trend Channel is a simple indicator for trend detection as well as resistance/support levels on the current timeframe. It shows you areas where to expect possible change in trend direction and trend continuation. It works with any trading system (both price action and other trading system that use indicators) and is also very good for renko charting system as well. In an uptrend, the red line (main line) serves as the support and the blue line serves as the r
Introduction to Fractal Pattern Scanner Fractal Indicator refers to the technical indicator that makes use of the fractal geometry found in the financial market. Fractal Pattern Scanner is the advanced Fractal Indicator that brings the latest trading technology after the extensive research and development work in the fractal geometry in the financial market. The most important feature in Fractal Pattern Scanner is the ability to measure the turning point probability as well as the trend probabil
Smart Money Structure & Precision Trading Indicator (MT5) Smart Money Structure & Precision Trading Indicator  is a powerful Smart Money Concepts (SMC) indicator for MetaTrader 5, designed to help traders identify high-probability entries with institutional logic . This indicator automatically detects market structure in real time , highlights key liquidity levels , and provides clear, non-repainting signals so you can trade with confidence and precision. Whether you are a scalper, day trader, o
Optimized Spike Detector Pro for MT5 is a professional-grade technical indicator designed to identify and capitalize on sharp, impulsive price movements (spikes) in any financial instrument. Utilizing a sophisticated, multi-algorithmic core, it distinguishes significant volatility expansions from market noise with exceptional accuracy. The tool dynamically adapts to changing market conditions, filtering out false signals and highlighting only high-probability spike setups in real-time. Featuring
【Super Scanner】Indicator Introduction : The color of the Super Scanner which is green and climbing up means that the price trend is going up.The color of the Super Scanner is red and going down means that the price trend is going down. It is very simple to use it to judge the market trend! What's even better is that the open parameters of the indicators allow investors to adjust. You can adjust【Super Scanner】according to your needs. Adjust it faster to be closer to short-term market fluctuatio
Opulence Levels
Tokunbo Greatpath Adebowale
Opulence Levels is a precision-engineered, non-repainting indicator that automatically identifies the most critical price levels on any chart — the exact zones where smart money reacts, liquidity is hunted, and the next big move is born. Powered by swing-based structure analysis and multi-timeframe intelligence, Opulence Levels cuts through chart noise to deliver clean, high-probability BUY LEVELS and SELL LEVELS with surgical accuracy. No guesswork. No repainting. Just levels that matter. What
Dragonfly Doji Trading System for MetaTrader 5 Dragonfly Doji Trading System is a price action indicator for MT5 designed to detect reversal candles with long lower rejection and near-equal open and close near the high. A detailed user guide is available on the author’s MQL5 Blog . Additional updates are available through the author’s   MQL5 Channel . Depending on the current support policy, buyers may receive additional access to selected companion tools developed by the author. Overview Drago
This indicator allows you to observe candle formation over a specific period, such as the Nasdaq, which starts at mid-hour. For example, for the first hour. The distance and size of the candle positioned on the right side can be adjusted. Color can also be assigned based on falling and rising candles. The needle can be made visible or invisible if desired. The body size can also be adjusted as desired.
FREE
LR Pivots Combo Statistics That Show You Where the Market Stands! Key Features (updated V2.1) 1. Auto-Plotting Linear Regression Channel Trend Direction — Uses slope (normalized by ATR) to identify whether the market is in an uptrend, downtrend, or ranging sideways. Trend Quality (R-Squared) — Tells you if the trend is statistically consistent (Stable) or just noise (Volatile). Useful for filtering out unreliable setups. Standard Deviation Bands — Shows how far price has deviated from the regre
FREE
Euro Escalper
Cristofher Robles
Euro Escalper V1 — Indicateur Professionnel de Scalping Institutionnel Euro Escalper V1 est un indicateur de trading haute performance concu pour les traders qui exigent une precision institutionnelle a chaque entree. Il fonctionne sur les Indices Synthetiques (Deriv), le Forex et tout actif disponible sur MetaTrader 5. Il combine des zones de liquidite basees sur Fibonacci, un moteur SuperTrend integre et un tableau de bord professionnel en temps reel. Avantages Principaux Sans Repeinture: Les
Paranormal Insightment  Use with : Ritz MA Ribbon Dynamics (check on my product) Ritz Paranormal Insightment   is a precision-engineered analytical indicator that blends   momentum intelligence   and   trend confirmation   into a single visual system. It merges the   DeMarker oscillator   with a   dynamic Moving Average filter , detecting price exhaustion and directional shifts with remarkable clarity. The indicator translates subtle market imbalances into actionable visual and auditory signal
If you are unsure how to use this indicator, please feel free to reach out to me. I will explain it to you and provide reading materials to help you make the most of it. TD Sequential Scanner: An Overview The TD Sequential scanner is a powerful technical analysis tool designed to identify potential price exhaustion points and trend reversals in financial markets. Developed by Tom DeMark, this method is widely used by traders to gauge market cycles and potential turning points with precision. Ho
First Dawn MT5
Innovicient Limited
The First Dawn indicator uses a unique mechanism to search and plot signals. This keeps searching for signals, making it a great indicator for scaping and identification of changes in direction, swing trading and trend trading. The    First Dawn     helps you get early signals. The backtest gives the true picture of how the indicator works with real/demo accounts. Although this is a tiny indicator it is packed with advantageous settings that will help you whether you desire to: Snap the Peaks a
A useful scanner/dashboard that shows the RSI values for multiple symbols and Time-frames. It can be easily hidden/displayed with a simple click on the scanner man top left of the dashboard. You can input upper and lower RSI values and the colours can be set to show when above/below these values. The default values are 70 and 30. There are also input colours for when the RSI is above or below 50 (but not exceeding the upper/lower levels Symbols and time-frames are input separated by commas. S
Nouvel Indicateur d'Enthousiasme de la Tendance (TEI), l'outil ultime pour maximiser les profits sur les marchés. Cet indicateur innovant combine la puissance de l'analyse des tendances avec l'excitation du sentiment du marché, offrant aux traders un avantage unique sur les marchés financiers en constante évolution. Le TEI utilise des algorithmes avancés pour analyser la tendance sous-jacente d'un instrument financier et l'enthousiasme des traders pour identifier les opportunités de profit él
N/B: All our product purchase comes with our free ‘’DAILY   SCALPER EA’’ -   bit.ly/4qlFLNh Whatsapp Developer for yours after successful purchase BOS / CHoCH Signals Scanner Indicator (MT5) See What Smart Money Is Doing — Before the Move Happens Most traders lose because they enter too late, trade against structure, or miss institutional confirmations. The BOS / CHoCH Signals Scanner Indicator was built to solve exactly that. This professional MT5 indicator automatically reads market struc
Ultimate Double Top & Bottom (Pro Volume Matrix) Stop trading retail breakouts. Start trading Institutional Traps. The   Ultimate Double Top & Bottom   is not a standard, lagging pattern scanner. It is a highly advanced, non-repainting structural engine equipped with a proprietary   3-Leg Volume Matrix . Designed exclusively for Smart Money Concepts (SMC) and order flow traders, this indicator mathematically dissects the tick volume inside M and W patterns to reveal true institutional intent:  
Link to our products: LINK The ICT Asian Killzone Indicator delivers a professional, institutional-grade framework by precisely defining the Asian trading session from 00:00 to 04:00 GMT with absolute accuracy. It streamlines market structure analysis by isolating liquidity accumulation, range formation, and volatility compression during the Asian session. Built for serious ICT and Smart Money traders, it enhances strategic decision-making, execution confidence, and Tokyo session directional bi
Sigma VWAP Bands Sigma VWAP Bands (Rolling) is a technical analysis indicator that plots upper and lower bands based on the statistical deviation of price from a rolling Volume-Weighted Average Price (VWAP). The indicator is designed to visualize price dispersion around VWAP using a user-defined lookback window and a configurable standard deviation multiplier. Parameters Lookback Period Number of bars used for VWAP and standard deviation calculations. Sigma Factor Multiplier applied to the cal
The indicator determines a special pattern of Joe Dinapoli. It gives very high probability buy and sell signals. Indicator does not repaint. Indicator Usage Buy Signal ''B'' Entry : Market buy order at signal bar close Stop : Low of signal bar Take Profit : First swing high Sell Signal ''S'' Entry : Market sell order at signal bar close Stop : High of signal bar Take Profit : First swing low Indicator Parameters Fast EMA : External Parameter (should be kept as default) Slow EMA: External Param
Orderflow Super Candles - Simple Footprint Chart Indicator Platform: MetaTrader 5 (MT5)  (The last screenshot shows the use of the DOM tool in conjunction with the product.) 1. Product Introduction Orderflow Super Candles is a professional charting tool based on underlying Tick data analysis, designed to provide traders with a deep "X-ray" view of the market. By parsing the buy and sell volume distribution within each candlestick, this indicator visualizes the hidden market microstructure. It
Dark Breakout MT5
Marco Solito
3.25 (4)
Dark Breakout   is an Indicator for intraday trading. This Indicator is based on Trend Following  strategy, providing an entry signal on the breakout. The signal is provided by the arrow, which confirms the breaking of the level. We can enter in good price with this Indicator, in order to follow the main trend on the current instrument. It is advised to use low spread ECN brokers.    Recommended Brokers This Indicator does Not repaint and N ot lag . Recommended timeframes are M5, M15 and H1. R
Deviation trend
VLADISLAV AKINDINOV
Indicator of trend deviation with a static level. The deviation coefficient is set for the trend histogram. Signals are the intersection of the level trend histogram in the direction of the trend or during a trend reversal - the option is selected in the indicator settings by the "Revers" parameter. There are all the necessary settings for the design of the indication and sending messages to mail or a mobile terminal. All input parameters have an intuitive name. Analog for MT4: https://www.mql5.
KT Psar Arrows MT5
KEENBASE SOFTWARE SOLUTIONS
5 (1)
KT Psar Arrows trace des flèches sur le graphique en utilisant l'indicateur standard Parabolic SAR. Une flèche haussière est tracée lorsque le plus haut de la bougie touche le SAR. Une flèche baissière est tracée lorsque le plus bas de la bougie touche le SAR. Les signaux sont générés en temps réel sans attendre la clôture de la bougie.  Fonctionnalités Un outil utile pour les traders souhaitant expérimenter des stratégies de trading intégrant l'indicateur Parabolic SAR.  Peut être utilisé pour
ICT Structure Labels — STH / STL / ITH / ITL Automatically map Inner Circle Trader (ICT) market structure on any symbol and any timeframe. Every swing point is classified in real time using the correct ICT neighbour-comparison rule — no repainting, no cluttered settings. What it does The indicator scans price action for fractal pivot points and labels each one according to its structural significance: STH (Short Term High) — any confirmed swing high STL (Short Term Low) — any confirmed swing low
FREE
The TMA Centered Bands Indicator for MT5 draws bands on the chart and shows the overall price trend. It displays three bands - the lower and upper boundaries of the channel and the median.   The bands are made up of moving averages, and each of them has an MA period. The name TMA comes from triangular moving averages, as the indicator draws triangular bands.   The price will fluctuate between these ranges whenever the trend changes direction, thus creating entry and exit points.   How to trade
FREE
Descriptions A point point is a technical analysis indicator, or calculations, used to determine the overall trend of market over different time frames. This indicator calculate the highest or lowest pivots among left x and right y bars and show the high/low level during that period.   From that, you could clearly see the top resistance & bottom support level and how market goes break out. Instructions pivotLeft - pivot left bar count pivotRight - pivot right bar count pivotHighColor - color
Les acheteurs de ce produit ont également acheté
ARIPoint
Temirlan Kdyrkhan
ARIPoint is a powerful trading companion designed to generate high-probability entry signals with dynamic TP/SL/DP levels based on volatility. Built-in performance tracking shows win/loss stats, PP1/PP2 hits, and success rates all updated live. Key Features: Buy/Sell signals with adaptive volatility bands Real-time TP/SL/DP levels based on ATR Built-in MA Filter with optional ATR/StdDev volatility Performance stats panel (Success, Profit/Loss, PP1/PP2) Alerts via popup, sound, push, or email Cu
SuperScalp Pro
Van Minh Nguyen
4.63 (24)
SuperScalp Pro – Système avancé d’indicateur de scalping multi-filtres SuperScalp Pro est un indicateur de scalping avancé qui combine le Supertrend classique avec plusieurs filtres de confirmation intelligents afin d’identifier les opportunités de trading. Il fonctionne efficacement sur plusieurs unités de temps, de M1 à H4, avec des performances optimisées sur XAUUSD, BTCUSD et les principales paires Forex. L’indicateur fournit des signaux d’achat et de vente clairs, ainsi que des niveaux d’en
Entry In The Zone and SMC Multi Timeframe is a real-time 2-in-1 market analysis tool that combines market structure analysis and a No Repaint BUY / SELL signal system into a single indicator, built on Smart Money Concepts (SMC) — a widely adopted framework used by professional traders to understand market structure. This indicator helps you see the market more clearly, make decisions based on structure rather than guesswork, and focus on high-probability zones where price is more likely to react
Divergence Bomber
Ihor Otkydach
4.9 (88)
Chaque acheteur de cet indicateur reçoit également gratuitement : L’outil exclusif « Bomber Utility », qui accompagne automatiquement chaque opération de trading, fixe les niveaux de Stop Loss et de Take Profit, et clôture les positions selon les règles de la stratégie Des fichiers de configuration (set files) pour adapter l’indicateur à différents actifs Des set files pour configurer le Bomber Utility selon différents modes : « Risque Minimum », « Risque Équilibré » et « Stratégie d’Attente » U
Power Candles MT5
Daniel Stein
5 (8)
Power Candles V3 - Indicateur de force à optimisation automatique Power Candles V3 transforme la force des devises et des instruments en un plan de trading exploitable sur chaque graphique auquel il est associé. Au lieu de se contenter de colorer les bougies, il effectue une optimisation automatique en temps réel en arrière-plan et vous fournit les meilleurs niveaux de Stop Loss, Take Profit et seuils de signal pour le symbole que vous avez sous les yeux. Un simple clic suffit pour l'adopter en
Présentation       Quantum Breakout PRO   , l'indicateur révolutionnaire MQL5 qui transforme la façon dont vous négociez les zones d'évasion ! Développé par une équipe de traders expérimentés avec une expérience commerciale de plus de 13 ans,       Évasion quantique PRO       est conçu pour propulser votre parcours commercial vers de nouveaux sommets grâce à sa stratégie de zone de discussion innovante et dynamique. Quantum Breakout Indicator vous donnera des flèches de signalisation sur les z
SignalTech MT5 is a fully rule based trading system for EURUSD, USDCHF, USDJPY, AUDUSD, NZDUSD, EURJPY, AUDJPY, NZDJPY, CADJPY.  All the winning trades with chart setups are published on the comments page. 2025-12 1174 Pips 2026-01 2624 Pips 2026-02 2937 Pips 2026-03 2165 Pips 2026-04 2243 Pips It can generate signals with Buy/Sell Arrows and Pop-Up/Sound Alerts. Each signal has clear Entry and Stop Loss levels, which should be automatically flagged on the chart, as well as potential Targets 1,
Azimuth Pro
Ottaviano De Cicco
5 (7)
Azimuth Pro V2: Synthetic Fractal Structure and Confirmed Entries for MT5 Overview Azimuth Pro is a multi-level swing structure indicator by Merkava Labs . Four nested swing layers, swing-anchored VWAP, ABC pattern detection, three-timeframe structural filtering, and closed-bar confirmed entries — one chart, one workflow from micro-swings to macro-cycles. This is not a blind signal product. It is a structure-first workflow for traders who care about location, context, and timing. V2 Launch Offe
RelicusRoad Pro MT5
Relicus LLC
4.96 (24)
RelicusRoad Pro : Système d'Exploitation Quantitatif du Marché 70% DE RÉDUCTION ACCÈS À VIE (DURÉE LIMITÉE) - REJOIGNEZ 2 000+ TRADERS Pourquoi la plupart des traders échouent-ils même avec des indicateurs "parfaits" ? Parce qu'ils tradent des concepts isolés dans le vide. Un signal sans contexte est un pari. Pour gagner, il faut de la CONFLUENCE . RelicusRoad Pro est un Écosystème Quantitatif complet . Il cartographie la "Fair Value Road", distinguant le bruit des cassures structurelles. Arrête
Détecteur intelligent multicouche de cassure et de retracement pour MetaTrader 5 « Intelligent. Simple. Rapide ! » Vous en avez assez de rater des entrées sur cassure à haute probabilité ? Passez-vous des heures à analyser de nombreux graphiques pour aligner les cassures avec la direction de la tendance et le momentum des devises — pour finalement manquer le mouvement ? Break Pullback résout tout cela en un seul indicateur. Qu'est-ce que Break Pullback ? Break Pullback est un indicateur MetaTr
Si vous achetez cet indicateur, vous recevrez mon Gestionnaire de Trading Professionnel + EA  GRATUITEMENT. Tout d'abord, il convient de souligner que ce système de trading est un indicateur non repeint, non redessiné et non retardé, ce qui le rend idéal pour le trading manuel et automatisé. Cours en ligne, manuel et téléchargement de préréglages. Le "Système de Trading Smart Trend MT5" est une solution de trading complète conçue pour les traders débutants et expérimentés. Il combine plus de 10
Gann Made Easy   est un système de trading Forex professionnel et facile à utiliser qui est basé sur les meilleurs principes de trading en utilisant la théorie de mr. WD Gann. L'indicateur fournit des signaux d'ACHAT et de VENTE précis, y compris les niveaux Stop Loss et Take Profit. Vous pouvez échanger même en déplacement en utilisant les notifications PUSH. VEUILLEZ ME CONTACTER APRÈS L'ACHAT POUR RECEVOIR GRATUITEMENT DES INSTRUCTIONS DE TRADING ET D'EXCELLENTS INDICATEURS SUPPLÉMENTAIRES! V
Atomic Analyst MT5
Issam Kassas
3.94 (31)
Tout d'abord, il convient de souligner que cet indicateur de trading n'est ni repainting, ni redrawing et ne présente aucun délai, ce qui le rend idéal à la fois pour le trading manuel et automatisé. Manuel de l'utilisateur : réglages, entrées et stratégie. L'Analyste Atomique est un indicateur d'action sur les prix PA qui utilise la force et le momentum du prix pour trouver un meilleur avantage sur le marché. Équipé de filtres avancés qui aident à éliminer les bruits et les faux signaux, et à
Quantum TrendPulse
Bogdan Ion Puscasu
5 (24)
Présentation de   Quantum TrendPulse   , l'outil de trading ultime qui combine la puissance de   SuperTrend   ,   RSI   et   Stochastic   dans un seul indicateur complet pour maximiser votre potentiel de trading. Conçu pour les traders qui recherchent précision et efficacité, cet indicateur vous aide à identifier les tendances du marché, les changements de dynamique et les points d'entrée et de sortie optimaux en toute confiance. Caractéristiques principales : Intégration SuperTrend :   suivez f
FX Trend MT5 NG
Daniel Stein
5 (4)
FX Trend NG : La Nouvelle Génération d’Intelligence de Tendance Multi-Marchés Vue d’ensemble FX Trend NG est un outil professionnel d’analyse de tendance multi-timeframe et de surveillance des marchés. Il vous permet de comprendre la structure complète du marché en quelques secondes. Au lieu de naviguer entre de nombreux graphiques, vous identifiez immédiatement quels instruments sont en tendance, où le momentum s’affaiblit et où plusieurs unités de temps sont alignées. Offre de Lancement – Ob
Btmm state engine pro
Garry James Goodchild
5 (4)
BTMM State Engine Pro is a MetaTrader 5 indicator for traders who use the Beat The Market Maker approach: Asian session context, kill zone timing, level progression, peak formation detection, and a multi-pair scanner from a single chart. It combines cycle state logic with a built-in scanner dashboard so you do not need the same tool on many charts at once. What it does Draws the Asian session range; session times can follow broker server offset or be set in inputs. Tracks level progression (L
Tout d'abord, il convient de souligner que cet outil de trading est un indicateur non repeint, non redessiné et non retardé, ce qui le rend idéal pour le trading professionnel. Cours en ligne, manuel utilisateur et démonstration. L'indicateur Smart Price Action Concepts est un outil très puissant à la fois pour les nouveaux et les traders expérimentés. Il regroupe plus de 20 indicateurs utiles en un seul, combinant des idées de trading avancées telles que l'analyse du trader Inner Circle et le
Grabber System MT5
Ihor Otkydach
4.83 (23)
Je vous présente un excellent indicateur technique : Grabber, qui fonctionne comme une stratégie de trading "tout-en-un", prête à l'emploi. En un seul code sont intégrés des outils puissants d'analyse technique du marché, des signaux de trading (flèches), des fonctions d'alerte et des notifications push. Chaque acheteur de cet indicateur reçoit également gratuitement : L'utilitaire Grabber : pour la gestion automatique des ordres ouverts Un guide vidéo étape par étape : pour apprendre à installe
OrderFlux | Orderflow Footprint pour MetaTrader 5 Version 2.0 – Visualisation Bid/Ask en temps réel pour les Traders Actifs OrderFlux est un indicateur de footprint et d'orderflow pour MT5. Il ne montre pas seulement où le prix est allé, mais ce qui se passe à l'intérieur du mouvement : volume Bid/Ask par niveau de prix, delta, déséquilibre (imbalance) et distribution du volume. De nombreux graphiques ne vous montrent que le résultat final d'une bougie. OrderFlux vous montre le chemin pour y arr
Crystal Heikin Ashi Signals
Muhammad Jawad Shabir
5 (2)
Crystal Heikin Ashi Signals - Professional Trend & Signal Detection Indicator Advanced Heikin Ashi Visualization with Intelligent Signal System for Manual & Automated Trading Final Price: $149 ---------> Price goes up $10 after every 10 sales . Limited slots available — act fast . Overview Crystal Heikin Ashi Signals is a professional-grade MetaTrader 5 indicator that combines pure Heikin Ashi candle visualization with an advanced momentum-shift detection system. Designed for both manual traders
Super Signal Market Slayer Sans repaint | Haute précision | Indicateur de tendance intelligent multi-marchés En trading, la vraie difficulté n’est pas de passer un ordre, mais de distinguer clairement le début d’une tendance dans le bruit du marché. C’est pour cette raison que Market Slayer a été conçu. Il s’agit d’un indicateur intelligent sans repaint, spécialement développé pour le trading intraday. Grâce à une confirmation multi-niveaux et à un filtrage de tendance, il ne fournit des signau
L'indicateur « Dynamic Scalper System MT5 » est conçu pour la méthode de scalping, permettant de trader au sein des vagues de tendance. Testé sur les principales paires de devises et l'or, il est compatible avec d'autres instruments de trading. Fournit des signaux pour l'ouverture de positions à court terme le long de la tendance, avec un support supplémentaire pour les fluctuations de prix. Principe de l'indicateur : De grandes flèches déterminent la direction de la tendance. Un algorithme de
Ce tableau de bord affiche les derniers   modèles harmoniques   disponibles pour les symboles sélectionnés, ce qui vous permettra de gagner du temps et d'être plus efficace /   version MT4 . Indicateur gratuit:   Basic Harmonic Pattern Colonnes de l'indicateur Symbol :   les symboles sélectionnés apparaissent Trend   :   haussière ou baissière Pattern :   type de motif (gartley, papillon, chauve-souris, crabe, requin, cypher ou ABCD) Entry:   prix d'entrée SL:   prix du stop loss TP1:   1er
OmniSync Projection
Antonio-alin Teculescu
5 (1)
Chronos Fractal Engine is an innovative price projection indicator for MetaTrader 5, designed to transform your technical analysis by intelligently identifying and projecting historical price patterns. Built upon an advanced correlation algorithm and the fractal principles of the market, this powerful tool visualizes potential future price movements, giving you a unique edge in your trading decisions. What is Chronos Fractal Engine? At its core, the Chronos Fractal Engine employs a sophisticat
Meridian Pro
Ottaviano De Cicco
5 (2)
Meridian Pro 2.00: Professional Multi-Timeframe Trend Matrix for MT5 Meridian Pro 2.00 is a professional adaptive trend matrix for MetaTrader 5. It combines the original Meridian trend engine, a clean chart ribbon, closed-bar signal arrows, an 8-timeframe dashboard, Fuel momentum, weighted consensus, synthetic HTF processing and chart-native higher-timeframe context lines. The goal is simple: read current trend, multi-timeframe structure, strength, momentum and EA-ready state from one discipline
FX Power MT5 NG
Daniel Stein
5 (31)
FX Power : Analysez la force des devises pour des décisions de trading plus intelligentes Aperçu FX Power est l'outil essentiel pour comprendre la force réelle des principales devises et de l'or, quelles que soient les conditions du marché. En identifiant les devises fortes à acheter et les faibles à vendre, FX Power simplifie vos décisions de trading et révèle des opportunités à forte probabilité. Que vous suiviez les tendances ou anticipiez les retournements à l'aide de valeurs extrêmes de D
Market Structure Patterns
Samuel Manoel De Souza
4.47 (19)
Market Structure Patterns   est un indicateur basé sur les   Smart Money Concepts   qui affiche les   éléments SMC/ICT   pouvant améliorer vos décisions de trading. Profitez des   alertes ,   notifications push   et   emails   pour être informé lorsqu’un élément se forme sur le graphique, que le prix franchit un niveau et/ou entre dans une zone. Les développeurs peuvent accéder aux valeurs des éléments de l’indicateur via les   variables globales , permettant l’automatisation des décisions de t
Trend indicator AI mt5
Ramil Minniakhmetov
5 (17)
L'indicateur Trend Ai est un excellent outil qui améliorera l'analyse du marché d'un trader en combinant l'identification des tendances avec des points d'entrée exploitables et des alertes d'inversion. Cet indicateur permet aux utilisateurs de naviguer dans les complexités du marché forex avec confiance et précision Au-delà des signaux primaires, l'indicateur Trend Ai identifie les points d'entrée secondaires qui surviennent lors des retraits ou des retracements, permettant aux traders de capit
TREND LINES PRO   Cet indicateur permet de comprendre les véritables changements de direction du marché. Il révèle les renversements de tendance et les points de retour des principaux acteurs. Tu vois   Lignes BOS   Détection des changements de tendance et des niveaux clés sur des unités de temps supérieures, sans paramètres complexes ni interférences inutiles. Les signaux restent affichés sur le graphique même après la fermeture de la bougie. Version MT4   -   Révèle son potentiel maximal lorsq
The Zone Trading Indicator is a technical analysis tool for MetaTrader 5 that automatically identifies and displays tradable price zones across multiple timeframes to assist with structured market analysis. The indicator plots Monthly, Weekly, Daily, and H4 tradable zones , allowing traders to view higher- and lower-timeframe price areas simultaneously. These zones are designed to support one-candle–based entry approaches by highlighting predefined areas where price interaction may be monitored.
Filtrer:
Aucun avis
Répondre à l'avis