PivotScannerPro
- Indicateurs
-
Pravin Awari
 # About Algotraders24 AI
## Transforming Trading Through Artificial Intelligence - Version: 1.0
PivotScannerPro — Multi-Symbol Multi-Timeframe Pivot & EMA Scanner
PivotScannerPro is a free, all-in-one dashboard that scans multiple symbols across multiple timeframes at once — so you can spot trade opportunities without opening dozens of charts.
Built by the community, for the community.
WHAT IT DOES
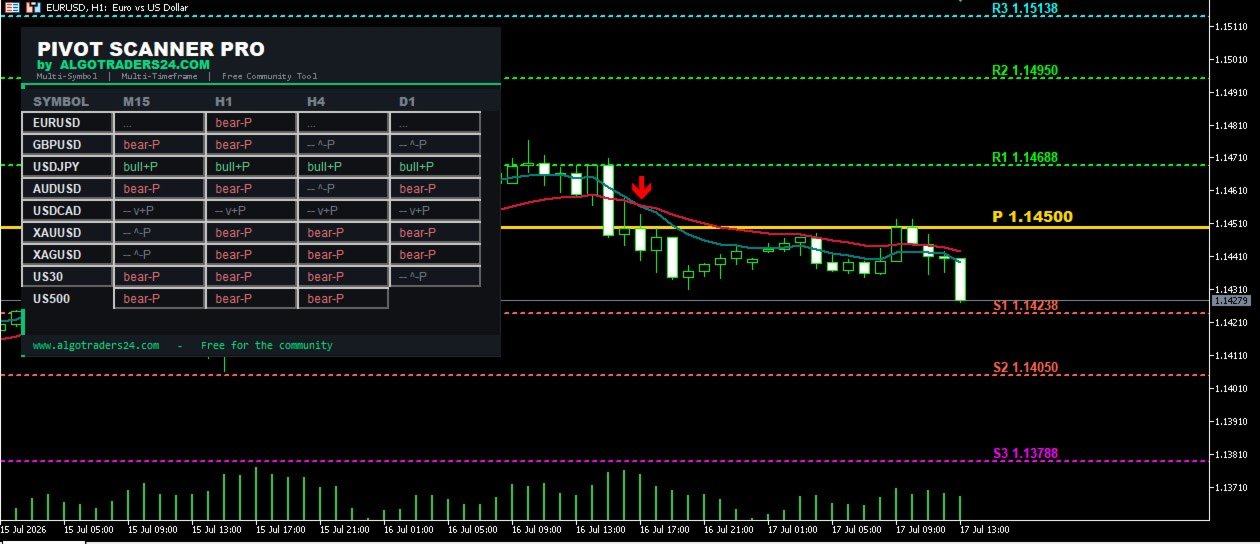
The scanner shows a clean dashboard with every symbol on the left and your chosen timeframes (M15 / H1 / H4 / D1) across the top. Each cell tells you three things at a glance:
-
SIGNAL — a fresh BUY or SELL based on EMA 9/21 crossover confirmed by the daily pivot
-
TREND — whether EMA 9 is above or below EMA 21
-
PIVOT SIDE — whether price is trading above (+P) or below (-P) the pivot
When ALL selected timeframes agree on the same direction, the row lights up as a STRONG signal — these multi-timeframe confluence setups are the highest-probability opportunities.
CLICK TO OPEN CHART
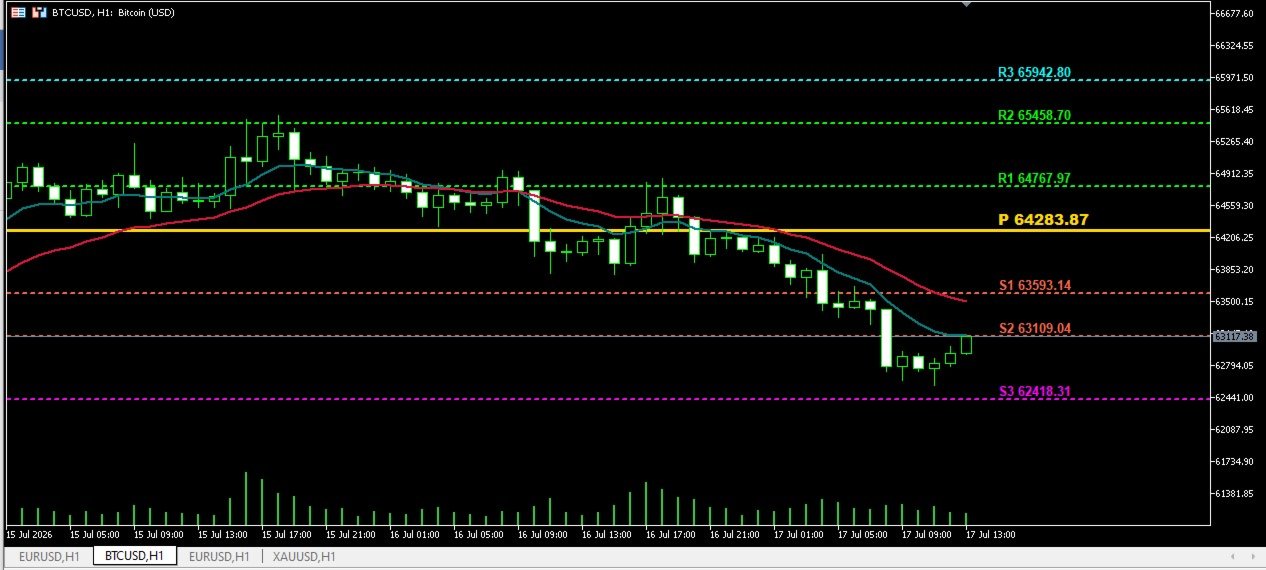
Click any cell in the dashboard and PivotScannerPro instantly opens that symbol on that timeframe — with pivot levels (P, R1, R2, R3, S1, S2, S3), EMA 9/21 lines, and buy/sell arrows drawn automatically. No template setup needed. Everything is built into a single file.
KEY FEATURES
-
Multi-symbol scanner (Forex, commodities, indices, crypto — fully customizable list)
-
Multi-timeframe view: M15, H1, H4, D1 side by side
-
EMA 9/21 crossover signals confirmed by pivot points
-
Strong-signal highlight when all timeframes align
-
One-click chart opening with indicators auto-attached
-
Classic pivot levels: P, R1/R2/R3, S1/S2/S3 (bold, colour-customizable)
-
On-screen price labels for every level
-
Popup and push-notification alerts on new signals
-
Works on any broker — just match the symbol names
-
Single file — nothing else to install
HOW TO USE
-
Attach PivotScannerPro to any one chart — it opens in SCANNER mode by default and shows the dashboard.
-
Edit the symbol list in the inputs to match your broker's exact symbol names (or enable "auto-use Market Watch symbols").
-
Watch the cells — green means bullish, red means bearish, and a glowing row means all timeframes agree.
-
Click any cell to open that market with full pivot + EMA analysis.
INPUTS
-
Symbols list (comma-separated) or auto Market Watch
-
Timeframes to scan (M15 / H1 / H4 / D1)
-
Fast EMA (default 9) and Slow EMA (default 21)
-
Pivot period (default Daily)
-
Pivot line colours and thickness
-
Alerts: popup / push on/off
-
Dashboard position, size, font
IMPORTANT — PLEASE READ
This indicator is provided free for educational purposes only. It is a technical analysis tool, NOT financial advice and NOT a guaranteed trading system. No indicator is correct 100% of the time. Always use proper risk management, use a stop loss on every trade, and test thoroughly on a demo account before risking real money. Trading carries a risk of loss. You are solely responsible for your own trading decisions.
Free for the community — from algotraders24.com