DynamicSwing vwap

EWMA-VWAP that automatically re-anchors at swing pivots, color-codes trend direction, and carries the prior segment forward until price invalidates it.


▶ WHAT IT DOES


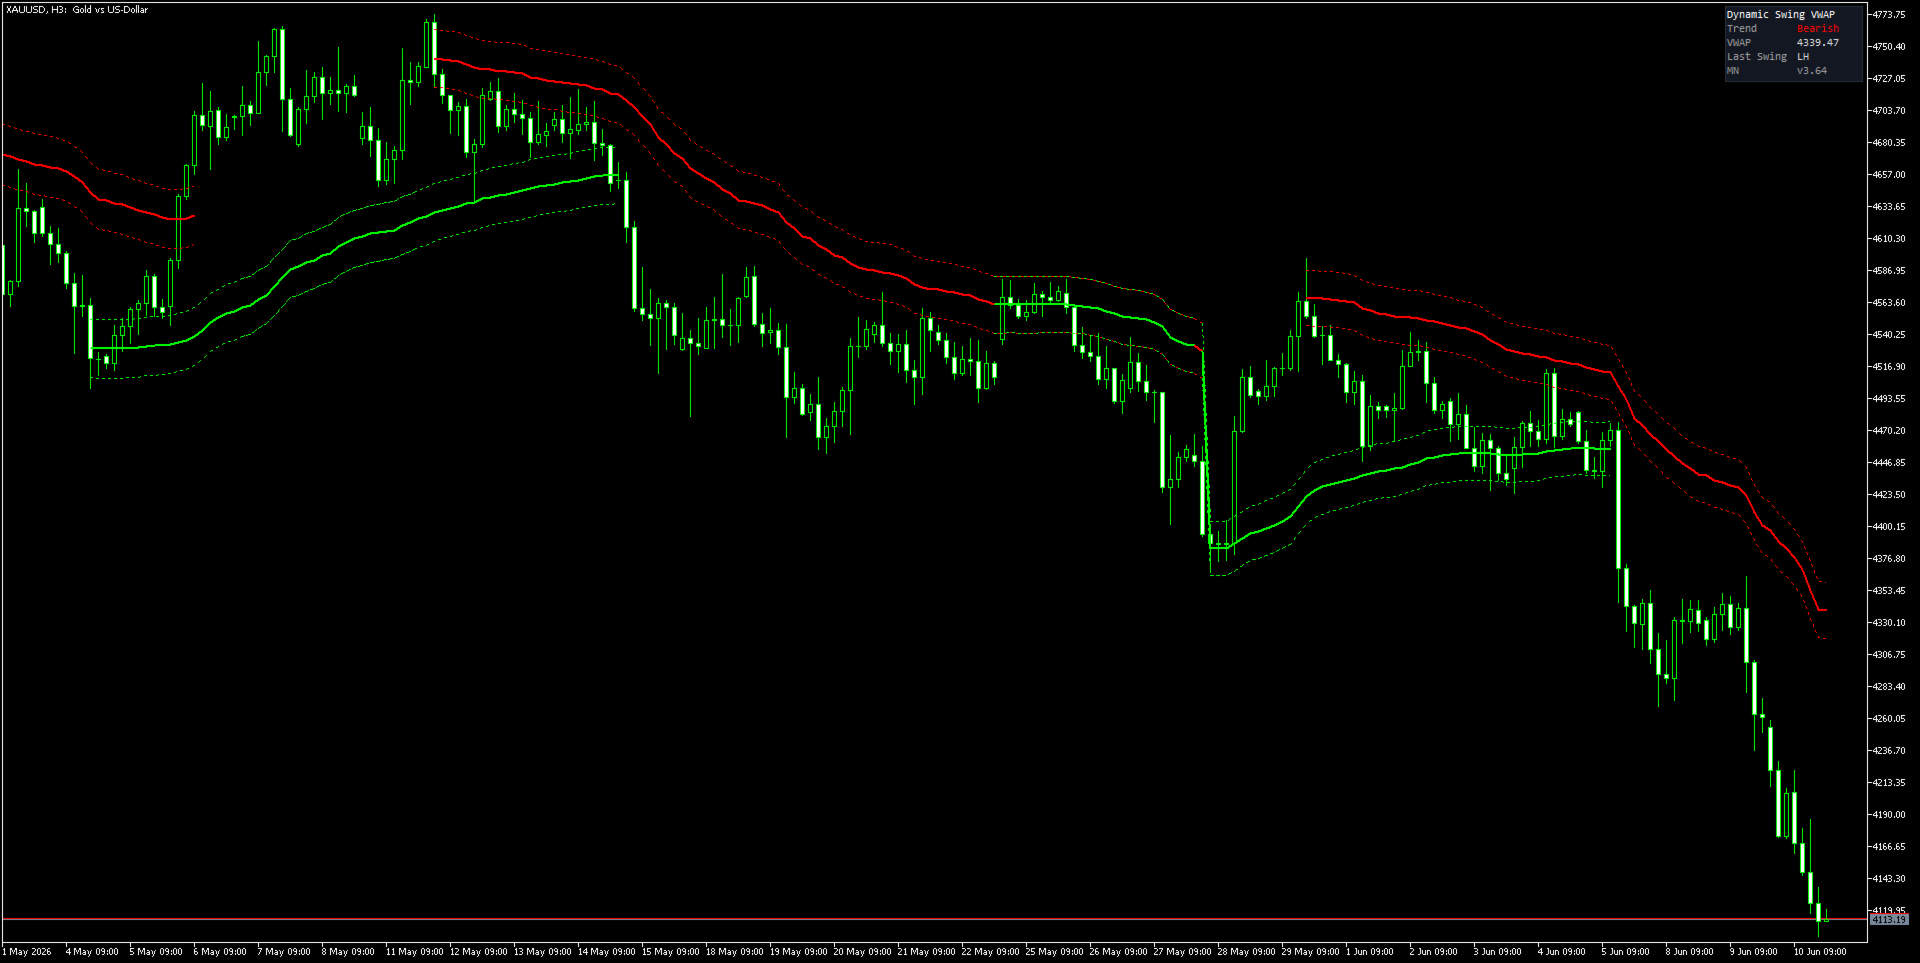
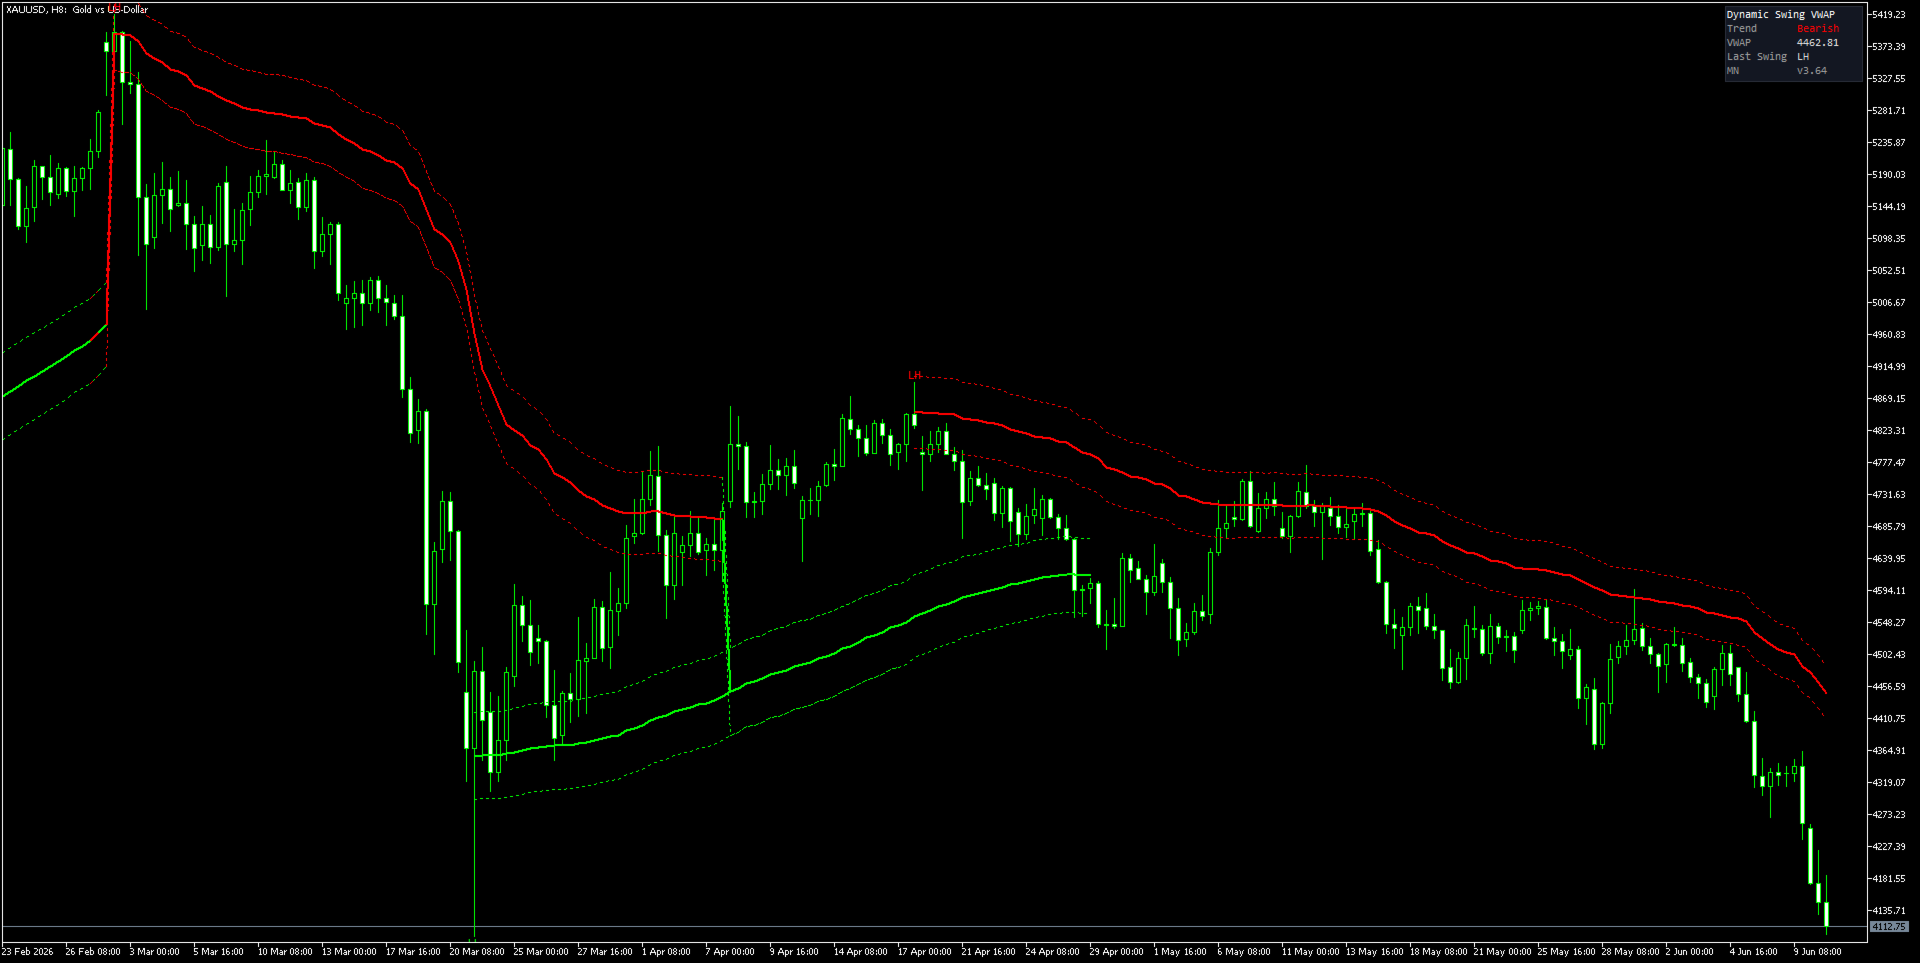
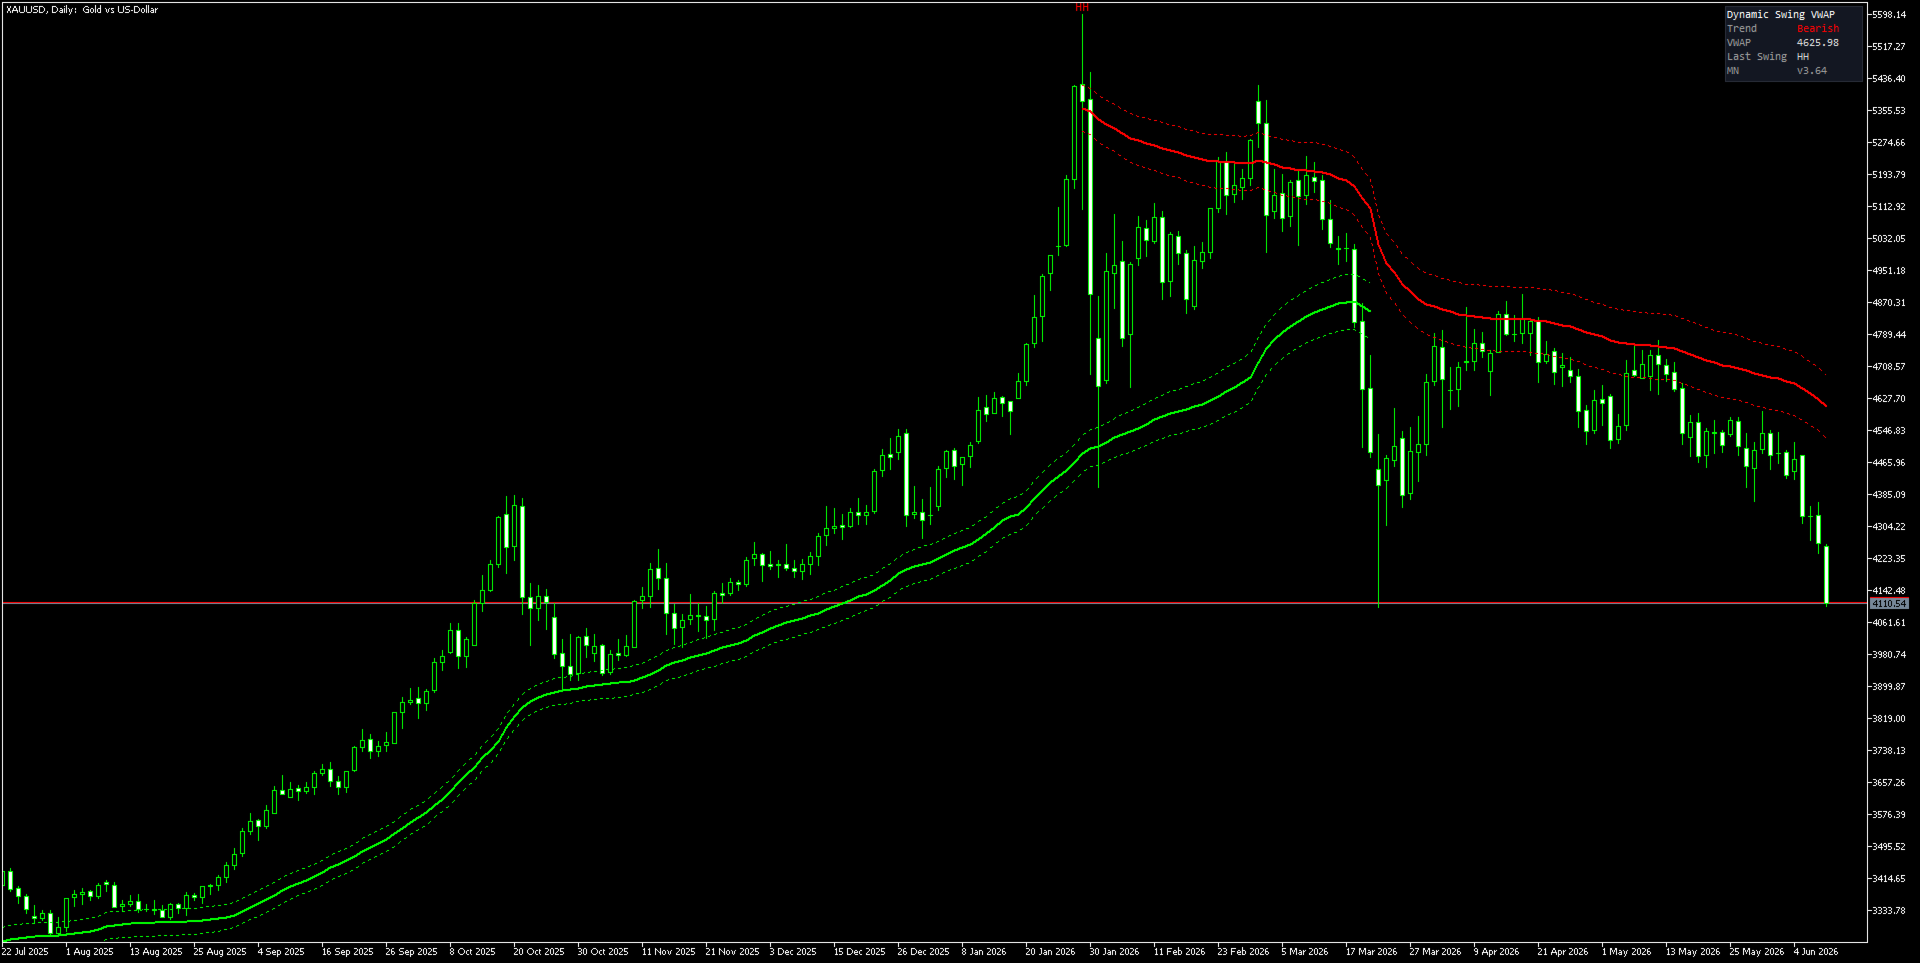
Dynamic Swing VWAP is an adaptive Volume-Weighted Average Price indicator that eliminates the guesswork of manual VWAP anchor selection. Instead of anchoring to a fixed session or calendar reset, it anchors automatically whenever the market forms a confirmed swing pivot — a Higher High, Lower Low, Lower High, or Higher Low — then re-anchors with every new structural swing.


The result is two simultaneous VWAP lines on your chart at all times:


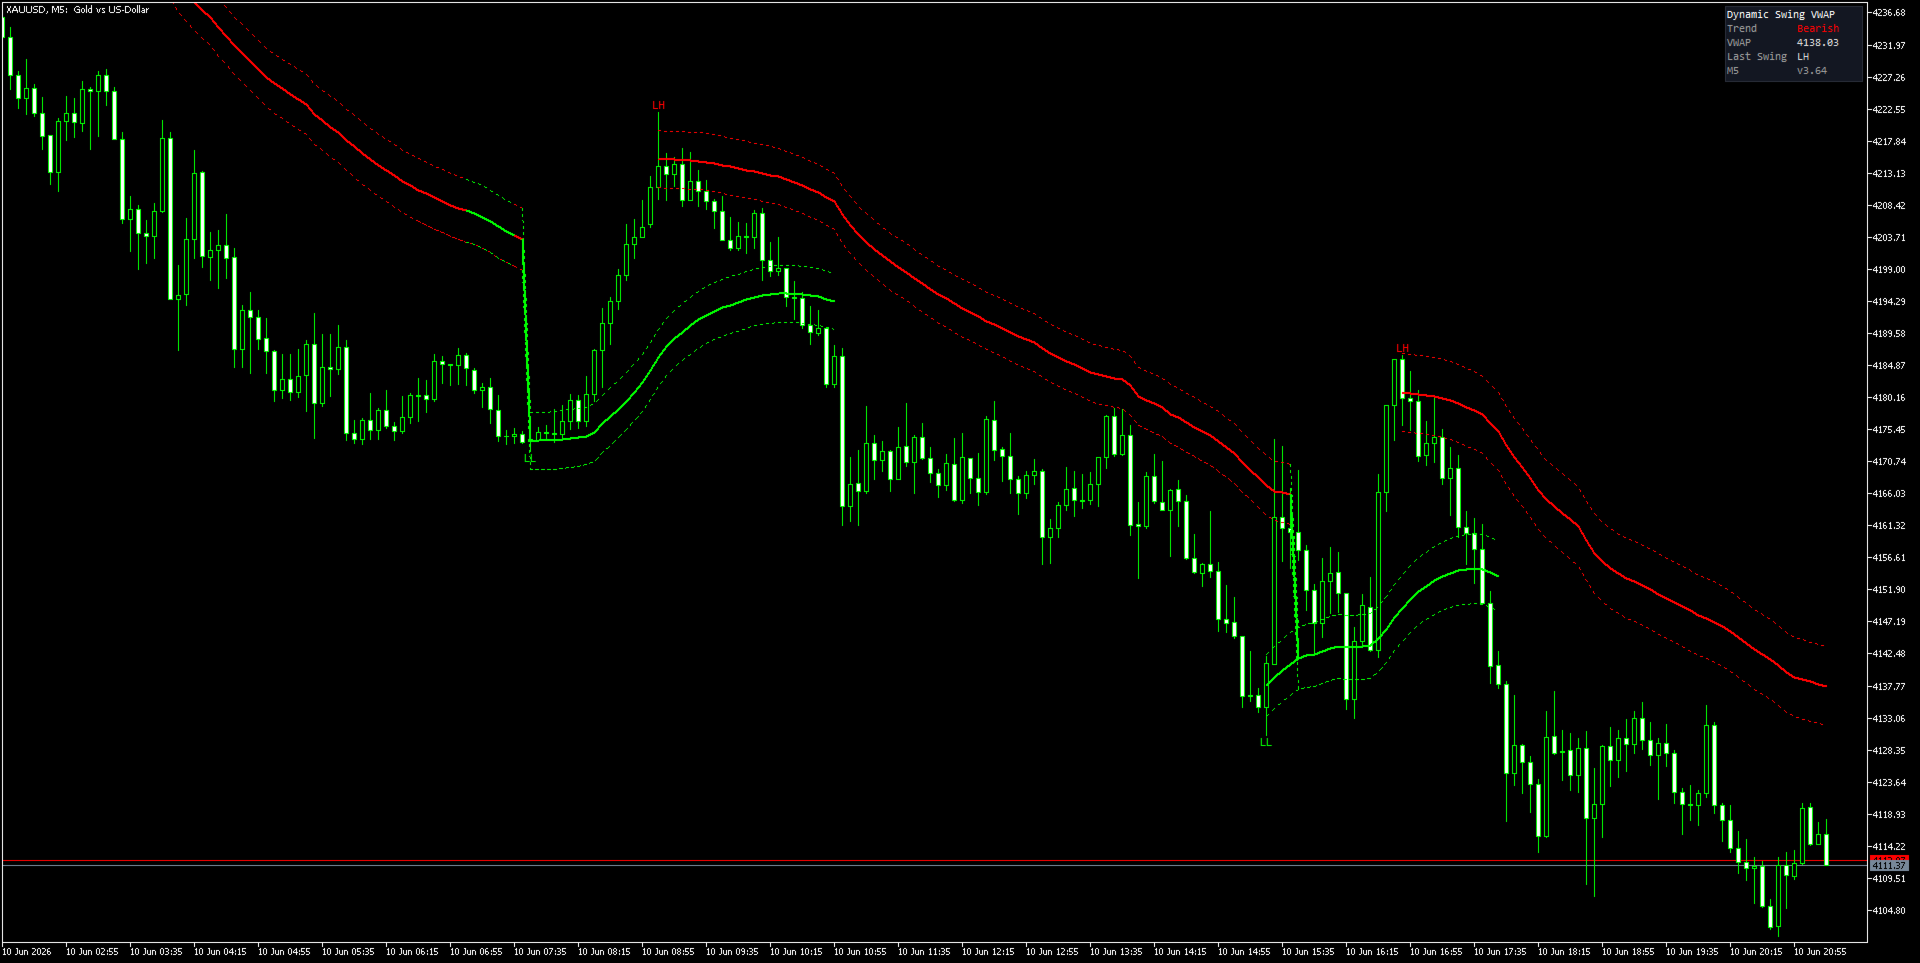
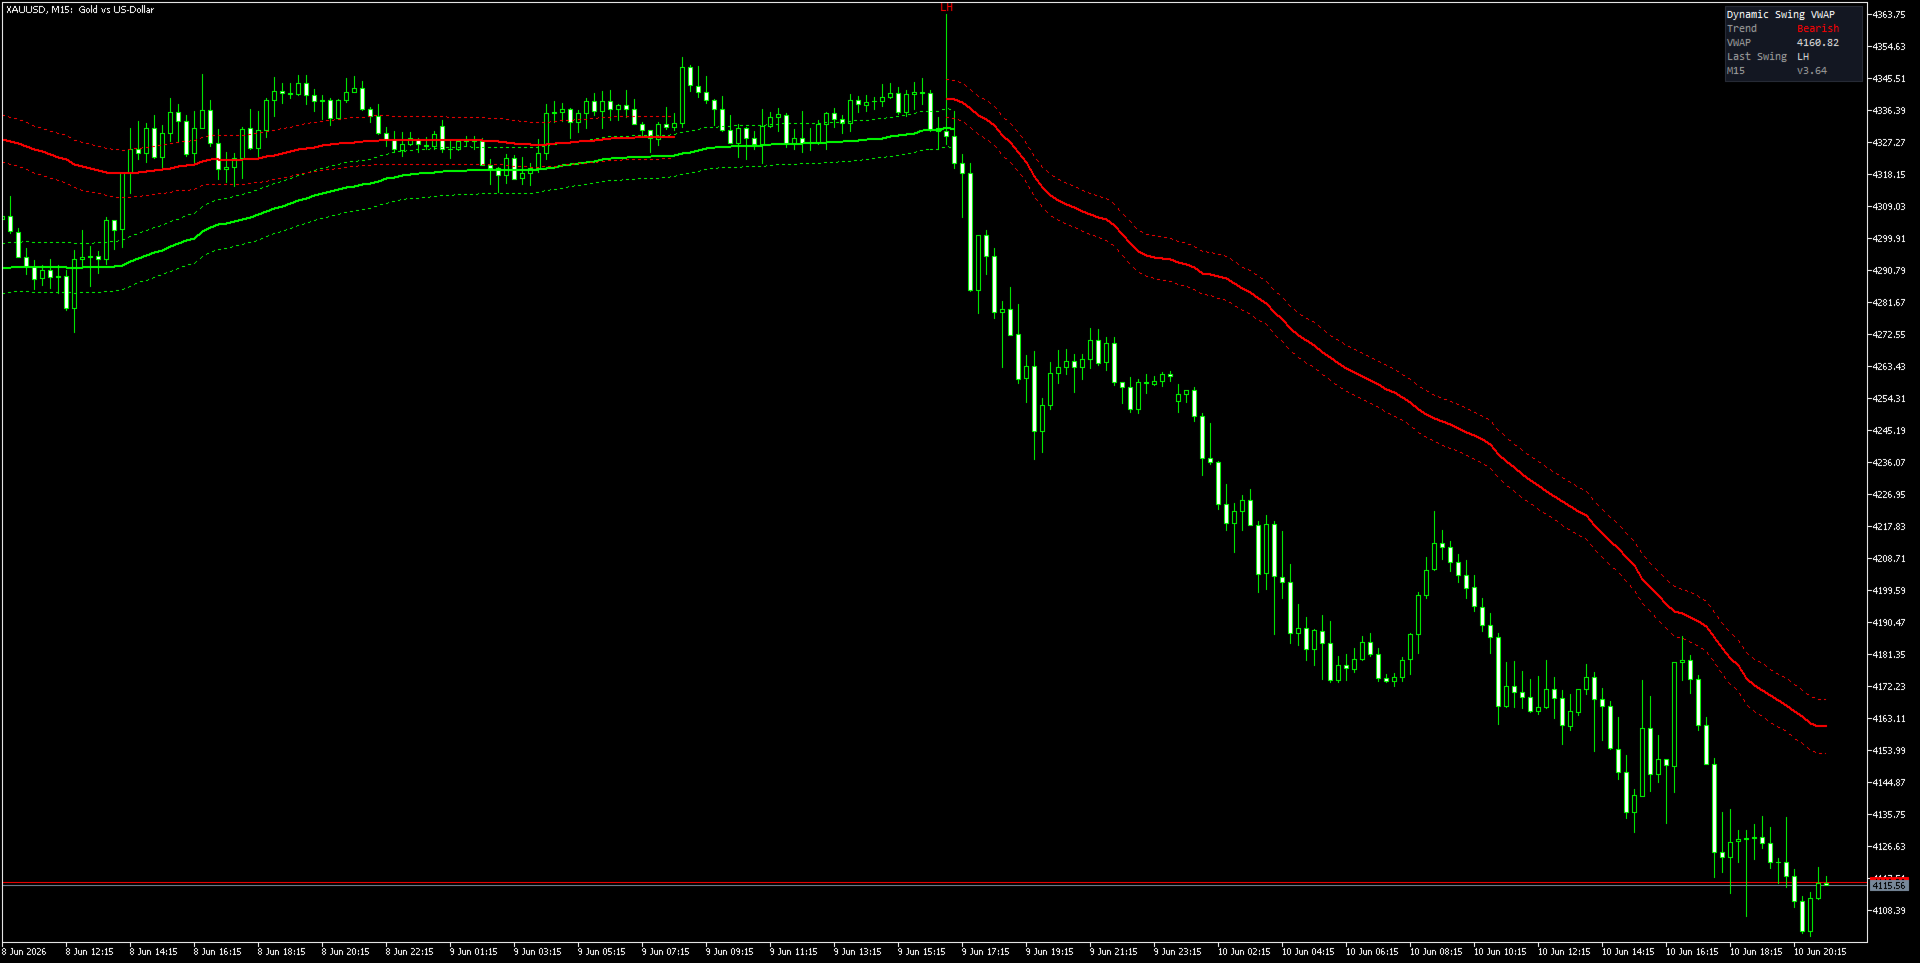
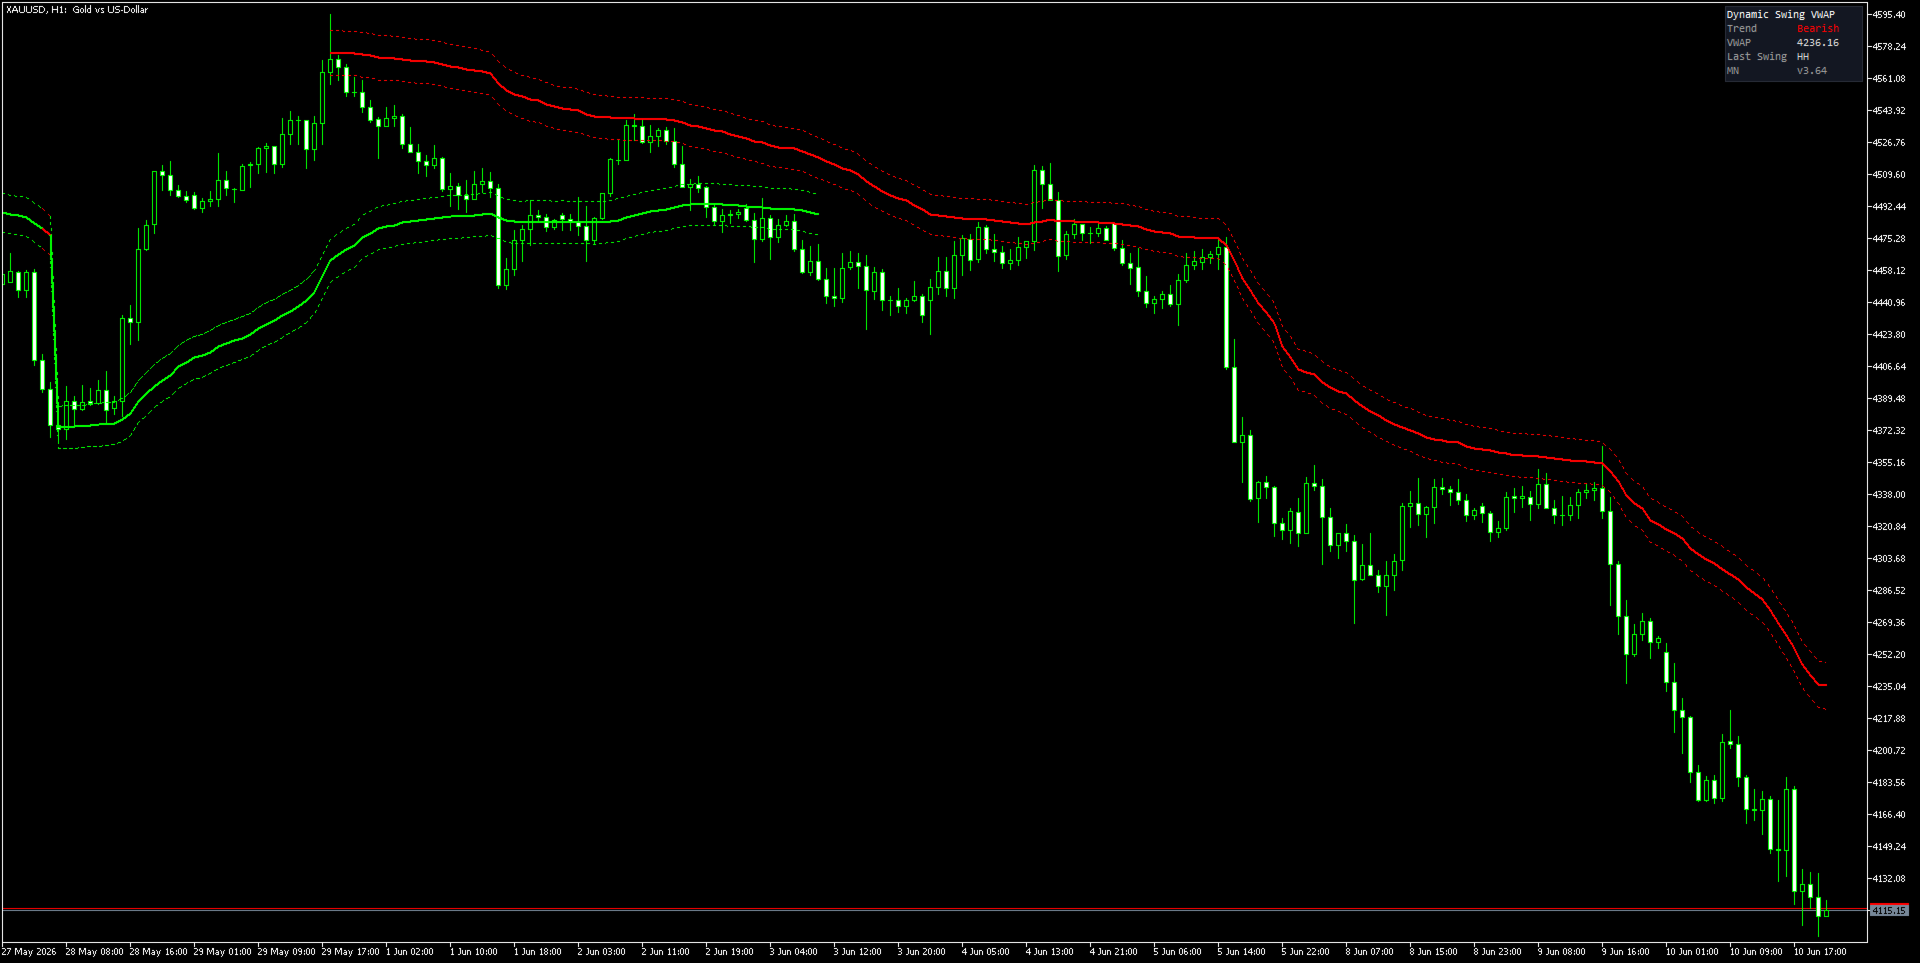
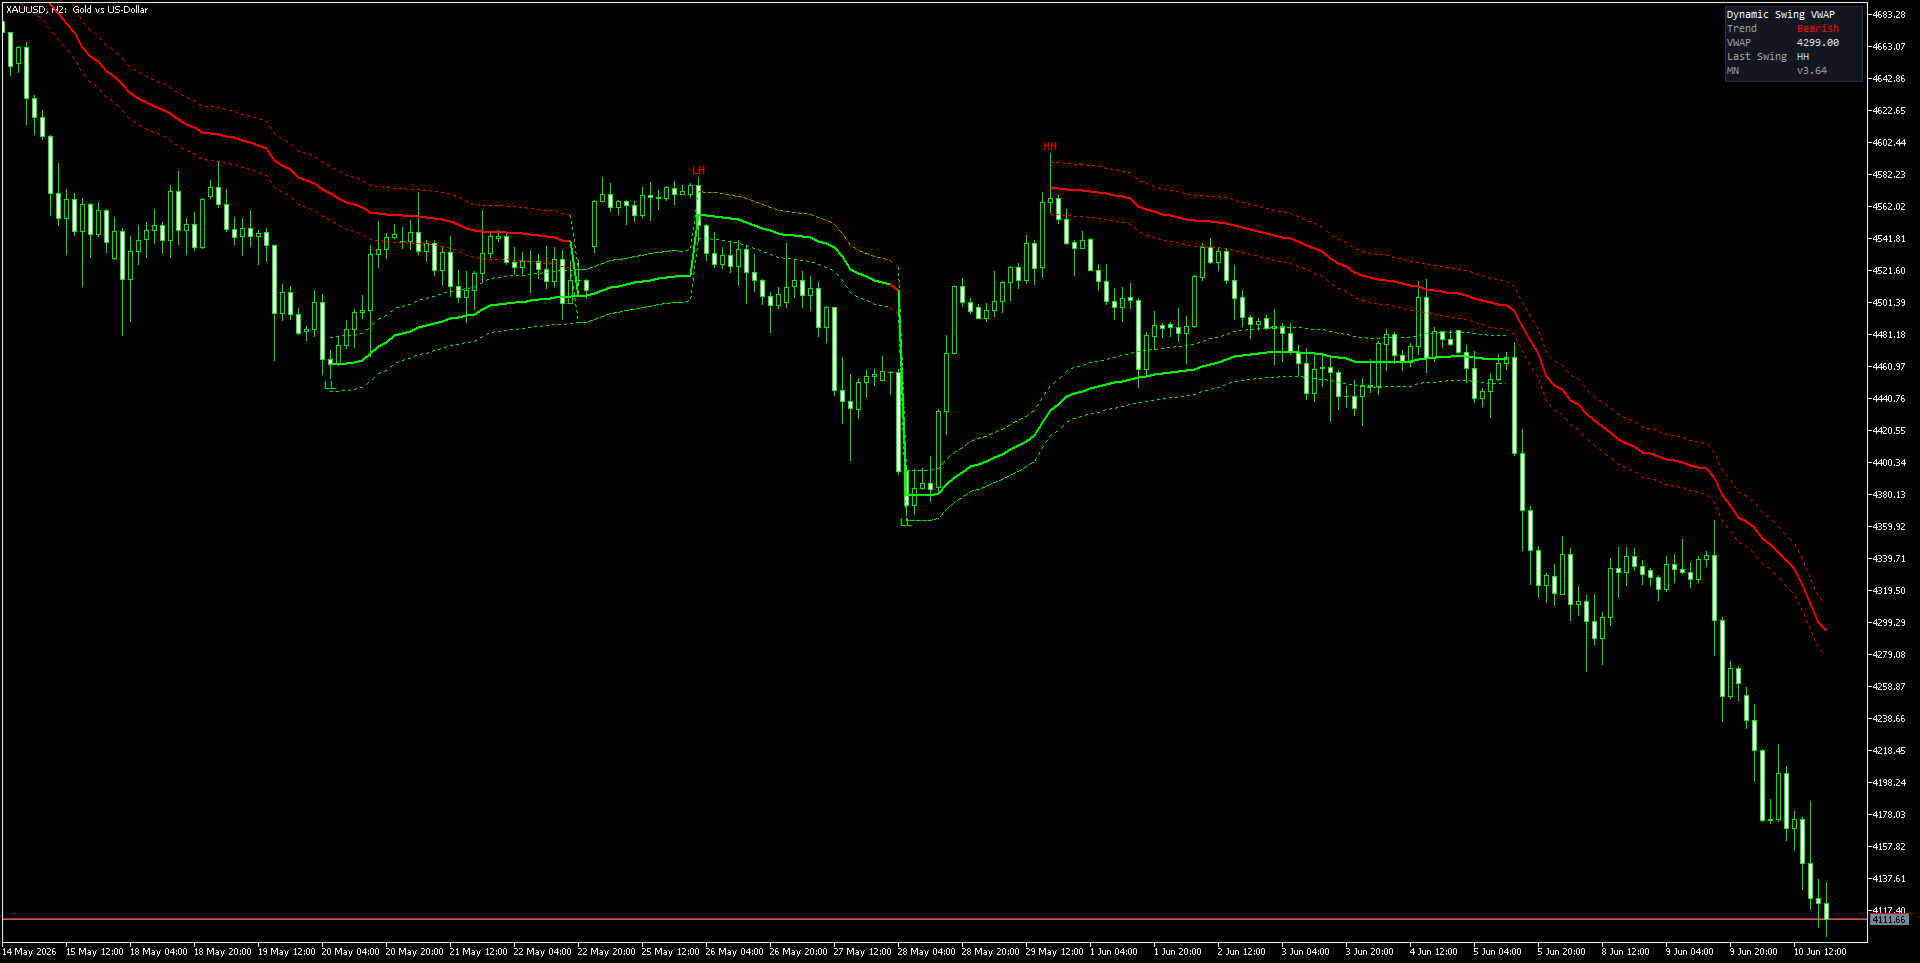
  • Active Segment (DS-VWAP) — the VWAP running from the most recent swing anchor forward, colored lime (bullish) or red (bearish) according to the current trend direction.


  • Previous Segment (DS-VWAP prev) — the VWAP from the segment just retired, continuing to advance and draw forward until price closes beyond its outer ATR band, at which point it fades. This "ghost" line lets you see at a glance whether the previous structure is still acting as support or resistance.


Each line is accompanied by optional ATR-scaled bands (upper and lower, dotted) that define dynamic support/resistance zones. Swing pivot labels (LL, HH, HL, LH, EL, EH, IL, IH) are placed directly on the chart at each pivot bar.


An on-chart dashboard panel (configurable corner) displays the current trend bias, live VWAP value, last swing type, and timeframe/version info.


▶ CORE FORMULA & DETECTION LOGIC


The VWAP computation uses an Exponential Weighted Moving Average (EWMA) formulation rather than a simple cumulative sum. The smoothing factor α is derived from an Adaptive Period Time (APT) parameter:


    α = 1 − exp(−ln(2) / max(1, APT))


Each bar, the numerator (price × volume) and denominator (volume) are updated:


    P_new  = (1−α)·P_old  + α·HLC3·vol_capped

    V_new  = (1−α)·V_old  + α·vol_capped

    VWAP   = P_new / V_new


Price used is the HLC3 typical price (High + Low + Close) / 3.


Volume is capped at 3× the 20-bar SMA of volume, with a fallback to the 50-bar rolling median when real volume is unavailable (tick volume is used automatically on instruments without real volume).


ATR bands: Band = VWAP ± (EWMA_ATR × BandMultiplier), where EWMA_ATR is a parallel exponential-smoothed ATR computed over 50 bars.


Adaptive APT (optional): When InpUseAdapt is enabled, APT is inversely scaled by the ratio of current ATR to its 50-bar average, raised to the power of InpVolBias. High-volatility environments tighten the APT (faster response); low-volatility environments widen it.


Swing detection: A bar is classified as a swing high (or low) if it is the highest high (lowest low) within the preceding InpSwingPeriod bars, evaluated on bar close. The most recent swing high and low bar indices are tracked; whichever was more recent determines the current trend direction (g_dir). A flip in g_dir triggers an anchor handoff.


Anchor re-seeding: When a new anchor fires, the active segment state is handed to the previous-segment slot, and the new active segment is seeded from the pivot bar with a 5-bar ramp-up smoothing (when InpSmoothAnchor is enabled) to suppress the sharp initial VWAP discontinuity.


Previous-segment invalidation: The previous VWAP continues advancing each bar using the same EWMA formula. It is invalidated — and stops drawing — when the closing price crosses beyond the previous segment's outer band (VWAP_prev ± EWMA_ATR_prev × BandMult).


▶ WHAT MAKES THIS DIFFERENT


  1. DUAL-SEGMENT DISPLAY — most swing-anchored VWAP tools show only the current segment. This indicator also carries the prior segment forward dynamically, giving you a second contextual reference without cluttering the chart with permanent historical lines.


  2. EWMA FORMULATION — unlike cumulative-sum VWAP (which gives equal weight to every bar from anchor to present), the EWMA formulation makes recent price/volume interactions more influential. This makes the VWAP more responsive to intraday structure changes.


  3. SELF-INVALIDATING PREVIOUS SEGMENT — the prior VWAP does not linger indefinitely. It disappears the moment price commits beyond its band, so the chart stays clean and the remaining line is always actionable.


  4. VOLUME CAPPING — volume spikes (news events, open/close surges) are capped at 3× the rolling SMA to prevent a single high-volume bar from distorting the VWAP anchor.


  5. STRUCTURAL PIVOT LABELS — every swing inflection is labeled with its market structure classification (LL/HH/HL/LH/EL/EH/IL/IH), giving a built-in market structure map alongside the VWAP.


  6. OPTIONAL ANCHOR FILTER — the InpOnlyLLHH flag restricts re-anchoring to only confirmed Lower Lows and Higher Highs, filtering out internal retracements when you only want anchors at major structure breaks.


▶ KEY PARAMETERS TABLE


┌──────────────────┬──────────────┬────────────────────────────────────────────────────────────────┐

│ Parameter        │ Default      │ Description                                                    │

├──────────────────┼──────────────┼────────────────────────────────────────────────────────────────┤

│ InpSwingPeriod   │ 55           │ Lookback bars for swing high/low detection. Larger = fewer,     │

│                  │              │ more significant pivots. Range 5–200 recommended.               │

├──────────────────┼──────────────┼────────────────────────────────────────────────────────────────┤

│ InpBaseAPT       │ 21.0         │ Base Adaptive Period Time. Controls EWMA smoothing speed.        │

│                  │              │ Lower = faster response, higher = smoother. Range 5–300.        │

├──────────────────┼──────────────┼────────────────────────────────────────────────────────────────┤

│ InpUseAdapt      │ false        │ Enable adaptive APT scaling by ATR ratio. When true, APT        │

│                  │              │ automatically tightens in high-volatility, widens in quiet.     │

├──────────────────┼──────────────┼────────────────────────────────────────────────────────────────┤

│ InpVolBias       │ 10.0         │ Exponent applied to ATR ratio in adaptive mode. Higher values   │

│                  │              │ amplify the adaptive effect. Active only when InpUseAdapt=true. │

├──────────────────┼──────────────┼────────────────────────────────────────────────────────────────┤

│ InpVolCap        │ true         │ Cap volume at 3× 20-bar SMA to suppress volume-spike distortion.│

├──────────────────┼──────────────┼────────────────────────────────────────────────────────────────┤

│ InpSmoothAnchor  │ true         │ Apply 5-bar ramp-up when seeding a new anchor to reduce the     │

│                  │              │ visible VWAP discontinuity at re-anchor events.                 │

├──────────────────┼──────────────┼────────────────────────────────────────────────────────────────┤

│ InpOnlyLLHH      │ false        │ Restrict re-anchoring to confirmed LL and HH pivots only.       │

│                  │              │ Ignores HL/LH internal swings for a higher-timeframe feel.      │

├──────────────────┼──────────────┼────────────────────────────────────────────────────────────────┤

│ InpShowBands     │ true         │ Show ATR-scaled upper and lower deviation bands (dotted lines). │

├──────────────────┼──────────────┼────────────────────────────────────────────────────────────────┤

│ InpBandMult      │ 0.618        │ ATR multiplier for band width. 0.618 (phi) for tight zones;     │

│                  │              │ 1.0–1.5 for wider standard-deviation style bands.               │

├──────────────────┼──────────────┼────────────────────────────────────────────────────────────────┤

│ InpShowPivots    │ true         │ Display swing pivot labels (LL/HH/HL/LH/EL/EH/IL/IH) on chart. │

├──────────────────┼──────────────┼────────────────────────────────────────────────────────────────┤

│ InpBullColor     │ Lime         │ Color for bullish (uptrend) VWAP and bands.                     │

├──────────────────┼──────────────┼────────────────────────────────────────────────────────────────┤

│ InpBearColor     │ Red          │ Color for bearish (downtrend) VWAP and bands.                   │

├──────────────────┼──────────────┼────────────────────────────────────────────────────────────────┤

│ InpLineWidth     │ 2            │ Width of the main VWAP line (1–5). Bands always draw at width 1.│

├──────────────────┼──────────────┼────────────────────────────────────────────────────────────────┤

│ InpShowDash      │ true         │ Show the on-chart info dashboard panel.                         │

├──────────────────┼──────────────┼────────────────────────────────────────────────────────────────┤

│ InpDashPos       │ "Top Right"  │ Dashboard position: "Top Right", "Top Left", "Bottom Right",    │

│                  │              │ "Bottom Left".                                                  │

├──────────────────┼──────────────┼────────────────────────────────────────────────────────────────┤

│ InpLookbackBars  │ 2000         │ Maximum bars to process on full recalculation. Set to 0 for     │

│                  │              │ unlimited (may be slow on long histories).                      │

└──────────────────┴──────────────┴────────────────────────────────────────────────────────────────┘


▶ COMPATIBILITY


  • Platform: MetaTrader 5 (build 2755+)

  • Instruments: All — Forex, Indices, Commodities, Crypto, Stocks

  • Timeframes: All — works on M1 through MN; recommended M5, M15, H1, H4

  • Real volume / tick volume: Auto-detected (uses real volume when available, tick volume as fallback)

  • Buffers used: 12 (6 data + 6 color-index buffers for DRAW_COLOR_LINE)

  • Chart type: Main window overlay


▶ HOW TO USE


  1. INSTALLATION

     Copy DynamicSwingVWAP.mq5 to: [MT5 Data Folder]\MQL5\Indicators\

     In MetaEditor, compile the file (F7). The indicator appears in the Navigator panel.


  2. ATTACH

     Drag onto any chart. The default settings (InpSwingPeriod=55, InpBaseAPT=21) are tuned for M15–H1 charts on major Forex pairs.


  3. READING THE CHART

     • Lime (green) VWAP line = current bullish segment; price above = bullish bias

     • Red VWAP line = current bearish segment; price below = bearish bias

     • The dimmer/older-colored line is the previous segment (labeled "DS-VWAP prev")

     • Dotted lines above/below = ATR bands — support/resistance zones

     • Triangle labels = pivot classification (LL, HH, HL, LH, EL, EH, IL, IH)


  4. TUNE FOR TIMEFRAME

     • Scalping (M1–M5): InpSwingPeriod=21, InpBaseAPT=10

     • Intraday (M15–H1): InpSwingPeriod=55, InpBaseAPT=21 (defaults)

     • Swing (H4–D1): InpSwingPeriod=89–144, InpBaseAPT=34–55


  5. USE BANDS AS ENTRIES

     Price returning to the active VWAP line or its lower band (in a bullish segment) is

     a mean-reversion zone. Price rejecting the upper band can signal a continuation pullback.


  6. PREVIOUS SEGMENT AS S/R

     The previous-segment VWAP often acts as support after a bullish re-anchor, and

     resistance after a bearish one. Watch for it to vanish — that confirms the prior

     structure has been invalidated.


  7. ALERTS (not present in v1.0 — see roadmap)

     Alert support for anchor events and band breaks is planned for v1.1.

Produits recommandés
L'indicateur SMC Venom Model BPR est un outil professionnel pour les traders travaillant dans le concept Smart Money (SMC). Il identifie automatiquement deux modèles clés sur le graphique des prix: FVG   (Fair Value Gap) est une combinaison de trois bougies, dans laquelle il y a un écart entre la première et la troisième bougie. Forme une zone entre les niveaux où il n'y a pas de support de volume, ce qui conduit souvent à une correction des prix. BPR   (Balanced Price Range) est une combinaiso
Profile Map MT5
Dmitriy Sapegin
5 (5)
Market Profile helps the trader to identify the behavior if major market players and define zones of their interest. The key feature is the clear graphical display of the range of price action, in which 70% of the trades were performed. Understanding of the location of volume accumulation areas can help traders increase the probability of success. The tool can be used as an independent system as well as in combination with other indicators and trading systems. this indicator is designed to suit
VolumeProfile MT5
Robert Hess
4.14 (7)
Description: The Volume Profile displays detailed informations of historical trading activities at certain price levels (Market Profile). Locate the areas with the best prices in the market and get an advantage over other market participants. Features: Customizable Market Profile Shows the "fair" Value Area with 70% of all Volume Shows critical low volume zones Shows VPOC, VAL and VAH Points integrated resource management to reduce the load while working with multiple charts Works on all timefr
ALIEN Dashboard
Youssef Esseghaiar
ALIEN DASHBOARD FULL EDITION – Professional ICT & Precision Trading Dashboard for MT5 ( HYBRID ENGINE ) Overview The   Alien Dashboard Full Edition   is a comprehensive, all‑in‑one technical indicator for MetaTrader 5 that merges the most powerful concepts from Inner Circle Trader (ICT) methodology with advanced precision‑entry logic, multi‑timeframe analysis, and an intuitive on‑chart dashboard. Designed for serious traders who want to visualise institutional order flow, identify high‑probabili
Was: $249  Now: $99   Market Profile defines a number of day types that can help the trader to determine market behaviour. A key feature is the Value Area, representing the range of price action where 70% of trading took place. Understanding the Value Area can give traders valuable insight into market direction and establish the higher odds trade. It is an excellent addition to any system you may be using. Inspired by Jim Dalton’s book “Mind Over Markets”, this indicator is designed to suit the
SPECIAL LAUNCH OFFER: $30 (1-Month Rent) Limited time offer to build our community and gather feedback! AmbM GOLD Institutional Scalper A high-precision M5 algorithm for XAUUSD (Gold) , engineered to trade exclusively at Institutional Liquidity Levels ($5/$10 psychological marks). PERFORMANCE DATA (BUY ONLY) • Win Rate: 87.09%. • Safe Growth: +$4,113 profit on $10k (13.75% Max Drawdown). • Extreme Stress Test: Successfully generated +$22,997 in a 5-year stress test (2020-2026), proving
Mine Farm
Maryna Kauzova
Mine Farm is one of the most classic and time-tested scalping strategies based on the breakdown of strong price levels. Mine Farm is the author's modification of the system for determining entry and exit points into the market... Mine Farm - is the combination of great potential with reliability and safety. Why Mine Farm?! - each order has a short dynamic Stop Loss - the advisor does not use any risky methods (averaging, martingale, grid, locking, etc.) - the advisor tries to get the most
VWAP Daily
Anton Polkovnikov
Weighted average price indicator or VWAP. The well-known standard VWAP with the beginning of the day is added with the function of selecting the periodization. It can be calculated both every day and on other periods. Also the indicator allows to exclude the volume from the calculation, which will allow using it on the cryptocurrencies and forex. There is an alert for a VWAP price crossing. There are 1 and 2 standard deviation. Settings: Volume: turning volume on and off in the calculation mecha
VOLUME PROFILE SAF-XII Analyse Market Profile Professionnelle pour MT5 (L'indicateur idéal pour le trading de type Grid) QU'EST-CE QUE LE VOLUME PROFILE ? Le Volume Profile est un outil institutionnel qui affiche l'activité de trading à des niveaux de prix spécifiques, contrairement aux indicateurs de volume classiques qui montrent le volume en fonction du temps. Il révèle OÙ les transactions ont eu lieu, aidant ainsi à identifier : ZONES DE VALEUR (VAH/VAL) – Niveaux de prix où la majorité des
Intraday Session TPO: Precision Volume Profiling for Day Traders Stop trading blind during the most volatile hours of the day. Standard daily volume profiles blend everything together, masking the true areas of liquidity and institutional interest. The Intraday Session TPO is engineered specifically for session-to-session traders. It empowers you to isolate and profile specific time windows—like the London Open, the New York Killzone, or the Asian range—so you can see exactly where the volume is
This Volume Delta Profile is an advanced MetaTrader 5 indicator that visualizes   volume delta (order flow imbalance)   using a volume profile-style histogram. It shows the difference between buying and selling pressure at specific price levels, helping traders identify supply and demand zones. This indicator provides a unique perspective on market dynamics by visualizing the imbalance between buying and selling pressure, offering insights beyond traditional volume analysis. Core Concept Positiv
This indicator allows you to enjoy the two most popular products for analyzing request volumes and market deals at a favorable price: Actual Depth of Market Chart Actual Tick Footprint Volume Chart This product combines the power of both indicators and is provided as a single file. The functionality of Actual COMBO Depth of Market AND Tick Volume Chart is fully identical to the original indicators. You will enjoy the power of these two products combined into the single super-indicator! Below is
L'indicateur construit les cotations actuelles, qui peuvent être comparées aux cotations historiques et, sur cette base, faire une prévision de l'évolution des prix. L'indicateur dispose d'un champ de texte pour une navigation rapide jusqu'à la date souhaitée. Option : Symbole - sélection du symbole que l'indicateur affichera ; SymbolPeriod - sélection de la période à partir de laquelle l'indicateur prendra des données ; IndicatorColor - couleur de l'indicateur ; HorisontalShift - décalage
Le niveau Premium est un indicateur unique avec une précision de plus de 80 % des prédictions correctes ! Cet indicateur a été testé par les meilleurs Trading Specialists depuis plus de deux mois ! L'indicateur de l'auteur que vous ne trouverez nulle part ailleurs ! À partir des captures d'écran, vous pouvez constater par vous-même la précision de cet outil ! 1 est idéal pour le trading d'options binaires avec un délai d'expiration de 1 bougie. 2 fonctionne sur toutes les paires de devises
Fvg Edge
Ahmad Meftah Abdulsalam Alawwami
5 (3)
FVG Smart Zones – Édition Gratuite Indicateur de Détection des Gaps de Valeur Juste pour MetaTrader 5 (MT5) Vous recherchez un véritable outil de trading – pas juste un autre indicateur au hasard ? FVG Smart Zones – Édition Gratuite offre une vision professionnelle du marché en détectant automatiquement les Gaps de Valeur Juste (FVG) et en mettant en évidence des zones de trading à haute probabilité directement sur votre graphique. Conçu pour les traders suivant : Smart Money Concepts (
FREE
Best SAR MT5
Ashkan Hazegh Nikrou
4.33 (3)
La description :  nous sommes heureux de vous présenter notre nouvel indicateur gratuit basé sur l'un des indicateurs professionnels et populaires du marché des changes (PSAR). Cet indicateur est une nouvelle modification de l'indicateur SAR parabolique original. Dans l'indicateur pro SAR, vous pouvez voir un croisement entre les points et le graphique des prix. le croisement n'est pas un signal mais parle du potentiel de fin de mouvement, vous pouvez commencer à acheter par un nouveau point b
FREE
Advanced MT5 Indicator: Precision-Powered with Pivot Points, MAs & Multi-Timeframe Logic Unlock the full potential of your trading strategy with this precision-engineered MetaTrader 5 indicator —an advanced tool that intelligently blends Pivot Points , Adaptive Moving Averages , and Multi-Timeframe Analysis to generate real-time Buy and Sell signals with high accuracy.    If you want to test on Real Market, Let me know. I will give the Demo file to run on Real Account.    Whether you're a scal
Here   our more valuable tools SMC Trend Trading   ,  Easy SMC Trading  ,  Institutional SMC Architect Volume Analysis Tools  ,  Volume flow Profile  ,  Market volume profile  , FVG with Volume  , Liquidity Heatmap Profile  ,  Volume Spread Analysis The    Liquidity Heatmap   is a sophisticated institutional trading tool designed to reveal where over-leveraged traders are trapped. By calculating estimated liquidation levels based on volume spikes and leverage, this indicator draws a dynamic "h
Breakout Boxes with Volume Pressure This indicator automates the identification of key consolidation zones (Supply and Demand) based on Market Pivots and Volatility (ATR). Unlike standard support/resistance tools, this indicator provides a unique   Volume Pressure Analysis   inside every box, giving you insight into the battle between Buyers and Sellers before a breakout occurs. Key Features Automated Supply & Demand Zones:   Automatically detects significant Pivot Highs and Lows to draw dyna
Noize Absorption Index - is the manual trading system that measures the difference of pressure between bears forces and bulls forces. Green line - is a noize free index that showing curent situation. Zero value of index shows totally choppy/flat market.Values above zero level shows how powerfull bullish wave is and values below zero measures bearish forces.Up arrow appears on bearish market when it's ready to reverse, dn arrow appears on weak bullish market, as a result of reverse expectation.
L'indicateur DYJ BoS identifie et marque automatiquement les éléments essentiels des changements de structure du marché, notamment : Rupture de structure (BoS) : détectée lorsque le prix effectue un mouvement significatif, franchissant un point de structure précédent. Il marque les lignes de tendance haussière et baissière possibles (UP & DN, c'est-à-dire de nouveaux sommets et de nouveaux creux continus), et une fois que le prix franchit ces lignes, il marque des flèches rouges (BEAR) et ver
Initial Balance MT5
Ricardo Almeida Branco
The Initial Balance (Initial Balance / Initial Balance) is a concept related to the study of volume (to learn more, study about Market Profile and Auction Market Theory. You can find some videos in English when searching for "Initial Balance Market Profile"). The IB defines a range in which prices were negotiated in the first hour of trading.The amplitude of the range is important and the break in the range defined by the Initial Balance may have occurred due to the movement of several players
Définir TP et SL par Prix – Modificateur automatique d’ordres pour MT5 Définissez automatiquement des niveaux de TP et SL précis sur toute opération ️ Fonctionne avec toutes les paires et tous les EAs, filtrage par symbole ou Magic Number Cet Expert Advisor vous permet de définir et d’appliquer des niveaux exacts de Take Profit (TP) et Stop Loss (SL) à l’aide de valeurs de prix directes (ex. : 1.12345 sur EURUSD). Aucun point, aucun pip. Une gestion de trade propre et précise, sur toutes l
Professional Opening Range Breakout (ORB) indicator designed for precision session trading with automatic time handling, breakout alerts, and advanced target levels. This indicator automatically identifies the Opening Range for any configurable session, plots the High, Low, and Midpoint levels, and extends them across the trading day. Built-in breakout detection and alerts, range measurements, and extension targets provide traders with clear structure and actionable levels. Ideal for traders usi
BTC Master Pro
Farzad Saadatinia
4.58 (12)
BTC Master Pro — votre partenaire de confiance pour un trading discipliné du Bitcoin. La nouvelle version est désormais renforcée par l’intelligence artificielle OpenAI , offrant une exécution plus intelligente et un filtrage optimisé des transactions dans des conditions de forte volatilité du marché crypto. Ce robot de trading professionnel (Expert Advisor) est spécialement conçu pour le trading du Bitcoin (BTCUSD) sur la plateforme MetaTrader 5 , en mettant l’accent sur une exécution structuré
Introducing the B4S BidLine CandleTimer An insightful indicator that combines real-time bid line visualization with a dynamic countdown timer. Gain a competitive edge in your trading as you stay informed about the time remaining until the next candle starts, all displayed seamlessly on your chart. Why B4S BidLine CandleTimer? Unleash the potential of your trading strategy with the B4S BidLine CandleTimer. Here's why this indicator stands out: Real-Time Bid Line: Witness market movements like nev
Infinity Liquidity AI - Premium MT5 Liquidity & Smart Money  If you are interested in using a professional liquidity-based MT5 indicator at the lowest possible price, this is the best time to purchase. Once the early slots are gone, the price will not stay the same. Free Bonus Indicator Included After purchase, message us from your profile and you will receive 1 premium indicator completely free with Infinity Liquidity AI. This bonus is included for buyers who contact us after purchase. You wil
Overview Heiken Ashi CE Filtered MT5 is a technical indicator for the MetaTrader 5 platform. It integrates smoothed candlestick charting with a dynamic exit strategy and a customizable trend filter to deliver clear buy and sell signals. The indicator is designed to improve trend detection and signal reliability by reducing market noise. If you want to see more high-quality products or order the development/conversion of your own products, visit my partners' website: 4xDev Get 10% OFF on manual
Cumulative Volume Delta (CVD) MA-X : Outil Intelligent de Sentiment du Flux d'Ordres Découvrez les mécanismes cachés du marché avec le Cumulative Volume Delta (CVD) MA-X . Alors que les indicateurs de volume standard vous indiquent seulement combien a été échangé, le CVD MA-X vous dit QUI gagne la bataille entre acheteurs et vendeurs et QUAND . En agrégeant l'action des prix au niveau du tick et la distribution du volume, cet indicateur fournit une carte cristalline de la conviction et de l'épu
Binary Rise Fall
Israr Hussain Shah
Here   our more valuable tools SMC Trend Trading   ,  Easy SMC Trading  ,  Institutional SMC Architect Volume Analysis Tools  ,  Volume flow Profile  ,  Market volume profile  , FVG with Volume  , Liquidity Heatmap Profile  ,  Volume Spread Analysis The Fractals_Price indicator is a technical analysis tool that identifies fractal patterns on price charts. Fractals are recurring patterns that signal potential trend reversals or continuation points. This indicator marks both upward and downward
Les acheteurs de ce produit ont également acheté
Neuro Poseidon MT5
Daria Rezueva
4.97 (34)
Neuro Poseidon is a new indicator by Daria Rezueva. It combines precise trading signals with adaptive TP/SL levels - creating best possible trades as a result! Message me and get  Neuro Poseidon Assistant  as a gift to automize your trading process! What makes it stand out? 1. Proven profitability on all assets and timeframes 2. Only confirmed BUY and SELL signals present on the chart 3. Adaptive TP & SL levels generated by the software for each trade 4. Easy to understand - suitable for al
SuperScalp Pro
Van Minh Nguyen
4.65 (26)
SuperScalp Pro – Système avancé d’indicateur de scalping multi-filtres SuperScalp Pro est un indicateur de scalping avancé qui combine le Supertrend classique avec plusieurs filtres de confirmation intelligents afin d’identifier les opportunités de trading. Il fonctionne efficacement sur plusieurs unités de temps, de M1 à H4, avec des performances optimisées sur XAUUSD, BTCUSD et les principales paires Forex. L’indicateur fournit des signaux d’achat et de vente clairs, ainsi que des niveaux d’en
Commençons par être honnêtes. Aucun indicateur ne vous rendra rentable à lui seul. Si quelqu’un vous dit le contraire, il vous vend un rêve. Tout indicateur qui affiche des flèches parfaites d’achat/vente peut être rendu impeccable — il suffit de zoomer sur la bonne partie de l’historique et de capturer uniquement les trades gagnants. Nous ne faisons pas cela.  SMC Intraday Formula est un outil. Il lit la structure du marché pour vous, identifie les zones de prix à la probabilité la plus élevée
Divergence Bomber
Ihor Otkydach
4.9 (90)
Chaque acheteur de cet indicateur reçoit également gratuitement : L’outil exclusif « Bomber Utility », qui accompagne automatiquement chaque opération de trading, fixe les niveaux de Stop Loss et de Take Profit, et clôture les positions selon les règles de la stratégie Des fichiers de configuration (set files) pour adapter l’indicateur à différents actifs Des set files pour configurer le Bomber Utility selon différents modes : « Risque Minimum », « Risque Équilibré » et « Stratégie d’Attente » U
Entry In The Zone and SMC Multi Timeframe is a real-time 2-in-1 market analysis tool that combines market structure analysis and a No Repaint BUY / SELL signal system into a single indicator, built on Smart Money Concepts (SMC) — a widely adopted framework used by professional traders to understand market structure. This indicator helps you see the market more clearly, make decisions based on structure rather than guesswork, and focus on high-probability zones where price is more likely to react
Quantum TrendPulse
Bogdan Ion Puscasu
5 (25)
Présentation de   Quantum TrendPulse   , l'outil de trading ultime qui combine la puissance de   SuperTrend   ,   RSI   et   Stochastic   dans un seul indicateur complet pour maximiser votre potentiel de trading. Conçu pour les traders qui recherchent précision et efficacité, cet indicateur vous aide à identifier les tendances du marché, les changements de dynamique et les points d'entrée et de sortie optimaux en toute confiance. Caractéristiques principales : Intégration SuperTrend :   suivez f
Ce produit a été mis à jour pour le marché 2026 et optimisé pour les dernières versions de MT5. AVIS DE MISE À JOUR DU PRIX : Smart Trend Trading System est actuellement disponible à $99 . Le prix passera à $199 après les 30 prochains achats . OFFRE SPÉCIALE : Après avoir acheté Smart Trend Trading System, envoyez-moi un message privé pour recevoir Smart Universal EA GRATUITEMENT et transformer vos signaux Smart Trend en trades automatisés. Smart Trend Trading System est un système de trading c
M1 Quantum MT5
Hamed Dehgani
5 (1)
M1 Quantum est un système de trading professionnel pour M1 qui fournit des signaux rapides et précis avec Stop Loss, Take Profit et une gestion intelligente du capital intégrés. M1 Quantum contient un système professionnel de gestion du capital conçu pour faire croître le compte rapidement en se concentrant sur les gains consécutifs . Fonctionnalités principales de l' indicateur M1 Quantum Conçu pour l' unité de temps M1 et toutes les paires majeures Toutes les transactions ont un Stop Loss et u
SignalTech is an unique fully rule based trading system delivers an Institutional approach for both Independent Traders and Prop Firm Challengers. Never Repaint. Push Notification available. No over-optimization. All the winning trades with chart setups are published on the comments page. 2026-05 4107 Pips (Until 05-29 NY Closed) 2026-04 2243 Pips 2026-03 2165 Pips 2026-02 2937 Pips 2026-01 2624 Pips 2025-12 1174 Pips It can generate signals with Buy/Sell Arrows, Push Notification (To Mobile) an
Trend Catcher ind mt5
Ramil Minniakhmetov
5 (5)
INDICATEUR DE DÉTECTEUR DE TENDANCE L'indicateur de détecteur de tendance analyse les mouvements de prix du marché grâce à une combinaison d'indicateurs d'analyse de tendance adaptatifs, propriétaires et personnalisés. Il identifie la véritable direction du marché en filtrant les fluctuations à court terme et en se concentrant sur la force de la dynamique sous-jacente, l'expansion de la volatilité et la structure des prix. Il utilise également une combinaison d'indicateurs personnalisés de lis
PrimeScalping
Temirlan Kdyrkhan
PrimeScalping is a powerful trading companion designed to generate high-probability entry signals with dynamic TP/SL/DP levels based on volatility. Built-in performance tracking shows win/loss stats, PP1/PP2 hits, and success rates — all updated live. Key Features: Buy/Sell signals with adaptive volatility bands Real-time TP/SL/DP levels based on ATR Built-in MA Filter with optional ATR/StdDev volatility Performance stats panel (Success, Profit/Loss, PP1/PP2) Alerts via popup, sound, push, or e
Power Candles MT5
Daniel Stein
5 (8)
Power Candles V3 - Indicateur de force à optimisation automatique Power Candles V3 transforme la force des devises et des instruments en un plan de trading exploitable sur chaque graphique auquel il est associé. Au lieu de se contenter de colorer les bougies, il effectue une optimisation automatique en temps réel en arrière-plan et vous fournit les meilleurs niveaux de Stop Loss, Take Profit et seuils de signal pour le symbole que vous avez sous les yeux. Un simple clic suffit pour l'adopter en
FX Trend MT5 NG
Daniel Stein
5 (6)
FX Trend NG : La Nouvelle Génération d’Intelligence de Tendance Multi-Marchés Vue d’ensemble FX Trend NG est un outil professionnel d’analyse de tendance multi-timeframe et de surveillance des marchés. Il vous permet de comprendre la structure complète du marché en quelques secondes. Au lieu de naviguer entre de nombreux graphiques, vous identifiez immédiatement quels instruments sont en tendance, où le momentum s’affaiblit et où plusieurs unités de temps sont alignées. Offre de Lancement – Ob
L'indicateur UZFX {SSS} Scalping Smart Signals MT5 est un indicateur de trading haute performance sans redessin, conçu pour les scalpers, les day traders et les swing traders qui recherchent des signaux précis et en temps réel sur des marchés très volatils. Développé par (UZFX-LABS), cet indicateur combine l'analyse de l'action des prix, la confirmation de tendance et un filtrage intelligent pour générer des signaux d'achat et de vente à forte probabilité sur toutes les paires de devises et tous
Meridian Pro
Ottaviano De Cicco
5 (2)
Meridian Pro 2.00: Professional Multi-Timeframe Trend Matrix for MT5 Meridian Pro 2.00 is a professional adaptive trend matrix for MetaTrader 5. It combines the original Meridian trend engine, a clean chart ribbon, closed-bar signal arrows, an 8-timeframe dashboard, Fuel momentum, weighted consensus, synthetic HTF processing and chart-native higher-timeframe context lines. The goal is simple: read current trend, multi-timeframe structure, strength, momentum and EA-ready state from one discipline
Gann Made Easy   est un système de trading Forex professionnel et facile à utiliser qui est basé sur les meilleurs principes de trading en utilisant la théorie de mr. WD Gann. L'indicateur fournit des signaux d'ACHAT et de VENTE précis, y compris les niveaux Stop Loss et Take Profit. Vous pouvez échanger même en déplacement en utilisant les notifications PUSH. VEUILLEZ ME CONTACTER APRÈS L'ACHAT POUR RECEVOIR GRATUITEMENT DES INSTRUCTIONS DE TRADING ET D'EXCELLENTS INDICATEURS SUPPLÉMENTAIRES! V
FX Power MT5 NG
Daniel Stein
5 (32)
FX Power : Analysez la force des devises pour des décisions de trading plus intelligentes Aperçu FX Power est l'outil essentiel pour comprendre la force réelle des principales devises et de l'or, quelles que soient les conditions du marché. En identifiant les devises fortes à acheter et les faibles à vendre, FX Power simplifie vos décisions de trading et révèle des opportunités à forte probabilité. Que vous suiviez les tendances ou anticipiez les retournements à l'aide de valeurs extrêmes de D
SmartScalping
Temirlan Kdyrkhan
SmartScalping is a powerful trading companion designed to generate high-probability entry signals with dynamic TP/SL/DP levels based on volatility. Built-in performance tracking shows win/loss stats, PP1/PP2 hits, and success rates — all updated live. Key Features: Buy/Sell signals with adaptive volatility bands Real-time TP/SL/DP levels based on ATR Built-in MA Filter with optional ATR/StdDev volatility Performance stats panel (Success, Profit/Loss, PP1/PP2) Alerts via popup, sound, push, or e
ARIPoint
Temirlan Kdyrkhan
1 (1)
ARIPoint is a powerful trading companion designed to generate high-probability entry signals with dynamic TP/SL/DP levels based on volatility. Built-in performance tracking shows win/loss stats, PP1/PP2 hits, and success rates all updated live. Key Features: Buy/Sell signals with adaptive volatility bands Real-time TP/SL/DP levels based on ATR Built-in MA Filter with optional ATR/StdDev volatility Performance stats panel (Success, Profit/Loss, PP1/PP2) Alerts via popup, sound, push, or email Cu
TrendProMaster
Temirlan Kdyrkhan
MasterTrend Indicator for MT5 A powerful trend-following and signal-evaluation tool MasterTrend   is a custom MT5 indicator that combines Moving Averages and ATR-based risk/reward logic to generate clear buy/sell signals. It visualizes dynamic SL/TP levels, evaluates past trade outcomes, and displays win/loss statistics in a clean on-chart panel. Key features include: Buy/Sell signals based on MA crossovers ATR-based SL/TP1/TP2/TP3 levels with visual lines and labels Signal outcome tracking wit
Crystal Heikin Ashi Signals
Muhammad Jawad Shabir
5 (2)
Crystal Heikin Ashi Signals - Professional Trend & Signal Detection Indicator Advanced Heikin Ashi Visualization with Intelligent Signal System for Manual & Automated Trading Final Price: $149 ---------> Price goes up $10 after every 10 sales . Limited slots available — act fast . Overview Crystal Heikin Ashi Signals is a professional-grade MetaTrader 5 indicator that combines pure Heikin Ashi candle visualization with an advanced momentum-shift detection system. Designed for both manual traders
Atomic Analyst MT5
Issam Kassas
4.26 (35)
Ce produit a été mis à jour pour le marché 2026 et optimisé pour les dernières versions de MT5. AVIS DE MISE À JOUR DU PRIX : Atomic Analyst est actuellement disponible à $99 . Le prix passera à $199 après les 30 prochains achats . OFFRE SPÉCIALE : Après avoir acheté Atomic Analyst, envoyez-moi un message privé pour recevoir Smart Universal EA GRATUITEMENT et transformer vos signaux Atomic Analyst en trades automatisés. Atomic Analyst est un indicateur de trading Price Action sans repaint, san
Azimuth Pro
Ottaviano De Cicco
5 (7)
Azimuth Pro V2: Synthetic Fractal Structure and Confirmed Entries for MT5 Overview Azimuth Pro is a multi-level swing structure indicator by Merkava Labs . Four nested swing layers, swing-anchored VWAP, ABC pattern detection, three-timeframe structural filtering, and closed-bar confirmed entries — one chart, one workflow from micro-swings to macro-cycles. This is not a blind signal product. It is a structure-first workflow for traders who care about location, context, and timing. V2 Launch Offe
ScalpPoint
Temirlan Kdyrkhan
ScalpPoint is a powerful trading companion designed to generate high-probability entry signals with dynamic TP/SL/DP levels based on volatility. Built-in performance tracking shows win/loss stats, PP1/PP2 hits, and success rates — all updated live. Key Features: Buy/Sell signals with adaptive volatility bands Real-time TP/SL/DP levels based on ATR Built-in MA Filter with optional ATR/StdDev volatility Performance stats panel (Success, Profit/Loss, PP1/PP2) Alerts via popup, sound, push, or emai
Reversion King Indicator
Eugen-alexandru Zibileanu
5 (4)
Un nouveau Roi en ville - Indicateur + Gestion des ordres (TP1 + TP2 + TP3) + Envoi optionnel de signaux Telegram INCLUS (GRATUIT) (SYSTÈME COMPLET DE TRADING et DE SIGNAUX) Notre meilleur EA pour l’Or : Gold Slayer Cet indicateur inclut une stratégie avancée, un système de trading avec gestion des ordres personnalisable ainsi qu’un système de retour à la moyenne combinant des extensions d’enveloppes, soutenu par plusieurs filtres intelligents de confirmation comme le RSI afin de détecter des en
Market Structure Order Block Dashboard MT5 est un indicateur MT5 conçu pour les traders qui veulent lire la structure de marché et les principales zones de réaction du prix directement sur le graphique. Il combine BOS, ChoCH, Order Blocks, Fair Value Gaps (FVG), Liquidité, Kill Zones, Volume Profile, et un dashboard compact pour une analyse rapide. Cet indicateur s'adresse aux traders qui utilisent la structure de marché, les concepts ICT et Smart Money comme cadre de décision. Il peut aider à r
Quant Direction MT5
Georgios Kalomoiropoulos
Quant Direction est un outil d'analyse de marché 3D. Il fournit une analyse de marché parfaitement objective, basée sur un algorithme, en calculant des écarts précis en pourcentage sur différents paramètres. Développé à l'aide d'outils de modélisation avancés basés sur l'IA et soumis à des tests rigoureux, cet algorithme analyse le marché avec une précision inégalée. Vous pouvez analyser n'importe quelle paire de devises ou instrument financier sur la plateforme. Que vous pratiquiez le trading à
Meravith MT5
Ivan Stefanov
5 (1)
Outil des market makers. Meravith va : Analyser toutes les unités de temps et afficher la tendance actuellement en vigueur. Mettre en évidence les zones de liquidité (équilibre des volumes) où le volume haussier et baissier est égal. Afficher tous les niveaux de liquidité provenant de différentes unités de temps directement sur votre graphique. Générer et présenter une analyse de marché sous forme de texte pour votre référence. Calculer les objectifs, les niveaux de support et les points de stop
Ce produit a été mis à jour pour le marché 2026 et optimisé pour les dernières versions de MT5. AVIS DE MISE À JOUR DU PRIX : MENA Trend Scanner Pro est actuellement disponible à $99 . Le prix passera à $199 après les 30 prochains achats . OFFRE SPÉCIALE : Après avoir acheté MENA Trend Scanner Pro, envoyez-moi un message privé pour recevoir Smart Universal EA GRATUITEMENT et transformer vos signaux MENA Trend en trades automatisés. Tout d’abord, il est important de souligner que ce système de t
MasterTrend
Temirlan Kdyrkhan
MasterTrend Indicator for MT5 A powerful trend-following and signal-evaluation tool MasterTrend   is a custom MT5 indicator that combines Moving Averages and ATR-based risk/reward logic to generate clear buy/sell signals. It visualizes dynamic SL/TP levels, evaluates past trade outcomes, and displays win/loss statistics in a clean on-chart panel. Key features include: Buy/Sell signals based on MA crossovers ATR-based SL/TP1/TP2/TP3 levels with visual lines and labels Signal outcome tracking wit
Plus de l'auteur
Supply and Demand Zones Indicator for MT5 Professional institutional-grade Supply and Demand zone detection with intelligent alerts WHAT IS IT? Supply and Demand Zones is a powerful MT5 indicator that automatically identifies high-probability institutional supply and demand zones on any chart. this professional indicator brings advanced zone detection to MetaTrader 5 with enhanced features. Unlike traditional support and resistance levels, this indicator detects actual institutional footprint
Strat Assistant
Alejandro Miguel Basso
Strat Assistant is a comprehensive price action analysis tool designed for traders who rely on candlestick patterns and multi-timeframe confluence. **WHAT IT DOES:** - Automatically detects three powerful price action patterns:   * **Inside Bars**: Consolidation patterns indicating potential breakouts   * **External Bars**: Engulfing patterns showing strong directional moves   * **Failed 2 Patterns (CRT)**: Counter-trend reversal setups based on liquidity grabs - Displays real-time higher time
Mikula Square of Nine — XAUUSD Intraday  v1.0 The most complete implementation of the Gann/Mikula Square of Nine for Gold intraday trading on MetaTrader 5. The Formula > **Level(ring, angle) = ( √DailyOpen + ring + angle/360 )²** Prices move in square root spirals. When price reaches a specific angular position of that spiral — especially the cardinal angles (0, 90, 180, 270) — it tends to pause, reverse, or accelerate. Why this implementation is different **Ring 0 always included**
## What is an Inversion Fair Value Gap? A **Fair Value Gap (FVG)** is a three-candle imbalance where price moves so fast that a price range is left untested. When price later returns and **closes through** that zone rather than respecting it, the imbalance *inverts* — what was support becomes resistance, or vice versa. This flipped zone is called an **Inversion Fair Value Gap (IFVG)**. IFVGs are a core concept in modern Smart Money and ICT-derived analysis. They represent points where institu
Filtrer:
Aucun avis
Répondre à l'avis