FX Volume MT5
- Indicateurs
- Daniel Stein
- Version: 4.94
- Mise à jour: 7 octobre 2025
- Activations: 10
FX Volume : Découvrez le Sentiment du Marché tel que perçu par un Courtier
Présentation Rapide
Vous souhaitez faire passer votre approche de trading au niveau supérieur ? FX Volume vous fournit, en temps réel, des informations sur la manière dont les traders particuliers et les courtiers sont positionnés—bien avant la publication de rapports retardés comme le COT. Que vous visiez des gains réguliers ou recherchiez simplement un avantage plus solide sur les marchés, FX Volume vous aide à repérer d’importants déséquilibres, confirmer des ruptures et affiner votre gestion des risques. Commencez dès maintenant et voyez comment des données de volume authentiques peuvent révolutionner votre prise de décision !
1. Pourquoi FX Volume est particulièrement bénéfique pour les traders
Signaux d’alerte précoces d’une précision inégalée
• Recevez presque instantanément des informations sur le nombre de traders achetant ou vendant chaque paire de devises—bien avant la plupart des gens.
• FX Volume est le seul outil qui rassemble de vraies données de volume issues de plusieurs courtiers de détail et les présente sous une forme claire et conviviale.Gestion des risques efficace
• Repérez des déséquilibres marqués (positions longues ou courtes) qui annoncent souvent des retournements de tendance, vous permettant de placer vos stops et objectifs avec davantage de confiance.
• Des données authentiques et exclusives vous assurent de disposer d’informations fiables pour chaque décision de trading.Optimisez vos points d’entrée et de sortie
• Identifiez les « trades surchargés » où la majorité se trouve d’un même côté, et confirmez les ruptures à l’aide de volumes réels.
• Évitez les signaux trompeurs typiques des indicateurs standard, en vous fiant à un flux réel et en temps réel.S’intègre à toute stratégie
• Associez FX Volume en toute simplicité à vos lignes de tendance, supports/résistances ou indicateurs. Les données de volume réel vous offrent une couche de confirmation unique que vous ne trouverez nulle part ailleurs.
2. En savoir plus avec Stein Investments
Chez Stein Investments, nous proposons :
• Des Expert Advisors et des Indicateurs pour divers marchés.
• Des tutoriels, des vidéos et des guides pour accélérer votre apprentissage.
• Une communauté de soutien avec des chats de trading exclusifs.
Visitez notre page Stein Investments pour découvrir des stratégies, des mises à jour et des ressources—afin de tirer le meilleur parti de FX Volume et d’élever votre trading.
3. Comment débuter avec FX Volume
Ajoutez l’URL requise
• Dans votre terminal MetaTrader, rendez-vous dans Outils > Options > Expert Advisors et ajoutez :
https://stein.investments
Cela permet à FX Volume d’extraire des données de marché authentiques depuis notre centre de données spécialisé.Installez SI Connect
• Ouvrez un graphique séparé (n’importe quel symbole/période).
• Ajoutez-y SI Connect—il téléchargera automatiquement toutes les données dont FX Volume a besoin.Ajoutez FX Volume à votre graphique principal
• Faites glisser et déposez FX Volume sur le graphique où vous souhaitez voir les informations de volume en temps réel.
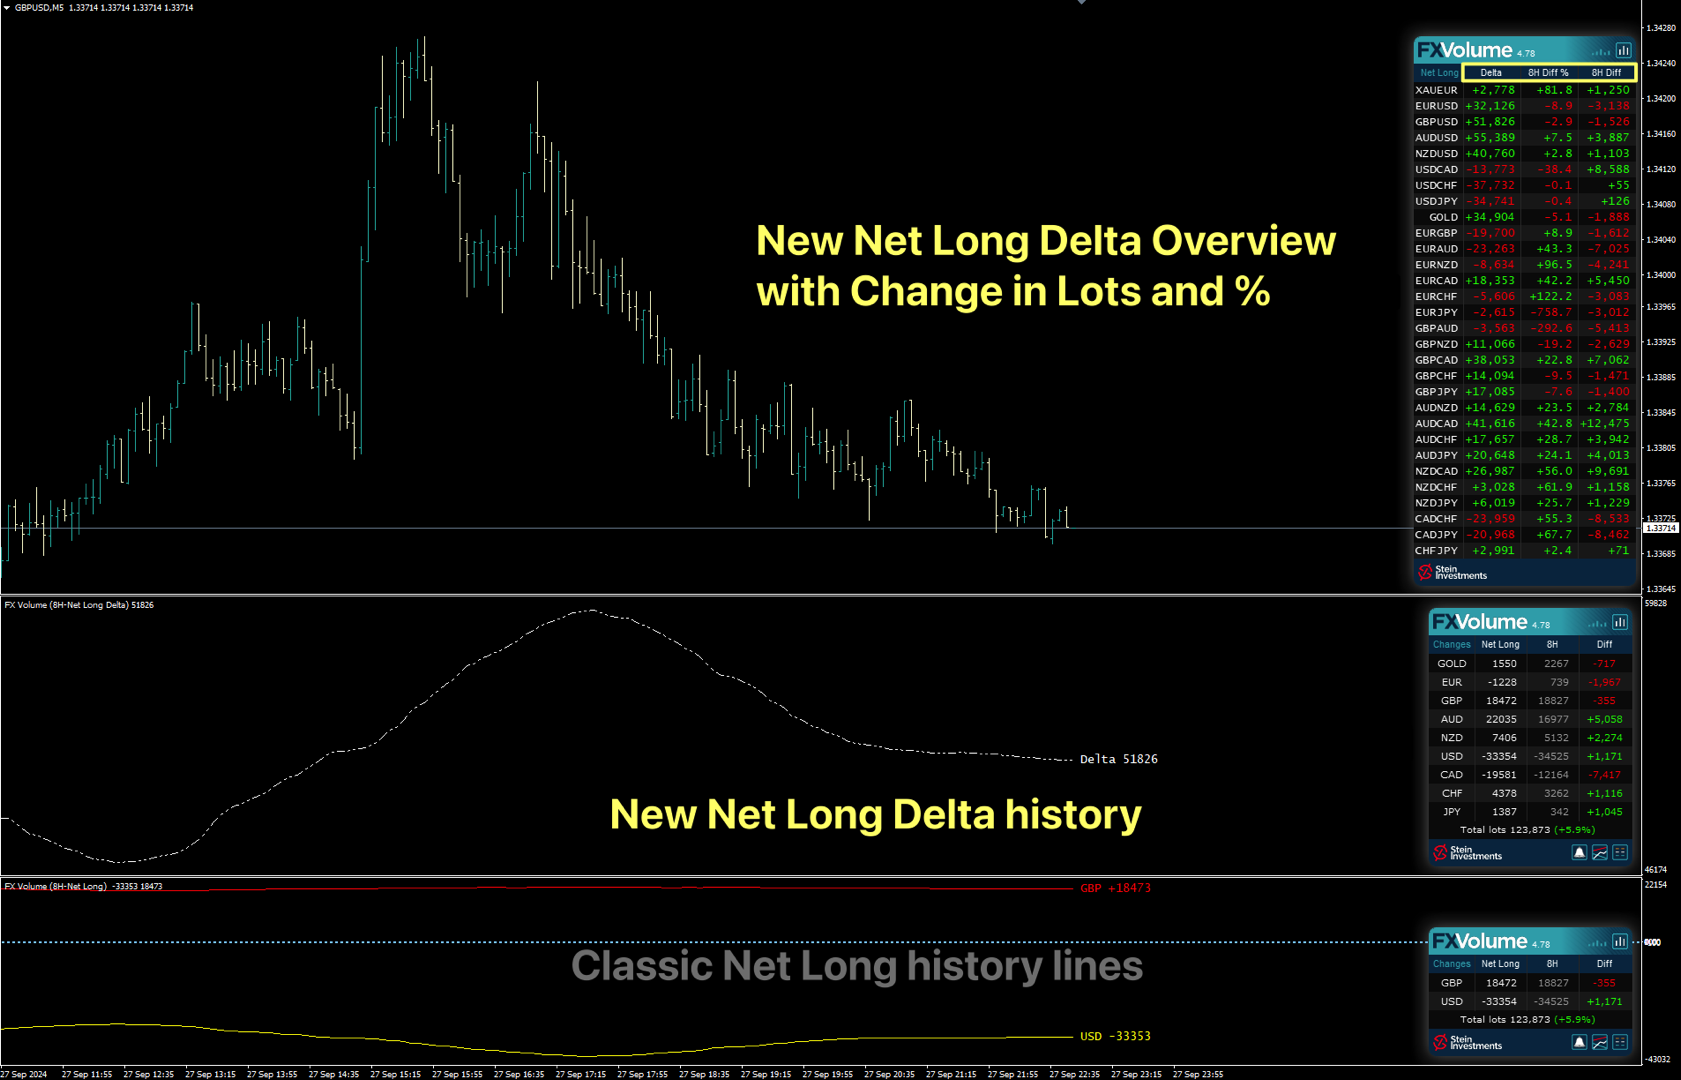
• Vous verrez des indicateurs tels que les ratios long/short, le volume total et les positions nettes—tout cela fondé sur des données exclusives de plusieurs courtiers.
4. Comment fonctionne FX Volume (explication simple)
Chaque transaction a deux facettes
• Si vous achetez, un courtier ou une institution vend—créant ainsi la position réelle de l’autre côté sur le marché.Collecte des données
• Nous réunissons des données de volume réelles et anonymisées auprès des traders particuliers et courtiers de détail, sans informations personnelles—uniquement les chiffres authentiques de volume.
• FX Volume fusionne ces informations pour vous offrir un flux de données fiable, vous indiquant clairement la répartition des participants sur le marché.Agrégation & analyse
• Notre centre de données traite en continu tout ce qu’il faut pour FX Volume.
• SI Connect télécharge ensuite ces fichiers prêts à l’emploi et les met à jour, sans aucune étape supplémentaire de votre part.Perspective Contraire (Contrarian)
• Si 80 % des traders particuliers sont en position longue, les grandes institutions sont souvent à la vente. FX Volume met en évidence ces déséquilibres, vous donnant ainsi une clarté qui vous permet de prendre des décisions plus fortes.
5. Utilisations Pratiques de FX Volume
Identifier les trades surchargés
• Si la majorité se concentre en long ou en short, un retournement de marché pourrait être imminent.
• Notre flux de données exclusif vous permet de repérer ces changements à l’avance et d’agir en conséquence.Confirmer les ruptures
• Une rupture accompagnée d’une hausse du volume d’achat/vente indique généralement un mouvement de prix solide.
• Fiez-vous à de véritables volumes au niveau mondial pour valider les breakouts avec davantage de crédibilité.Optimiser le placement des stop-loss
• Les pics de volume marquent souvent les zones où les gros acteurs influencent le prix. Placer vos stops avec ces informations peut limiter la volatilité inattendue.Combiner avec le Price Action
• Associez des zones clés de support/résistance ou des modèles de chandeliers aux données en temps réel de FX Volume pour obtenir une double confirmation de vos configurations.
6. Paramètres de l’Indicateur FX Volume
Personnalisez FX Volume afin de l’adapter à votre style et à votre approche :
Broker DST Zone & GMT Shift
• Assurez-vous que vos réglages horaires correspondent à la zone du courtier, pour conserver la cohérence des données de volume.Back Comparison In (Hours ou Minutes)
• Choisissez si vous voulez comparer les données actuelles à un intervalle mesuré en heures ou en minutes.Compare with X Units Back
• Indiquez jusqu’où vous remontez (en heures/minutes) pour repérer des hausses ou baisses soudaines du volume.Display All History Lines
• True : Affiche les lignes historiques de toutes les devises concernées.
• False : Uniquement celles liées au symbole actuel.History Values
• Sélectionnez les données de volume que vous souhaitez visualiser : Net Long, Long Volume, Short Volume, Total Volume, etc.Multi-Instance Settings
• Si vous exécutez plusieurs indicateurs FX Volume dans la même fenêtre, assignez-leur des IDs uniques pour éviter les conflits.Alert Settings
• Configurez des seuils de volume ou des alertes de pics pour être informé immédiatement des changements importants.Graphical Settings
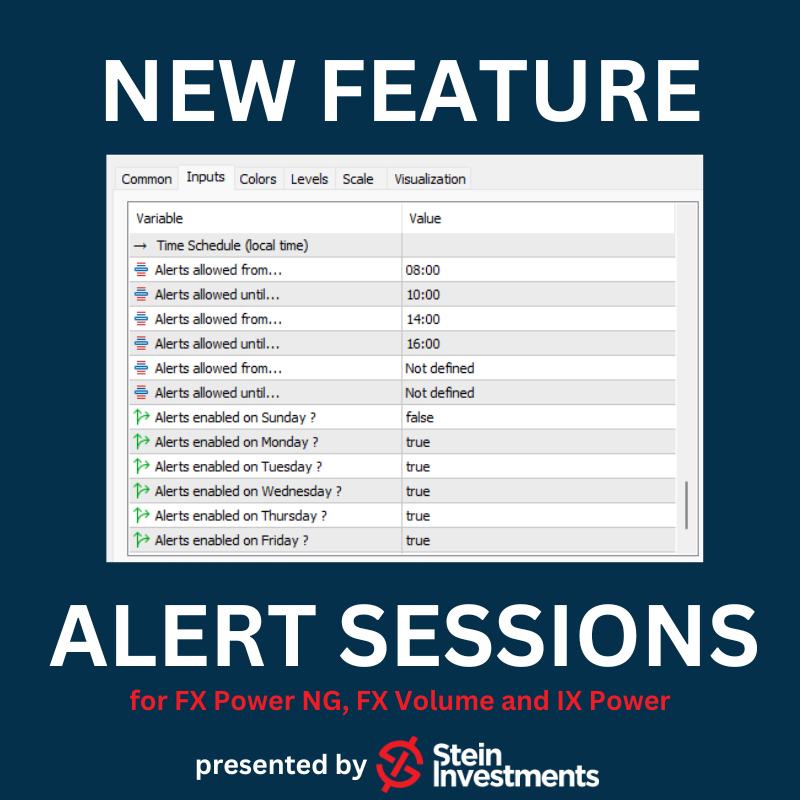
• Personnalisez les couleurs, l’épaisseur des lignes et la mise en page globale en fonction de vos préférences graphiques.Schedule
• Définissez quand FX Volume doit déclencher des alertes, idéal si vous ne tradez que sur certaines sessions.
7. Informations Supplémentaires & Aide
• FX Volume FAQ : Consultez notre page de FAQ FX Volume pour plus d’explications ou pour résoudre vos problèmes.
• Community Chat : Rejoignez notre groupe privé pour partager des stratégies, poser vos questions et échanger avec d’autres utilisateurs de FX Volume.
• Support : Besoin d’aide ou des questions ? Contactez-nous. Nous sommes là pour vous guider.
Prêt à transformer votre trading ?
• Accédez à des données exclusives : Nous collectons de véritables volumes auprès de plusieurs courtiers de détail, dévoilant ainsi la réalité du marché.
• Tradez avec plus de précision : Confirmez le sentiment, détectez les retournements et renforcez vos stratégies grâce à des informations de haute qualité en temps réel.
• Rejoignez la Communauté Stein Investments : Appuyez-vous sur nos outils, nos guides et notre réseau solidaire pour poursuivre vos objectifs de trading avec confiance.
N’attendez pas ! Installez FX Volume dès aujourd’hui et faites l’expérience de la puissance révolutionnaire des données de volume réel : gagnez un avantage décisif et élevez chaque trade.
Bon Trading !
Daniel & Alain


I purchased this indicator last week and tested it for a while across different prop firm challenges. All I can say is — this is a very powerful indicator. Once you understand the full strategy and how it operates, making profits is not difficult at all. The developer, Daniel Stein, is also extremely helpful. I encountered some issues at the beginning, and he quickly resolved them for me. I highly recommend Daniel’s indicators to anyone who wants to trade seriously and effectively.