ICT Silver Bullet Lux on MT5
- Indicateurs
-
Minh Truong Pham
 Hello, my name is Pham and I am a programmer and trader! At here, I create amazing forex indicators and expert advisors for Metatrader.
I will try:
+ Provide best tools base on my 5 years experience as a trader and 10 years as a programmer. - Version: 1.7
- Mise à jour: 23 avril 2024
- Activations: 5
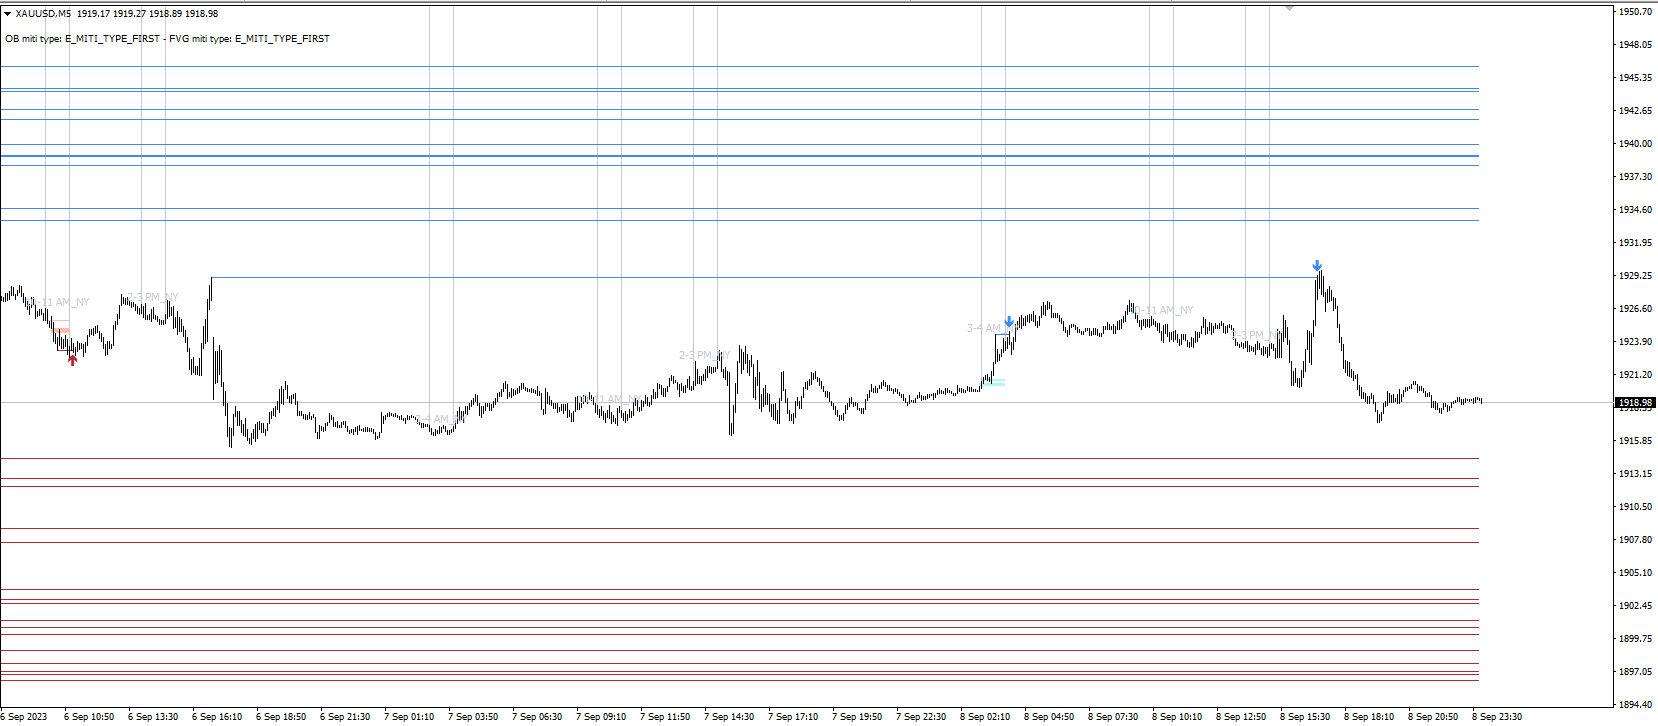
The ICT Silver Bullet indicator is inspired from the lectures of "The Inner Circle Trader" (ICT) and highlights the Silver Bullet (SB) window which is a specific 1-hour interval where a Fair Value Gap (FVG) pattern can be formed.
A detail document about ICT Silver Bullet here.
There are 3 different Silver Bullet windows (New York local time):
- The London Open Silver Bullet (3 AM — 4 AM ~ 03:00 — 04:00)
- The AM Session Silver Bullet (10 AM — 11 AM ~ 10:00 — 11:00)
- The PM Session Silver Bullet (2 PM — 3 PM ~ 14:00 — 15:00)
🔶 SETTINGS
(Check CONCEPTS for deeper insights and explanation)
🔹 Swing settings (left): Sets the length, which will set the lookback period/sensitivity of the Zigzag patterns (which directs the trend)
🔹 Silver Bullet Session; Show SB session: show lines and labels of SB session
Labels can be disabled separately in the 'Style' section, color is set at the 'Inputs' section.
🔹 FVG
– Mode
• All FVG
• Only FVG's in the same direction of trend
• Strict
• Super-Strict
– Colors
– Extend: extend till last bar of SB session
🔹 Targets – support/resistance lines
– Previous session (any): S/R lines fetched between current and previous SB session
– Previous session (similar): S/R lines fetched between current and previous similar SB session
– Colors
– Keep lines (only in strict mode)
🔹 Show
– MSS ~ Session: Show Market Structure Shift, only when this happens during a SB session
– Trend: Show trend (Zigzag, colored ~ trend)
🔶 CONCEPTS
This technique can visualize potential support/resistance lines, which can be used as targets.
The script contains 2 main components:
• forming of a Fair Value Gap (FVG)
• drawing support/resistance (S/R) lines
🔹 Forming of FVG
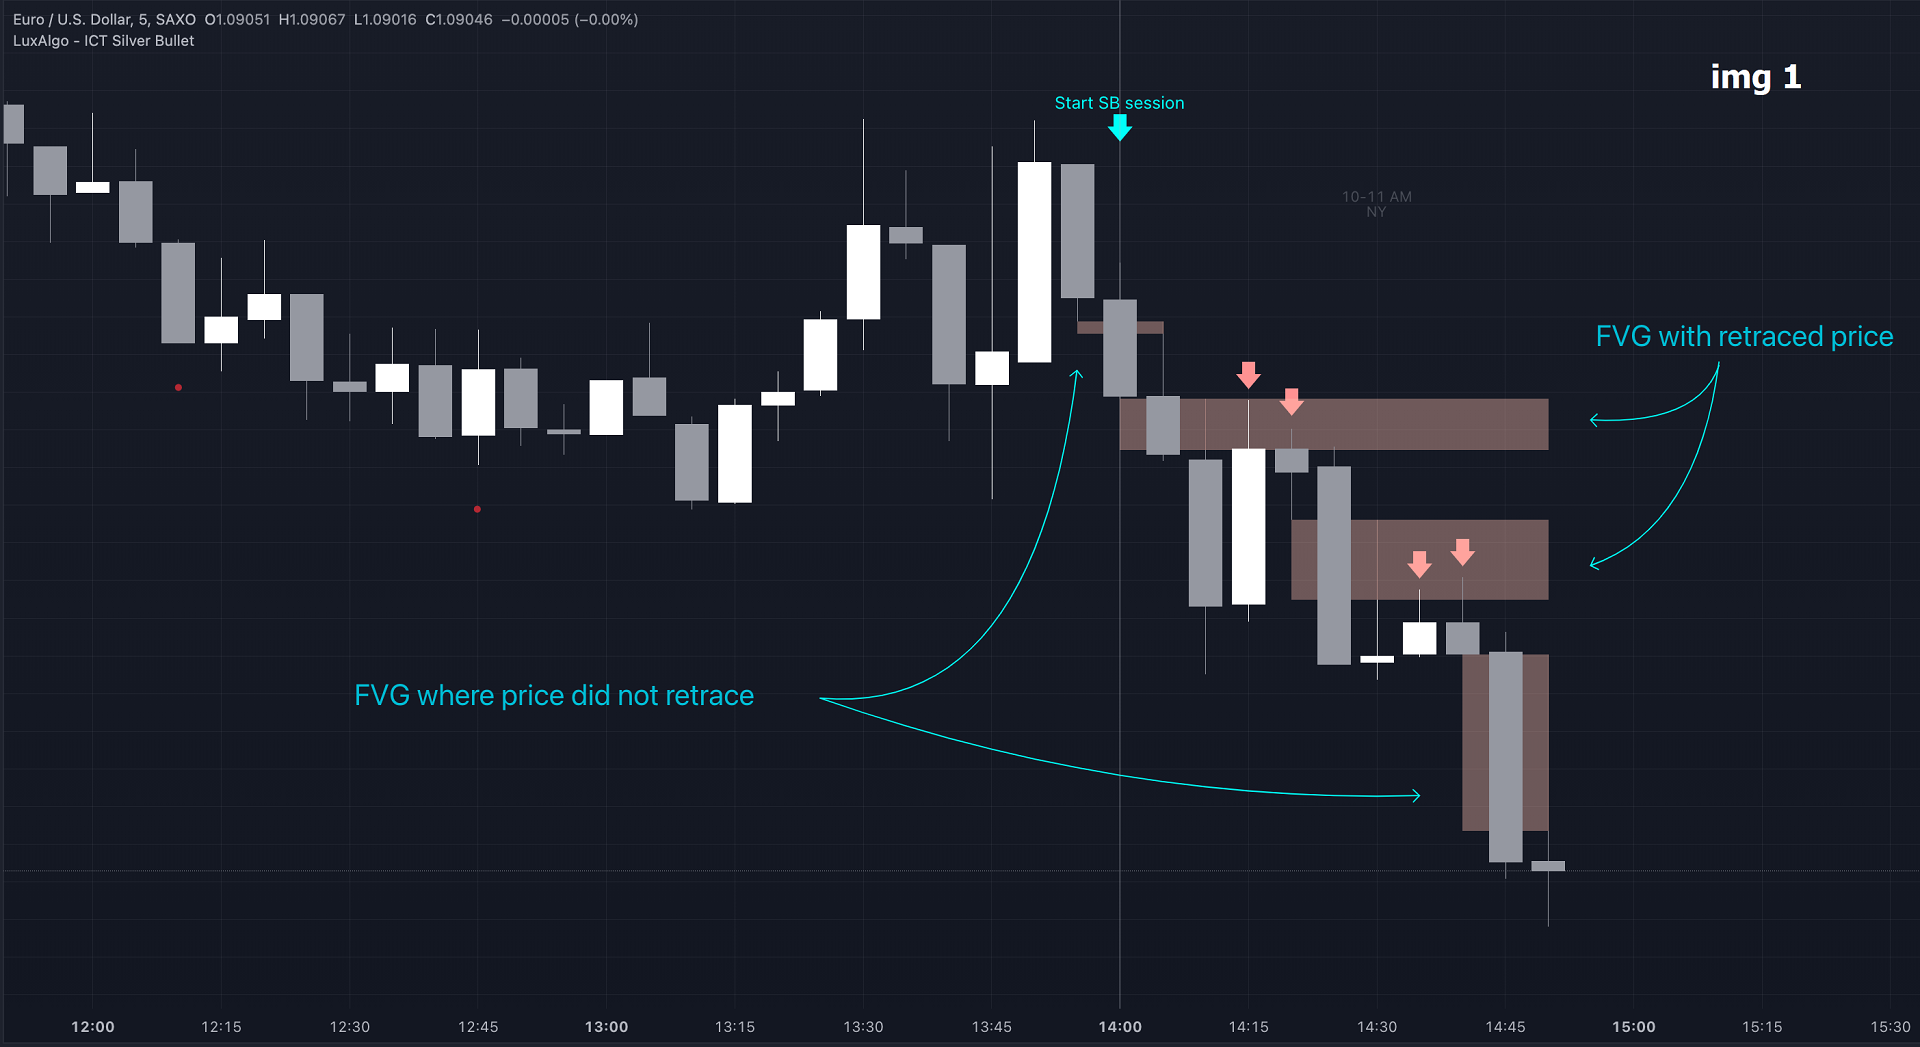
1 basic principle: when a FVG at the end of the SB session is not retraced, it will be made invisible. (image 2)
Dependable on the settings, different FVG's will be shown.
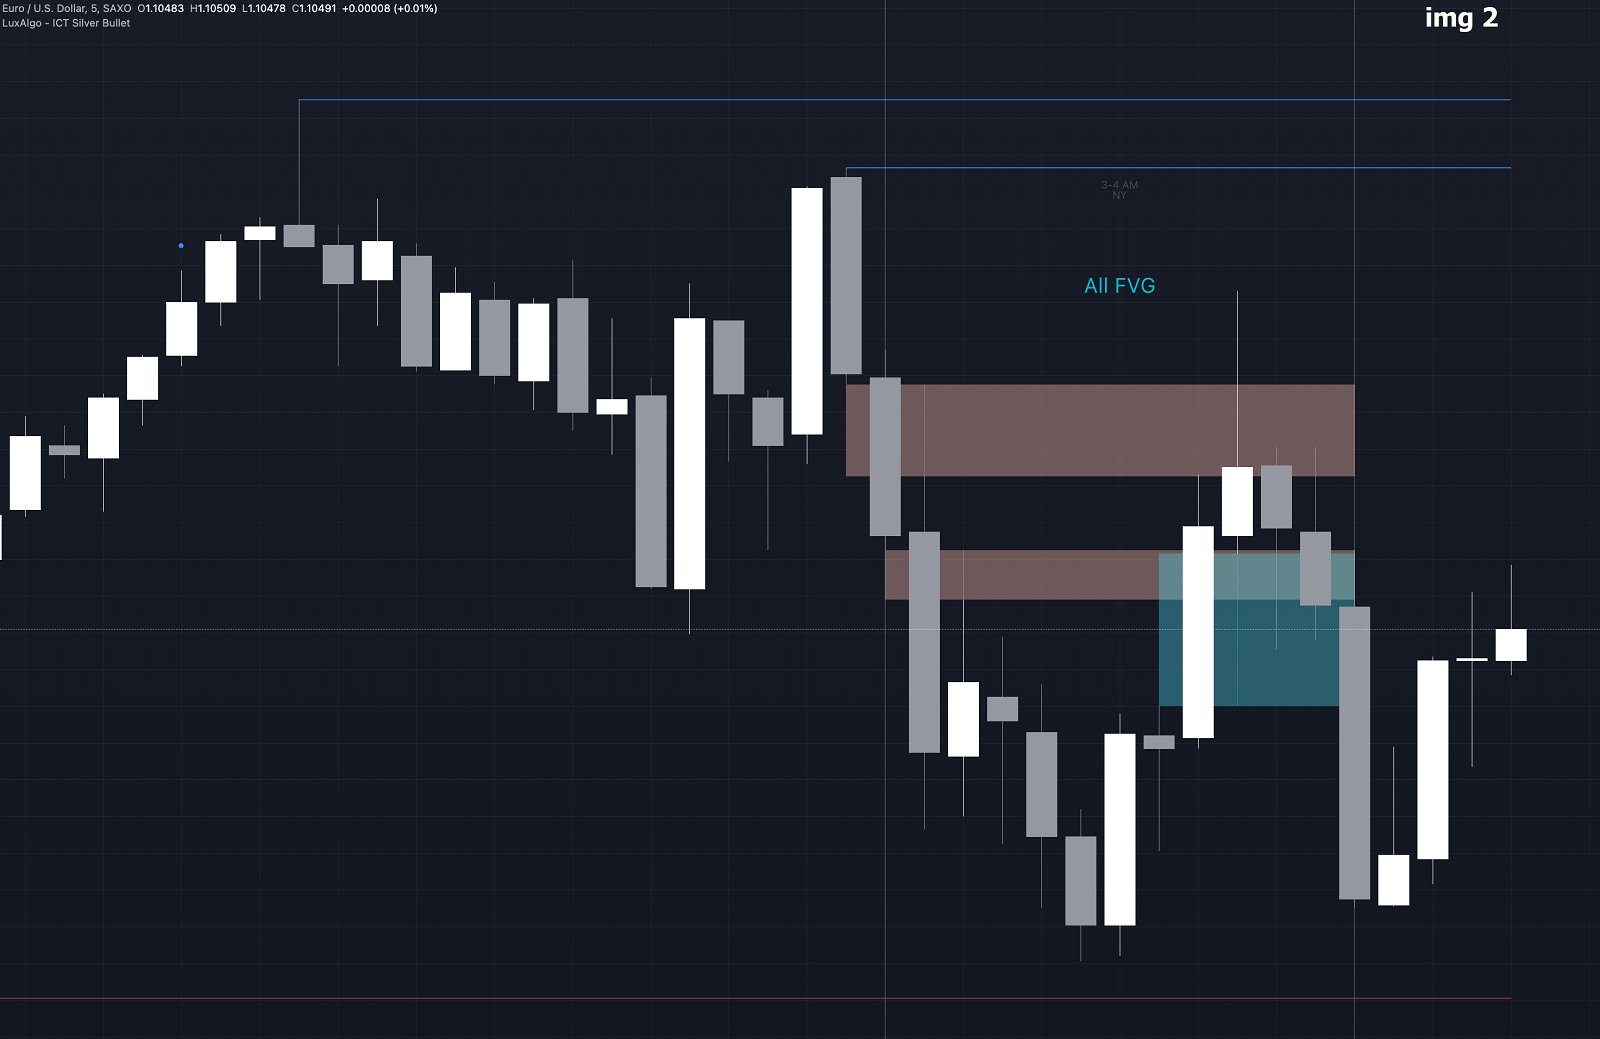
• 'All FVG': all FVG's are shown, regardless the trend (image 3)
• 'Only FVG's in the same direction of trend': Only FVG's are shown that are similar to the trend at that moment (trend can be visualized by enabling 'Show' -> 'Trend')
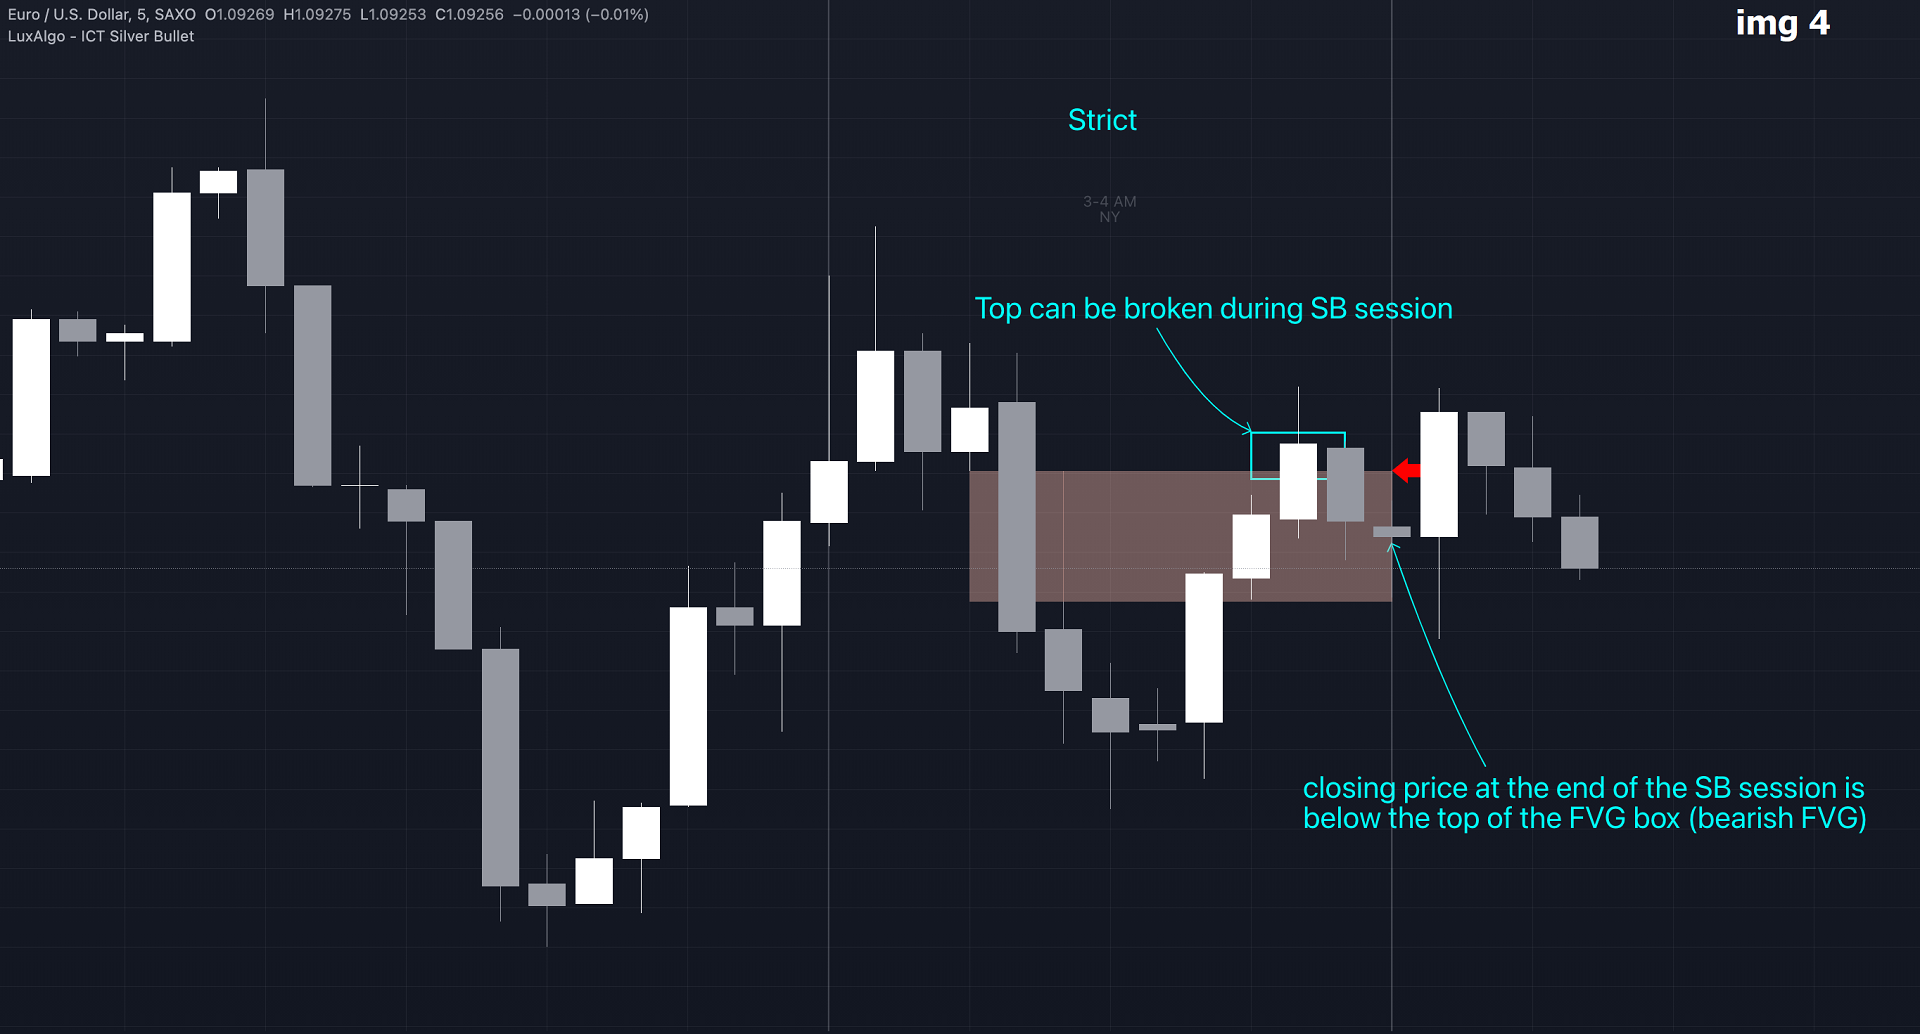
-> only bearish FVG when the trend is bearish vs. bullish FVG when trend is bullish (image 4)
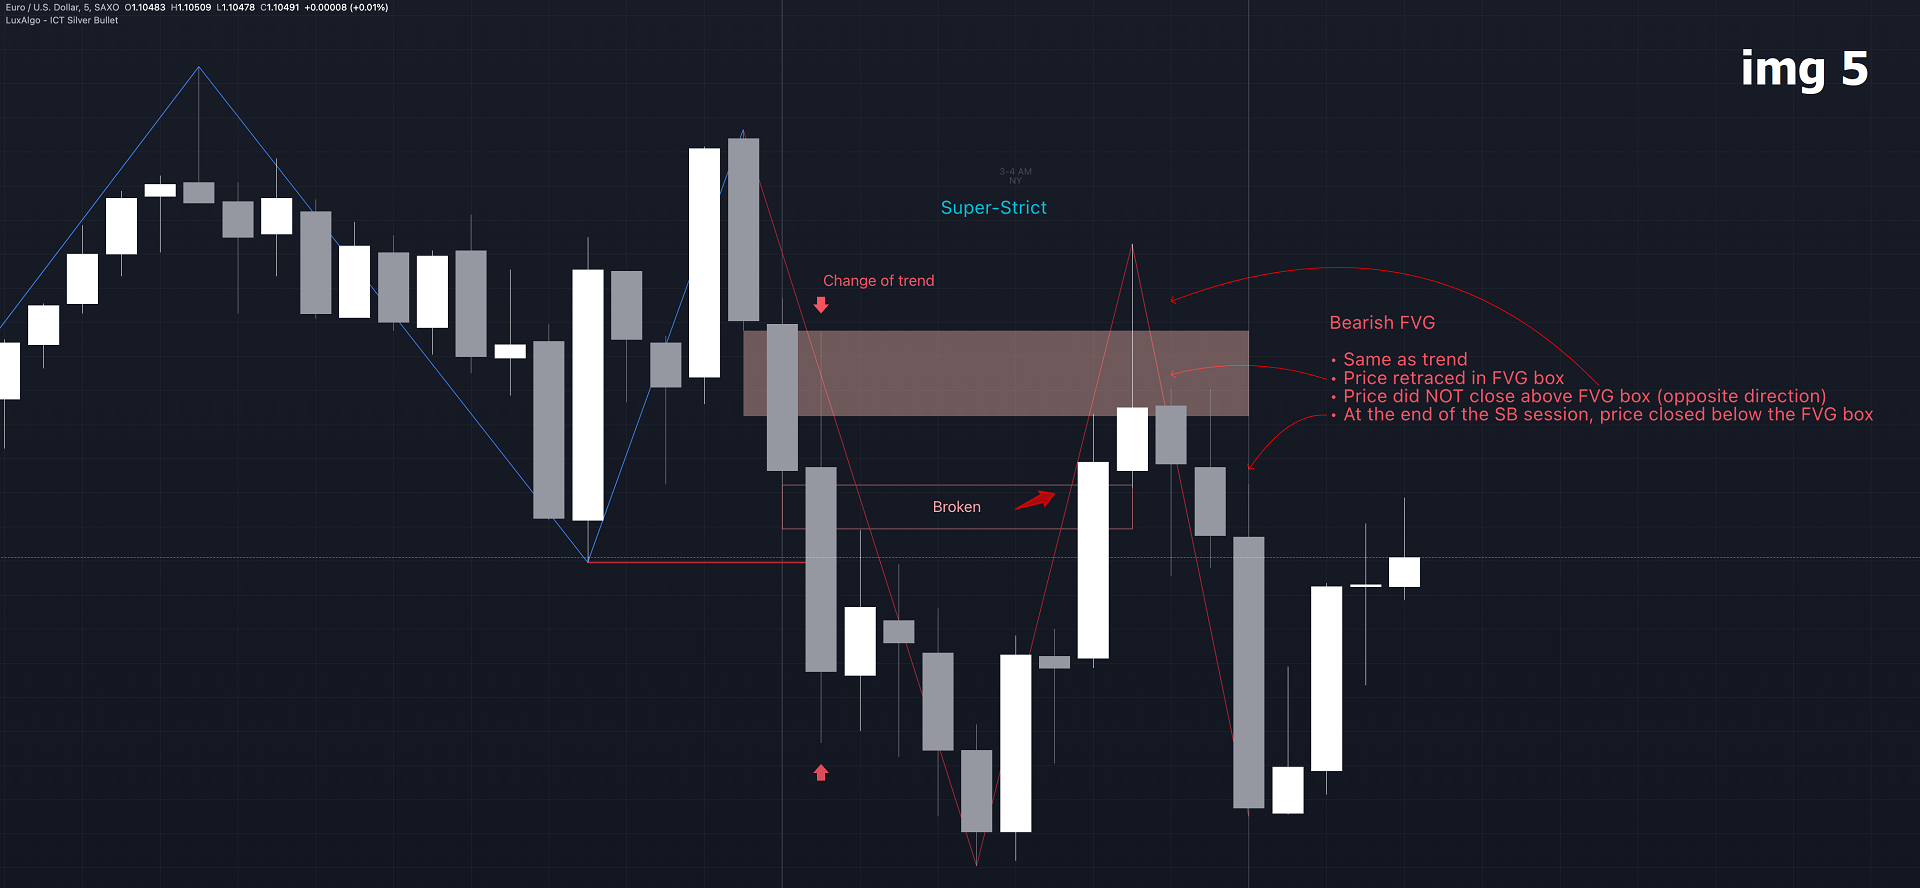
• 'strict': Besides being similar to the trend, only FVG's are shown when the closing price at the end of the SB session is (image 5):
– below the top of the FVG box (bearish FVG)
– above bottom of the FVG box (bullish FVG)
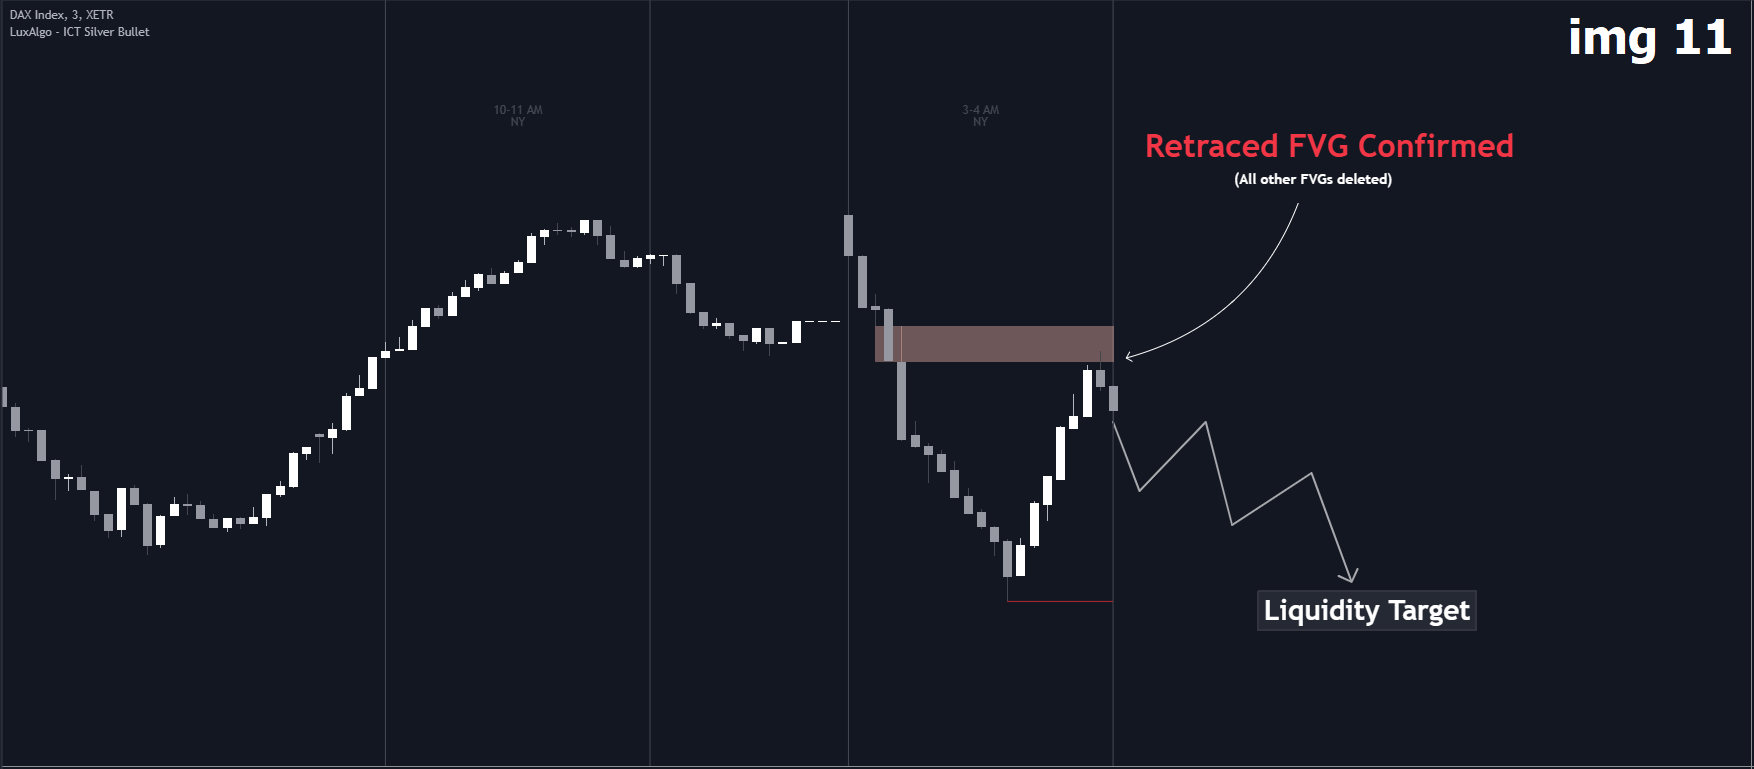
• 'super-strict': Besides being similar to the trend, only FVG's are shown when the FVG box is NOT broken in the opposite direction AND the closing price at the end of the SB session is (image 6):
– below bottom of the FVG box (bearish FVG)
– above the top of the FVG box (bullish FVG)
'Super-Strict' mode resembles ICT lectures the most.
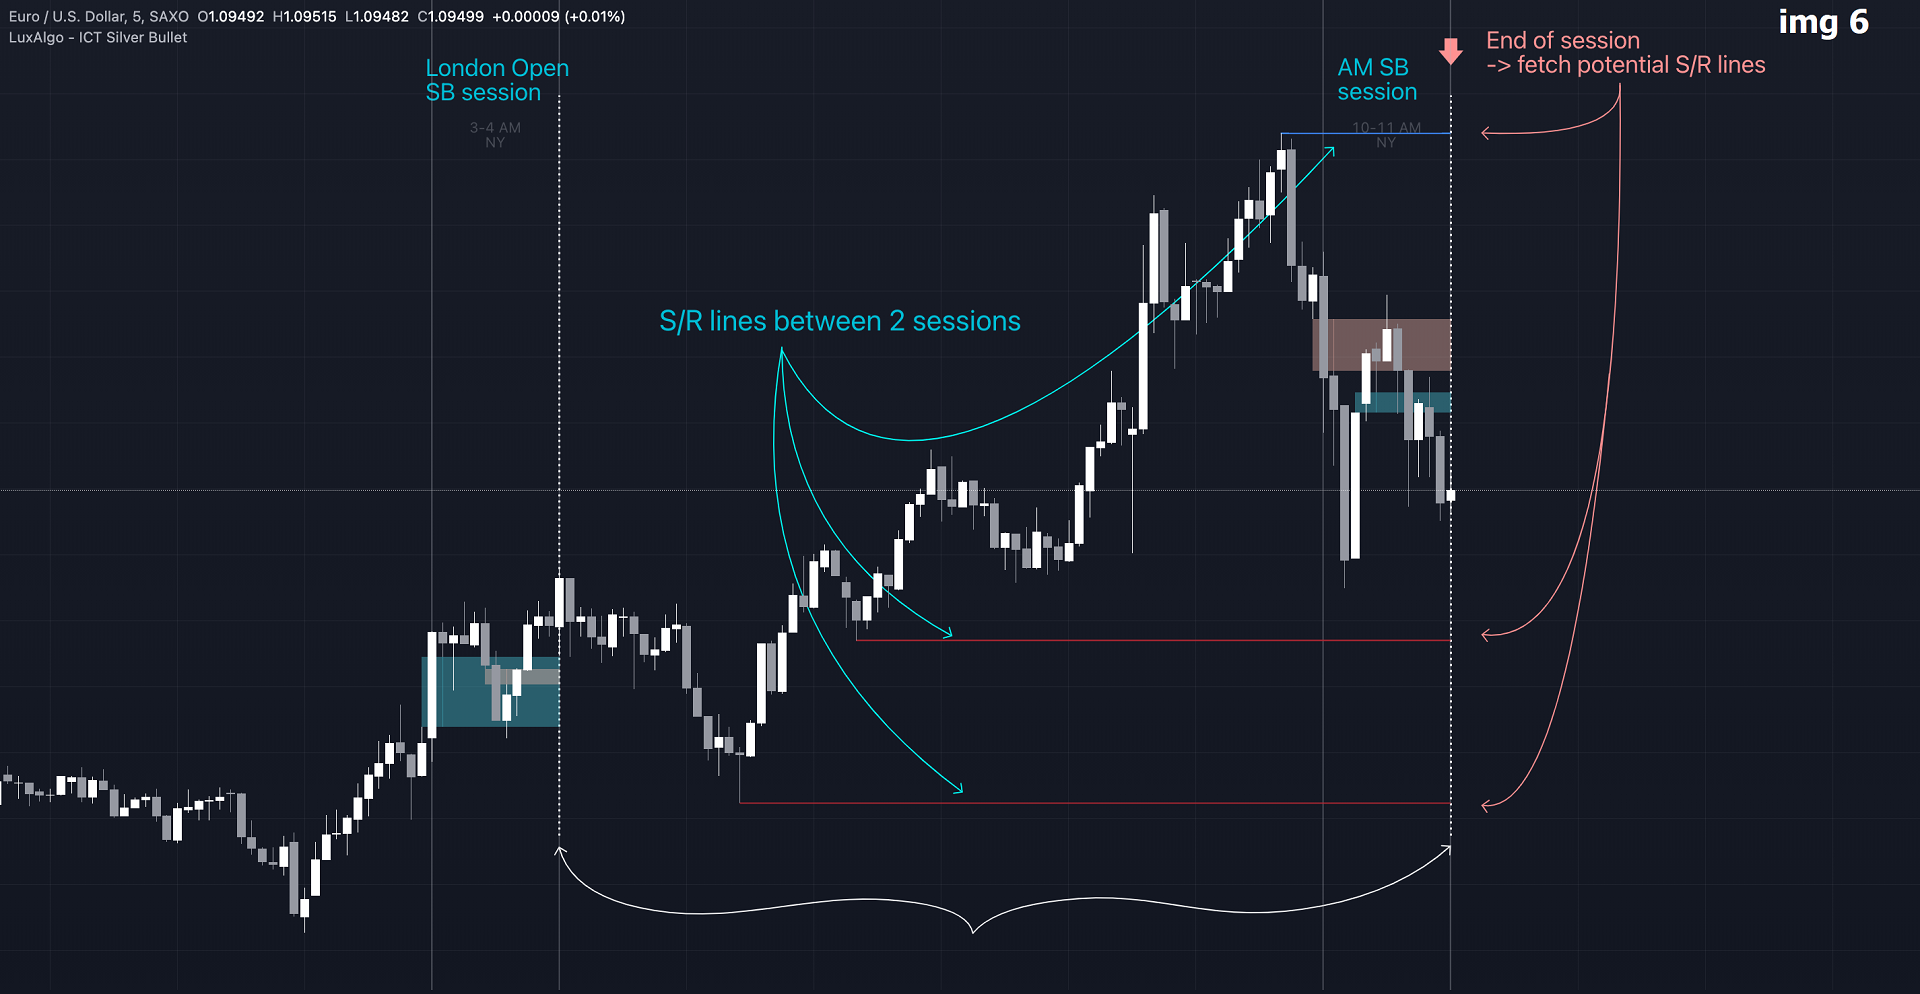
🔹 Drawing support/resistance lines
When the SB session has ended, the script draws potential support/resistance lines, again, dependable on the settings.
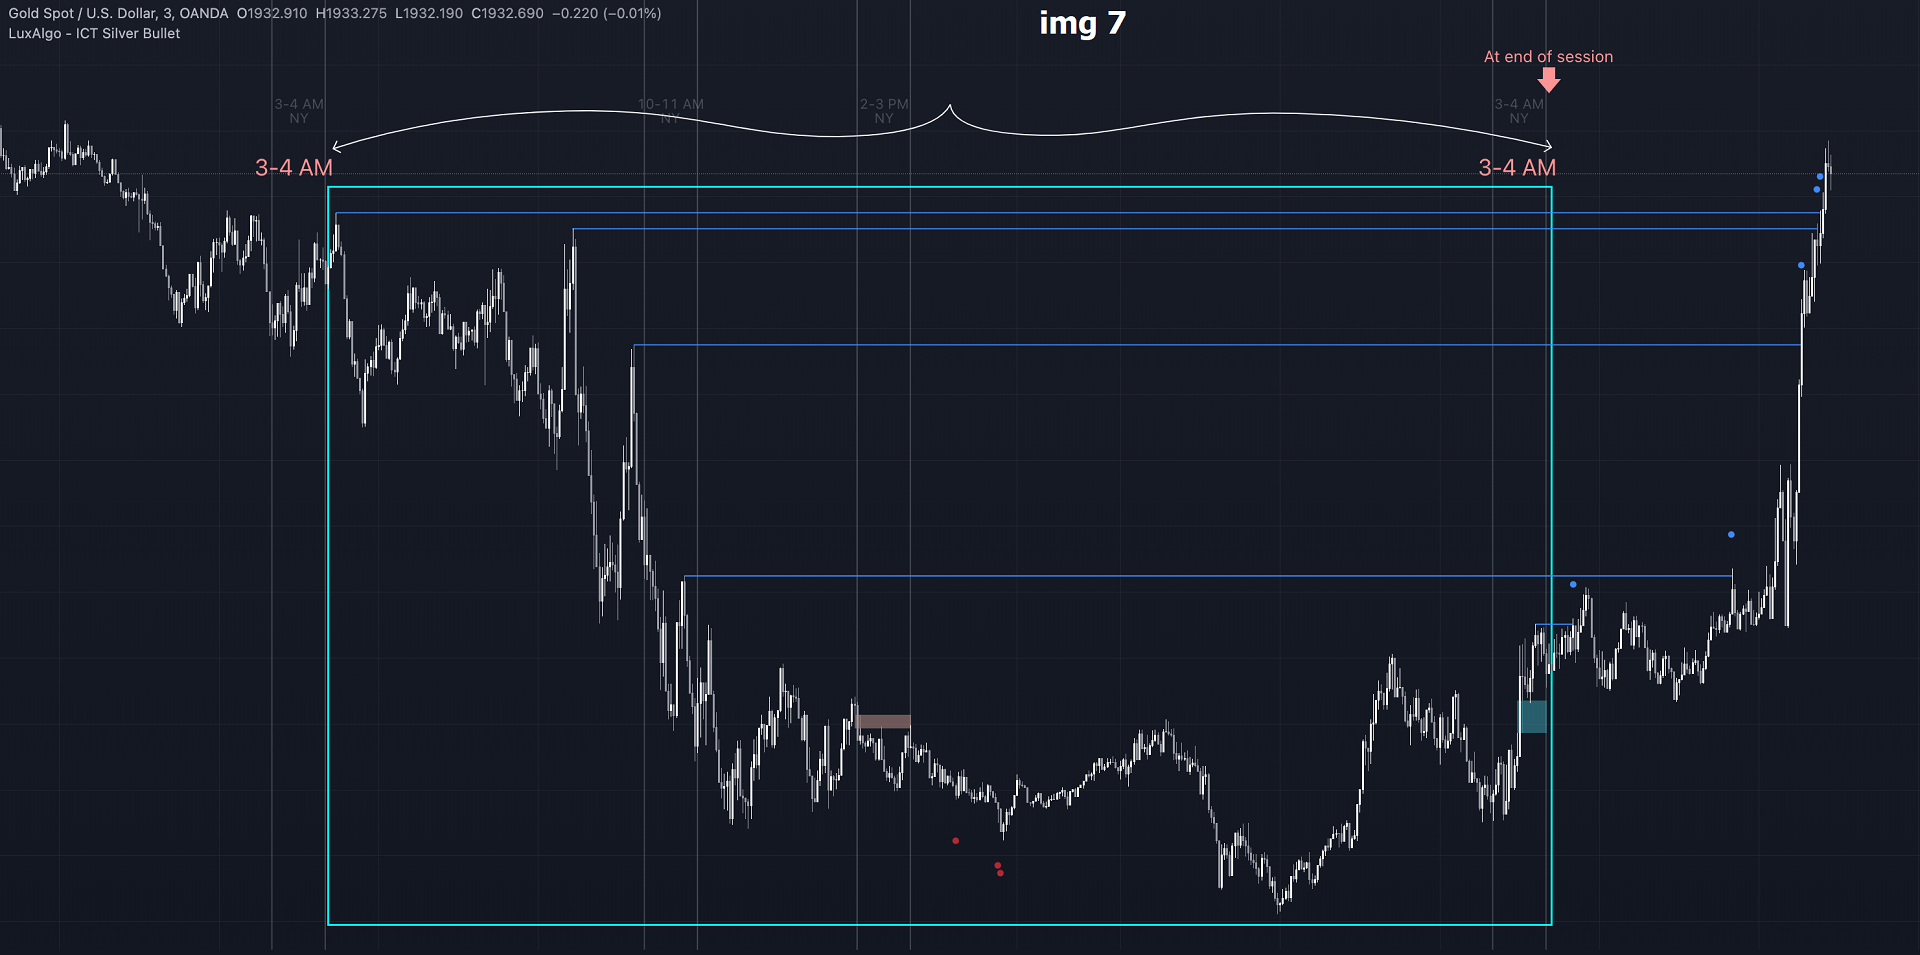
• Previous session (any): S/R lines are fetched between current and previous session. (image 7)
For example, when current session is 'AM SB Session (10 AM — 11 AM)', then previous session is
'London Open SB (3 AM — 4 AM)', S/R lines between these 2 sessions alone will be included.
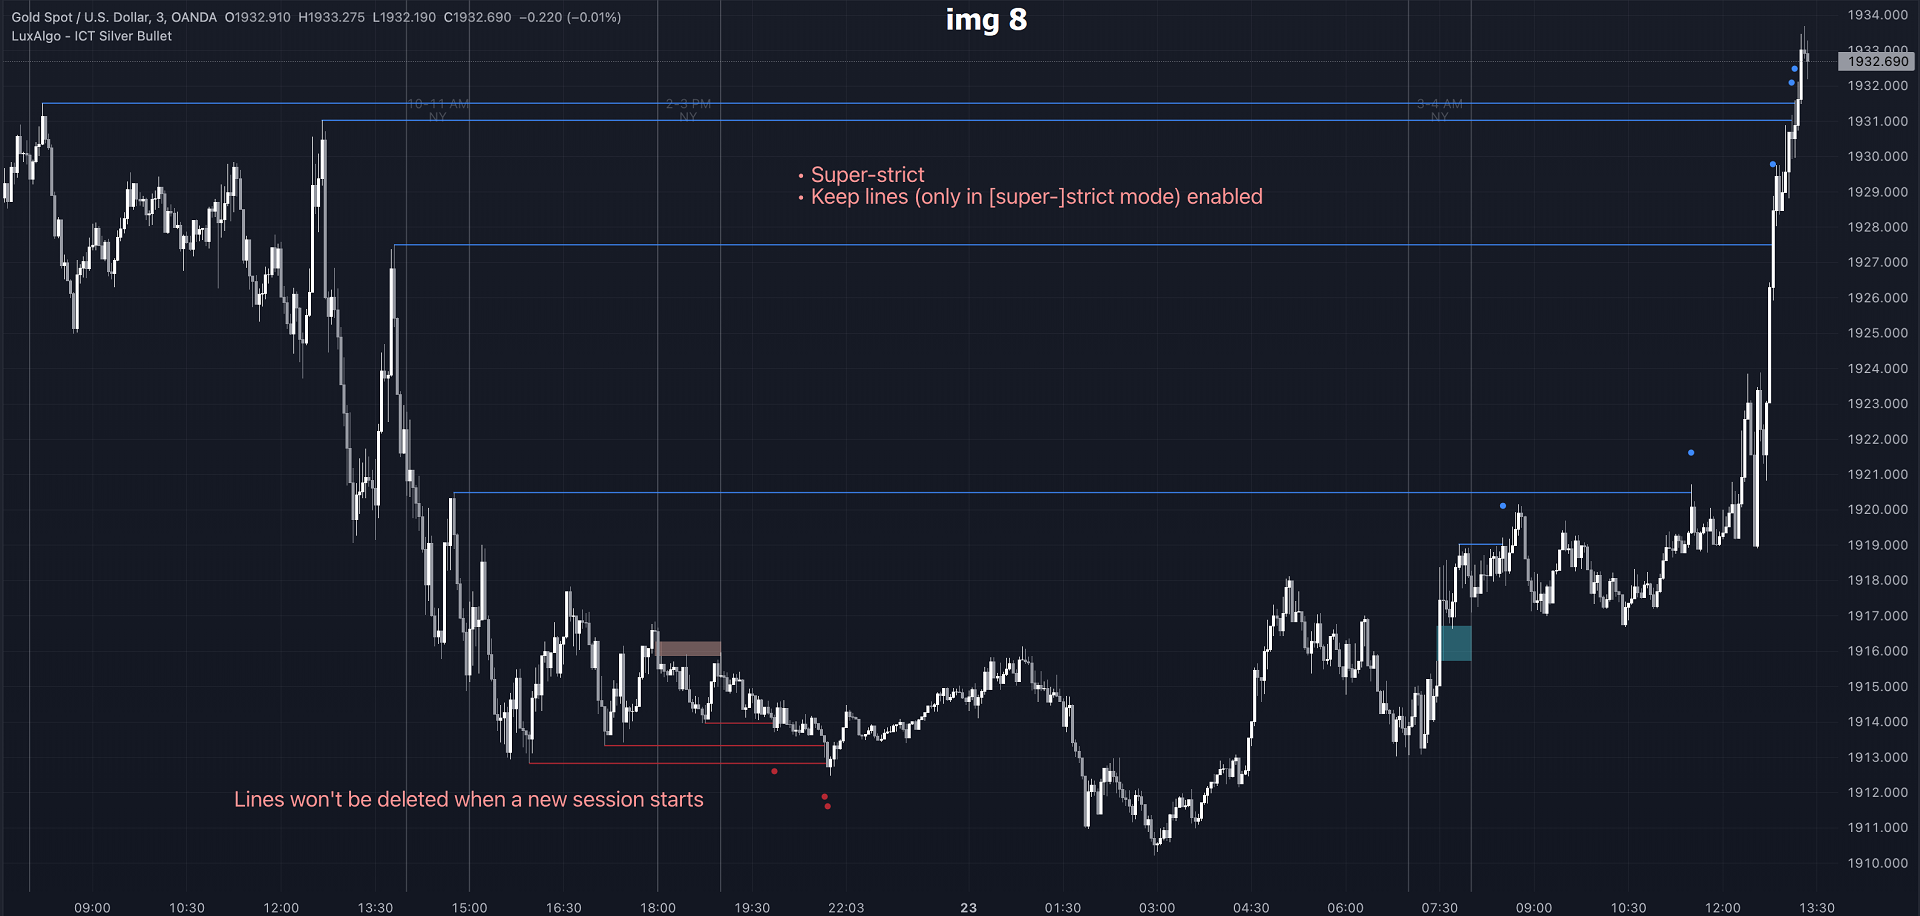
• Previous session (similar): S/R lines are fetched between current and previous - similar - session. (image 8)
For example, when current session is 'London Open SB (3 AM — 4 AM)', only S/R lines between
current session and previous 'London Open SB (3 AM — 4 AM)' session are included.
When a new session starts, S/R lines will be removed, except when enabling 'Keep lines (only in strict mode)' (image 9)
This is not possible in 'All FVG' or 'Only FVG's in the same direction of trend' mode, since the chart would be cluttered.
Note that in 'All FVG' or 'Only FVG's in the same direction of trend' mode, both, Support/Resistance lines will be shown,
while in Strict/Super-Strict mode:
• only Support lines will be shown if a bearish FVG appears
• only Resistance lines if a bullish FVG is shown
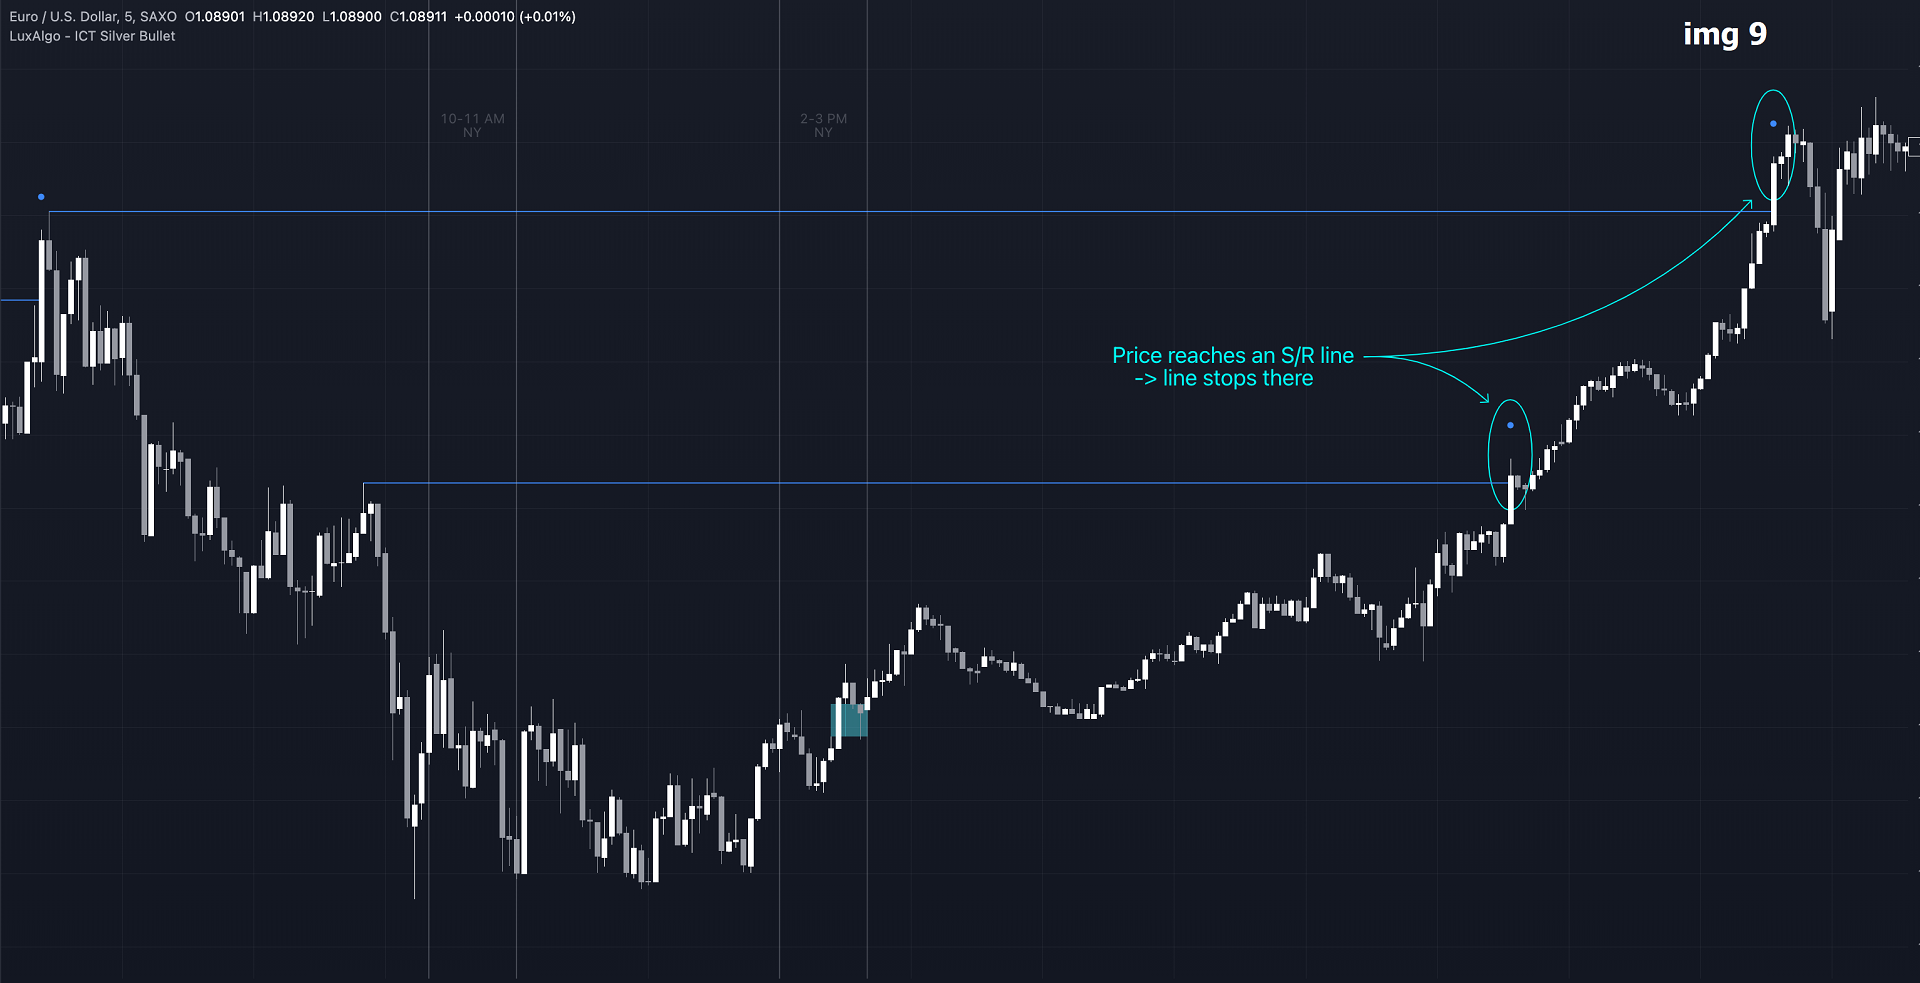
The lines will still be drawn the the end of the SB session, when a valid FVG appears,
but the S/R lines will remain visible and keep being updated until price reaches that line. (image 10)
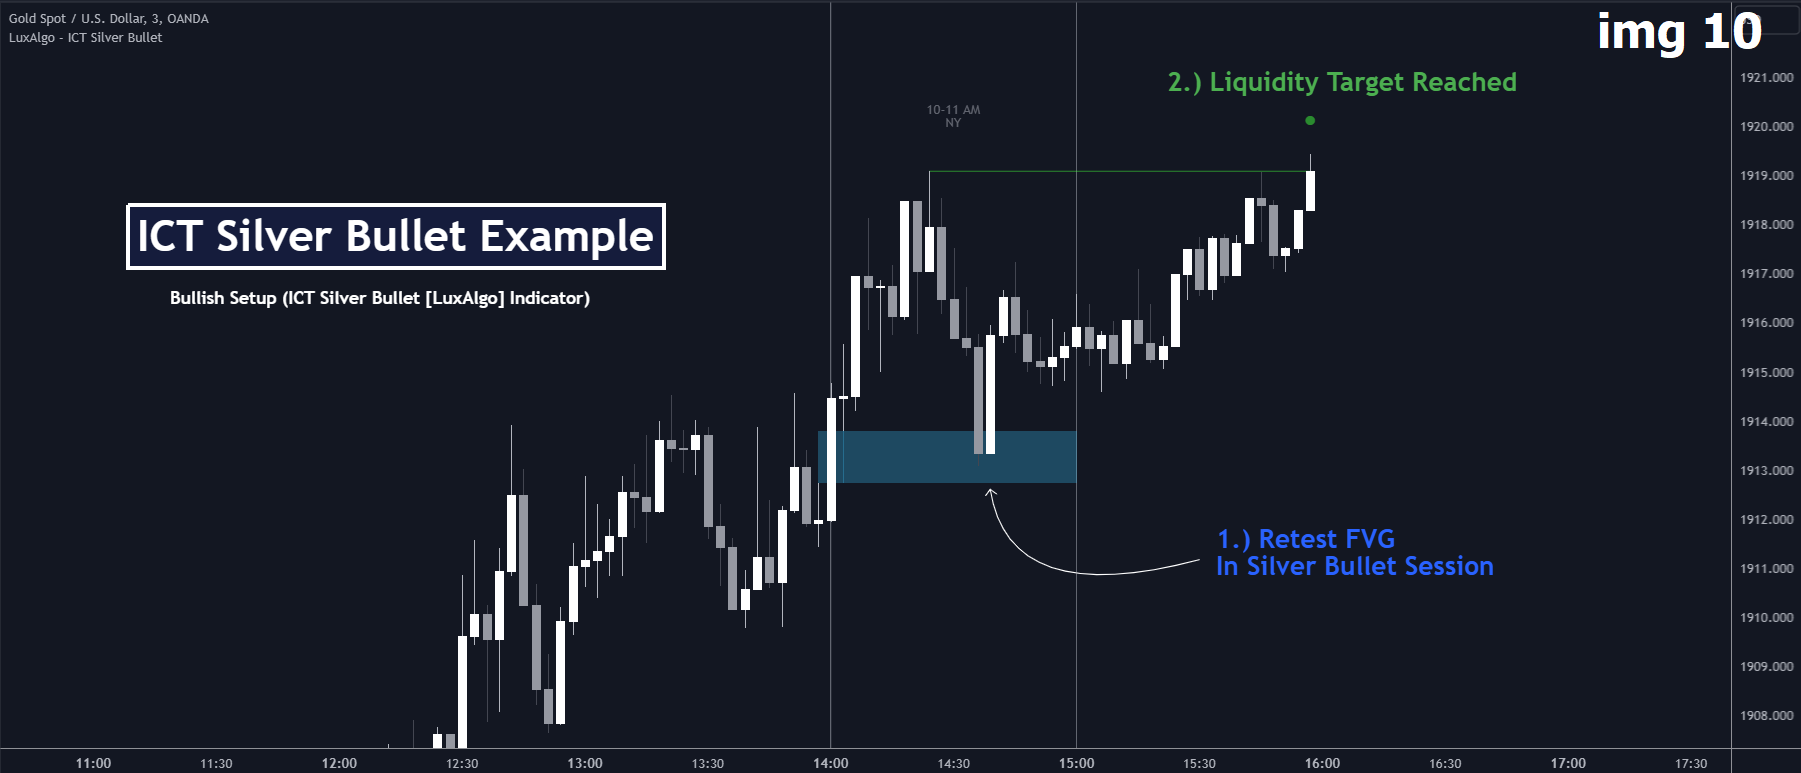
The ICT Silver Bullet indicator aims to provide users a comprehensive display as similar as possible to how anyone would manually draw the concept on their charts.
It's important to use anything below the 15-minute timeframe to ensure proper setups can display. In this section, we are purely using the 3-minute timeframe.
In the image below, we can see a bullish setup whereas a FVG was successfully retested during the Silver Bullet session. This was then followed by a move upwards to liquidity as our target.